Cationic Dye (Methylene Blue) Removal from Aqueous Solution by Montmorillonite
Baybars Ali Fil,* Cengiz Özmetin,† and Mustafa Korkmaz†Atatürk University, Faculty of Engineering, Department of Environmental Engineering, 25240, Erzurum-Turkey *E-mail: [email protected]
†Bal kesir University, Faculty of Engineering, Department of Environmental Engineering, 10145, Balýkesir-Turkey Received January 30, 2012, Accepted June 30, 2012
Color impurity in industrial effluents pose a significant risk to human health and the environment, so much effort has been expended to degrade them using various methods, including the use of clay minerals as adsorbent. The purpose of this study was to advance understanding of the mechanisms for the removal of methylene blue (MB) from aqueous solutions onto montmorillonite as an adsorbent. Preliminary experiments showed that montmorillonite was effective for this purpose and adsorption equilibrium could be reached in about 24 h. Adsorption capacity of the clay decreased with increase in temperature and ionic strength, and increased with in pH. The fitness of equilibrium data to common isotherm equations such as the Langmuir, Freundlich, Elovich, Temkin and Dubinin-Radushkevich were tested. The Langmuir equation fitted to equilibrium data better than all tested isotherm models. Thermodynamic activation parameters such as ΔG0, ΔS0 and ΔH0 were also calculated and results were evaluated. As result montmorillonite clay was found as effective low cost adsorbent for removal of cationic dyes from waste waters.
Key Words : Montmorillonite, Methylene blue, Clay, Adsorption isotherms, Thermodynamic
Introduction
Dye effluents from dye manufacturing and dye consuming industries such as food, paper, plastic, textile, etc. are one of the most problematic water pollution causes. Besides, most of the dyes are resistant to biodegradation and release of the effluents to the aquatic medium increases the biological load.1 The discharge of these effluents to receiving environ-ments results in serious health problems as some dyes (e.g. Azo dyes) are of carcinogenic effects on the living organisms.2 Dyes in surface waters are of barrier effect on the sun light penetration and aeration of water body, and thus reduce photosynthetic activity. The toxic nature of the dye effluents causes to death of soil microorganisms when they are used for irrigation purposes and this affects agricultural productivity.3
Methylene blue (MB) is the cationic dye that is most commonly used for coloring. It is generally used for dyeing cotton, wool, and silk. MB can cause eye burns in humans and animals, methemoglobinemia, cyanosis, convulsions, tachycardia, dyspnea, irritation to the skin, and if ingested, irritation to the gastrointestinal tract, nausea, vomiting, and diarrhea.4
Therefore, decolonization of dyes is important aspects of wastewater treatment before discharge. It is difficult to remove the dyes from the effluent, because dyes are not easily degradable and are generally not removed from wastewater by conventional wastewater systems. Generally biological aerobic wastewater systems are not successful for decolonization of majority of dyes. Therefore, color removal was extensively studied with physco-chemical methods as coagulation, ultra-filtration, electro-chemical adsorption and
photo-oxidation.5 Adsorption is widely used in the removal of contaminants from wastewaters. The design and efficient operation of adsorption processes require equilibrium ad-sorption data. The equilibrium isotherm plays an important role in predictive modeling for analysis and design of ad-sorption systems.6
Activated carbon is the effective alternate for the con-centration of dye ions even in the case of lower solute concentration. However activated carbon adsorption is limit-ed due to the high cost of activatlimit-ed carbon and the cost involved in regenerating it. The use of cheep adsorbents for the removal of color from its aqueous solution will provide as a potential alternate to the conventional treatment techni-ques. Recent investigations by several researchers proved onto use of low-cost, reusable, locally available, biodegrad-able adsorbent made from natural sources like peat,6 coconut husk,7 chitosan,8 mesoporous silica,9,10 chitosan-g-poly (acrylic acid)/montmorillonite nanocomposite,11 bituminous coal,12 activated palm ash,13 palygorskite,14 kudzu,15 fly ash16 and peanut husk.17 Natural and modified clays like kaolinite,18,19 activated clay,20 vermiculite,21,22 clinoptilo-lite,23 smectite,24,25 natural and modified zeolites,26 Maghnia montmorillonite,27 perlite28 and bentonite29,30 are being con-sidered as alternative low-cost adsorbents. A large variety of non-conventional adsorbent materials have been also pro-posed and studied for their ability to remove dyes.31
The main objects of this paper are: (i) to study the feasibility of using montmorillonite as an adsorbent for the removal of a cationic dye, methylene blue, (ii) to determine the various parameters affecting sorption, such as pH, ionic strength and temperature, (iii) to determine the applicability of various isotherm models (i.e., Langmuir, Freundlich,
Temkin, Elovich and Dubinin-Radushkevich) to find out the best-fit isotherm equation, and (iv) to determine thermo-dynamic and kinetic parameters and explain the nature of adsorption.
Material and Methods
Materials. The montmorillonite sample was obtained from Süd-Chemie Processing Plants (Balikesir, Turkey). The chemical composition and physicochemical properties of the montmorillonite found in Turkey were given in Table 1. The montmorillonite sample was treated before using in the experiments as follows: the bulk containing 10 g L−1 montmorillonite was mechanically stirred for 24 h, after waiting for about two minutes the supernatant suspension was filtered through a what-man filter paper (Φ = 12.5 cm (diameter of filter paper)). The solid sample was dried at 110
oC for 24 h, and then sieved by 45-90 mesh sieve. The
specific surface area of montmorillonite was measured by BET N2 adsorption.
All reagents were of analytical grade chemicals. All solutions were prepared with double distilled water. The cationic dye used in this study, MB was purchased from Merck Co., Germany. MB has a molecular weight of 373.9 g mol−1 and its chemical formula is C16H18ClN3S·3H2O.32 The
structure of MB dye is illustrated (Fig. 2) MB concentration in the sample solution was determined using a spectro-photometer (UNICAM UV-visible spectrospectro-photometer) at a wavelength of 663 nm.33 Calibration curves were plotted between absorbance and concentration of the dye solution.
Methods. The adsorption of methylene blue from aqueous
a contact periods; up to 24 h was finally selected for all of the equilibrium tests. At the end of the adsorption period, the solution were centrifuged for 15 min at 5000 rpm and then the concentrations of the residual dye, Ce, was determined
with a spectrophotometer (UNICAM UV-visible spectro-photometer) at a 663 nm wavelength, at which the maximum absorbency occurred. Blanks containing no dye were used for each series of experiments. The effect of pH was observed by studying the adsorption of dye over a pH range of 5-9. The pH of the solution was adjusted with 1 mol L−1 NaOH or HCl solution by using an Orion 920 a pH-meter equipped with a combined pH electrode. The sorption studies were also carried out at different temperatures, i.e., 303, 313, 323 and 333 K, to determine the effect of temperature and to evaluate the sorption thermodynamic parameters. A therm-ostatic shaker bath was used to keep the temperature con-stant.
The amounts of dye adsorbed were calculated from the concentrations in solutions before and after adsorption. Each experimental point was an average of two independent adsorption tests.34
Following formula was used to determine adsorbed dye concentration qe:
(1) where qe (mol g−1) is the amount of dyes adsorbed (mol g−1),
C0 (mol L−1) is the initial dye concentration, Ce (mol L−1) is
the concentration of dye in solution at equilibrium, V (L) is the volume, and m (g) is the amount of the adsorbent.
Result and Discussion Adsorption Isotherm.
Langmuir Isotherm: The Langmuir isotherm theory as-sumes monolayer coverage of adsorbate over a homogenous adsorbent surface.35 Graphically, a plateau characterizes the Langmuir isotherm. Therefore, at equilibrium, a saturation point is reached where no further adsorption can occur. Once a dye molecule occupies a site, no further adsorption can take place at that site. Langmuir isotherm can be given as follows. (2) qe = (C0–Ce)V m ---qe = qmKLCe 1 K+ LCe ---(b) Color White Density (g/cm3) 2.3-3
Transparency Semi-transparent and opaque Brightness Matt
Surface area (m2/g) 95.36 Reflective index 1-2
when linearized, Eq. (2) becomes
(3) where, qe is the adsorbed amount at equilibrium (mol g−1), qm maximum adsorption capacity (mol g−1), KL . Values of KL and qm were calculated from the intercept and slope of the plots of Ce/qe versus Ce (Eq. 3). The linear plots of Ce/qe
versus Ce (Figs. 2-4) show a good agreement between
experimental. The results were illustrated (Table 2).
The shape of the isotherm may also be considered with a view to predicting if an adsorption system is ‘favorable’ or ‘unfavorable’. The essential characteristics of Langmuir isotherm can be expressed by a dimensionless constant called equilibrium parameter, RL,36 which is defined by;
Ce qe --- = 1 qmKL --- + 1 qm ---Ce
Figure 2. Langmuir isotherm for methylene blue dye adsorption onto montmorillonite at different temperatures (natural pH, ionic strength 0 mol/L NaCl, 150 rpm of stirrer speed, adsorbent dosage 0.075 g/50 mL and contact time 24 h.)
Figure 3. Langmuir isotherm for methylene blue dye adsorption onto montmorillonite at different ionic strengths (temperature at 303 K, natural pH, 150 rpm of stirrer speed, adsorbent dosage 0.075 g/50 mL and contact time 24 h.)
Figure 4. Langmuir isotherm for methylene blue dye adsorption onto montmorillonite at different pHs (temperature at 303 K, ionic strength 0 mol/L NaCl, 150 rpm of stirrer speed, adsorbent dosage 0.075 g/50 mL and contact time 24 h.)
Table 2. Isotherm constants for methylene blue adsorption onto montmorillonite
Parameters Isotherm Models
Te mper atur e pH Io ni c st re ng th (m ol L
−1) Langmuir isotherm Freundlich isotherm Temkin isotherm Elovich isotherm
Dubinin-Radushkevich isotherm qm (× 104) KL R 2 KF (× 103) 1/n R 2 KT (× 10−5) b (× 10−6) R 2 qm (× 105) KE (× 10−4) R 2 qm (× 104) B (× 1010) E R 2 303 5.95 0 6.766 61.189 0.999 6.181 0.300 0.881 17.240 27.646 0.976 13.571 90.918 0.920 15.755 -24.503 14.285 0.930 313 5.95 0 6.297 92.263 0.999 5.873 0.309 0.873 10.796 29.239 0.982 13.368 57.103 0.919 14.858 -24.317 14.339 0.918 323 5.95 0 5.992 173.576 1.000 8.365 0.372 0.857 3.185 26.777 0.970 17.054 11.911 0.853 17.294 -29.193 13.087 0.902 333 5.95 0 5.362 277.885 0.999 8.653 0.398 0.834 1.945 28.645 0.949 17.988 5.726 0.772 16.878 -30.487 12.806 0.882 303 5.95 0 6.766 61.189 0.999 6.181 0.300 0.881 17.240 27.646 0.976 13.571 90.918 0.920 15.755 -24.503 14.285 0.930 303 5.95 1 × 10⁻³ 6.274 106.320 0.999 5.901 0.312 0.915 10.381 28.682 0.989 13.012 58.290 0.956 14.436 -25.843 13.910 0.954 303 5.95 1 × 10⁻² 5.721 167.983 0.999 6.349 0.341 0.902 4.844 28.334 0.985 13.881 23.542 0.931 14.475 -29.523 13.014 0.943 303 5.95 1 × 10⁻¹ 4.953 238.242 1.000 5.855 0.353 0.868 3.159 30.358 0.965 13.742 12.821 0.862 13.357 -31.82 12.535 0.912 303 5.00 0 5.804 85.289 0.999 4.277 0.276 0.865 21.692 33.544 0.967 10.984 120.087 0.902 12.473 -22.896 14.778 0.916 303 5.95 0 6.766 61.189 0.999 6.181 0.300 0.881 17.240 27.646 0.976 13.571 90.918 0.920 15.755 -24.503 14.285 0.930 303 7.00 0 7.911 69.267 0.999 13.031 0.377 0.870 5.446 19.973 0.976 21.187 20.578 0.884 24.259 -31.894 12.521 0.919 303 9.00 0 8.554 49.215 0.999 14.593 0.374 0.839 6.860 18.721 0.968 23.053 23.980 0.841 27.130 -31.358 12.627 0.891
with interaction between adsorbed molecules. The Freund-lich equation is generally expressed as follows:
(5) The linear expression takes the following form:
(6) where, qe is the adsorbed amount at equilibrium (mol g−1),
KF the Freundlich equilibrium constant (mol g−1)/(mol L−1)1/n,
1/n is indicative of the energy or intensity of the reaction and suggests the favorability and capacity of the adsorbent/ adsorbate system. To determine the constant KF and 1/n,
may be used to plot ln qe against ln Ce. The results were
illustrated (Table 2).
Elovich Isotherm: The equation defining the Elovich model is based on a kinetic principle assuming that the adsorption sites increase exponentially with adsorption, which implies a multilayer adsorption. It is expressed by the relation:38
(7) when linearized, Eq. (7) becomes
(8) where KE is the Elovich equilibrium constant (L mol−1) and
qm is the Elovich maximum adsorption capacity (mol g−1). If
the adsorption obeys Elovich equation, Elovich maximum adsorption capacity and Elovich constant can be calculated from the slopes and the intercepts of the plot ln (qe/Ce)
versus qe. The results were illustrated (Table 2).
Temkin Isotherm: Temkin considered the effects of some indirect adsorbate/adsorbate interactions on adsorption isotherms.39 He suggested that, because of these interactions and ignoring very low and very large values of concent-ration, the heat of adsorption of all molecules in the layer would decrease linearly with coverage.
(9) when linearized, Eq. (9) becomes
where qm the monolayer adsorption capacity(mol g−1) and B
the activity coefficient related to mean sorption energy (mol2 J−2) and ε is the Polanyi potential are the D-R constants and ε can be correlated as:
(12) The constant B gives the mean free energy E (kJ mol−1) of sorption per molecule of sorbate when it is transferred to the surface of the solid from infinity in the solution and can be computed using the following relationship:41
(13) when linearized, Eq. (11) becomes
(14) The adsorption isotherm constant qm and B, can be
deter-mined experimentally by plotting of ln qe versus ε2. The results were illustrated (Table 2).
The capacity of montmorillonite for MB can be determin-ed by measuring equilibrium isotherms. Basically, adsorp-tion isotherm is important to describe how adsorbate inter-acts with adsorbents. The relationship between the amount of adsorbate adsorbed on the adsorbent and the concent-ration of dissolved adsorbate in the liquid at the equilibrium can be given by the adsorption isotherms. The equilibrium adsorption isotherm of MB on the montmorillonite was showed (Figs. 2-4). It exhibits a steep increased at low concentrations, indicating high affinity towards the solute. At high MB concentrations, the adsorbed amounts increas-ed slightly, showing almost horizontal plateaus. Adsorp-tion isotherm study was carried out on five isotherm models: the Langmuir, Freundlich, Temkin, Elovich and Dubinin-Radushkevich isotherm models. The applicability of the isotherm equation to describe the adsorption process was judged by the correlation coefficients, R2 values. The corre-lation coefficient, R2 between 0.999-1.000 indicated that the adsorption data of MB on the montmorillonite was well fitted to the Langmuir isotherm. The Langmuir constants KL
and qm were calculated from Eq. (3) (Table 2). The fitness of
experimental data to Langmuir isotherm equation indicated the homogeneous nature of montmorillonite surface, i.e., qe = KFCe1/n ln qe = ln KF + 1 n ---ln Ce qe qm --- = KECe exp qe qm ---– ⎝ ⎠ ⎛ ⎞ lnqe Ce --- = ln KEqm− 1 qm ---qe qe = RT b ---ln K( TCe) ε = RT ln 1 C1 e ---+ ⎝ ⎠ ⎛ ⎞ E = 1 2B – ---ln qe = ln qm−Bε2
each dye molecule/montmorillonite adsorption had equal adsorption activation energy. The results also demonstrated the formation of monolayer coverage of dye molecule at the outer surface of montmorillonite. Similar observations were reported by the adsorption of MB on fibrous clay minerals,42 methyl violet on perlite43 and methylene blue on chitosan-g-poly (acrylic acid)/vermiculite hydrogel composites.21
Adsorption Equilibrium.
Effect of Temperature: In this section of study, a series of experiments were conducted at 303, 313, 323 and 333 K to study the effect of temperature to the adsorption of MB dye on montmorillonite. The adsorption of MB dye has decreased with increasing temperature (Fig. 5). Similar observations have been reported in the literature.7,44 When temperature increased, the physical bonding between the organic compounds (including dyes) and the active sites of the adsorbent weakened. Besides, the solubility of MB also increased with increase in temperature and, therefore the dye was more difficult to adsorb. The result may be attributed to that changing temperature could change the equilibrium capacity of the adsorbent for a particular adsorbate.33,45
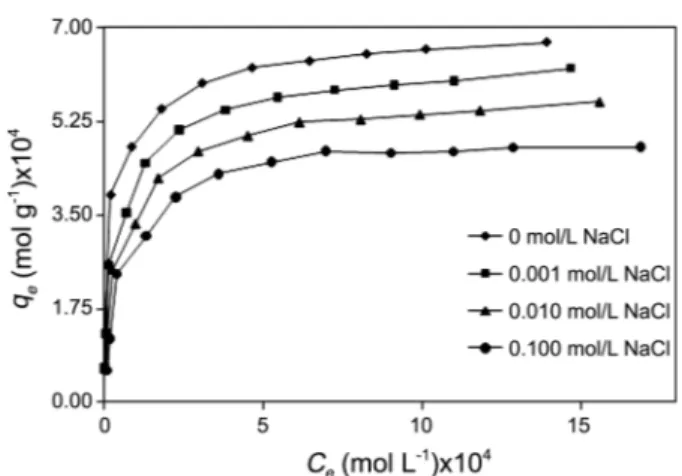
Effect of Ionic Strength: To observe the effect of ionic strength on adsorption capacity, 0-0.1 mol L−1 NaCl concen-tration was studied by keeping parameters constant temper-ature at 303 K, natural pH, 150 rpm of stirrer speed and contact time 24 h. Ionic strength is the most important variable in dye-clay interaction.46 In the present study, ionic strength of the solution exhibited some effect on adsorption of montmorillonite. The amount of MB adsorbed onto montmorillonite was decreased with increasing concent-ration of NaCl in solution (Figure 6). This result was similar to the investigation of Narine and Guy46 and Yu-Long Ma et al.,47 who studied the variation in adsorption of MB on
bentonite as a function of ionic strength. The reason for this is that, hydrated cations in the aqueous phase compete effectively for the adsorption sites on the clay. On the other hand, “ionic atmosphere may be progressively formed around MB molecules with increased NaCl concentration and results
in the reduction of MB adsorption onto montmorillonite. Effect of pH: The pH is one of the most important factors controlling the adsorption of dye onto adsorbent. Adsorption of MB onto montmorillonite was carried out for the ex-amination of the effect of pH at a range of 5.00-9.00 and it was found that the adsorption capacity increased with increase in pH (Figure 7). Figure showed that at low pH value, the adsorption was decreased. When solution pH increased from 5.00 to 9.00, the adsorption increased. The maximum dye uptake was observed in the pH range of 9.00. The basic dyes give positively charged ions when dissolved in water. Thus, in acidic medium positively charged surface of sorbent tends to oppose the adsorption of cationic sorbate species. When the pH of dye solution is increased the surface tends to acquire negative charge, thereby resulting in an increased adsorption of dyes due to increasing electro-static attraction between positively charged sorbate and negatively charged sorbent.48
As the pH of the aqueous phase is lowered, a solid surface will usually become more positive, or less negative, because
Figure 5. The effect of temperature on the adsorption of methylene blue on montmorillonite (natural pH, ionic strength 0 mol/L NaCl, 150 rpm of stirrer speed, adsorbent dosage 0.075 g/50 mL and contact time 24 h.)
Figure 6. The effect of ionic strength on the adsorption of methylene blue on montmorillonite (temperature at 303 K, natural pH, 150 rpm of stirrer speed, adsorbent dosage 0.075 g/50 mL and contact time 24 h.)
Figure 7. The effect of pH on the adsorption of methylene blue on montmorillonite (temperature at 303 K, ionic strength 0 mol/L NaCl, 150 rpm of stirrer speed, adsorbent dosage 0.075 g/50 mL and contact time 24 h.)
tion, with consequent increase in the adsorption of anionic surfactants and decrease in the adsorption of cationics. At acidic media, electrostatic repulsion occurred between the dye ions and the edge groups with positive charge (Si-OH2+) on the surface as follows:
−SiOH + H+→ −SiOH
2+ + OH− (15)
In an alkaline medium (pH > 7), the surface of montmorillo-nite clay becomes negatively charged and electrostatic repulsion decreases with raising pH due to reduction of positive charge density on the sorption edges thus resulting in an increase dye adsorption. This mechanism can be shown as follows:
−SiOH + OH− −SiO− + H
2O (16)
−SiOH + Dye+→ −Si−O−Dye+ (17)
The pH value of the solution is an important parameter for the adsorption processes, and the initial pH value of the solution has significant influence compared to than the final pH. In general, initial pH value may enhance or depress the uptake. This is attributed to the charge of the adsorbent surface with the change in pH value. Figure 7 showed the relationship between the pH value and the removal of methylene blue. It could be seen from the figure that as the solution pH increases, the adsorption capacity increases. Increasing solution pH increases the number of hydroxyl groups thus, increases the number of negatively charge sites and enlarges the attraction between dye and adsorbent surface. Generally, the net positive charge decreases with increasing pH value lead in the decrease in the repulsion between the adsorbent surface and the dye thus, improving the adsorption capacity.46
Heat of Adsorption. The Gibbs free energy change of the adsorption process is related to the equilibrium constant by the classic van’t Hoff equation
(18) According to thermodynamics, the Gibbs free energy change is also related to the entropy change and heat of adsorption at constant temperature by the following equation:
(19) Combining above two equations, we get
(20) Where ΔG0 the free energy change (kJ mol−1) is, ΔH0 is the change enthalpy (kJ mol−1), ΔS0 is entropy change (kJ mol−1 K−1), K= (qe/Ce) is constant (L g−1), is absolute temperature
(K) and Rg is the universal gas constant (8.314 J mol−1 K−1). Thus ΔH0 can be determined by slope of the linear van’t Hoff plot i.e. as ln K vs. (1/T), using equation:49
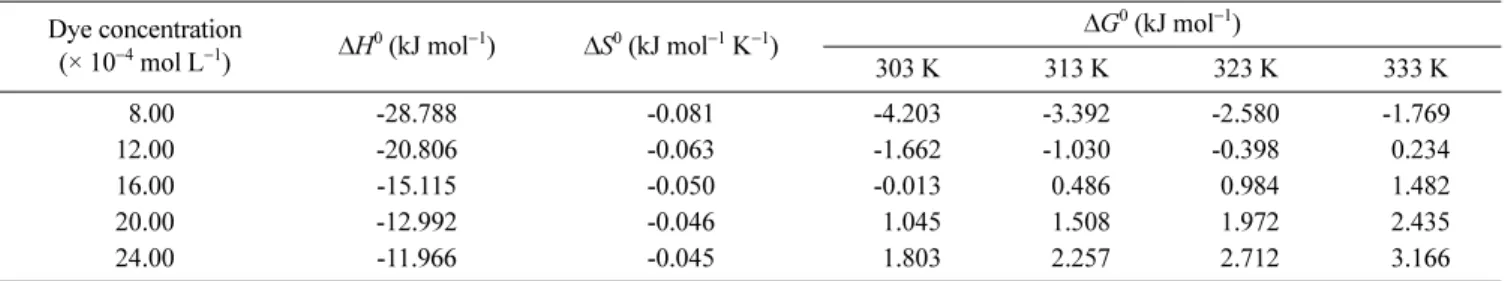
(21) The values of ΔH0, ΔS0 and ΔG0 for the initial dye concentrations of 8 × 10⁻⁴- 24 × 10−4 were shown (Table 3). The exothermic nature is also indicated by the decrease in the amount of adsorption with temperature (Fig. 8). The value of the enthalpy change indicates that the adsorption is physical in nature involving weak forces of attraction.36 In general, the adsorption process was exothermic with heats of adsorption for the concentration range of the dye solution. These values did not indicate strong chemisorptive bond formation between the dye molecules and the adsorbent surface.50 Similar result was also found for the adsorption of MB on coconut husk.7ΔG0 values for 8 × 10⁻⁴ and 12 × 10−4 mol L−1 at 303, 313 and 323 K were negatives but other values were positives (Table 3). The negative values of ΔG0 indicated that dye adsorption by montmorillonite was spon-⇔ ΔG0 = −RT ln K ΔG0 = ΔH0−TΔS0 ln K = Δ RT --- = Δ R ---− ΔH R ---T ---⋅ −ΔH--- = ∂Rg0 (ln K) ∂ 1/T( )
---Figure 8. Plots of ln K versus 1/T for adsorption of methylene blue on montmorillonite (natural pH, ionic strength 0 mol/L NaCl, 150 rpm of stirrer speed, adsorbent dosage 0.075 g/50 mL and contact time 24 h.)
taneous at lower temperatures and lower concentrations. Increasing of temperatures and concentrations caused the decreasing of feasibility of dye uptake. Similar thermo-dynamics values for cationic dyes removal was found in literature.51 Negative values of ΔS0 reveal the decreased ran-domness at the solid-solution interface during dye removal.52
Conclusions
The present study showed that montmorillonite was an effective adsorbent for the removal of methylene blue from aqueous solution. The results suggested that the adsorption capacity of methylene blue on montmorillonite adsorbent increased with increasing pH, but decreased with increased ionic strength and temperature. Equilibrium data were fitted to Langmuir, Freundlich, Temkin, Dubinin-Radushkevich and Elovich isotherms and the equilibrium data were best described by the Langmuir isotherm model. The negative ΔH0 value confirmed the exothermic nature of the
adsorp-tion interacadsorp-tion. Negative values of ΔS0 reveal the decreased randomness at the solid-solution interface during dye removal. The negative values of ΔG0 indicate that dye adsorption by montmorillonite was spontaneous at lower temperatures and lower concentrations. Increasing of temper-atures and concentrations caused the decreasing of feasibility of dye uptake.
Acknowledgments. The authors thank the Balikesir University Research Center of Applied Science (BURCAS).
References
1. Manu, B.; Chaudhari, S. Bioresour. Technol. 2002, 82, 225. 2. Métivier-Pignon, H.; Faur-Brasquet, C.; Le Cloirec, P. Sep. Purif.
Technol. 2003, 31, 3.
3. Zohra, B.; Aicha, K.; Fatima, S.; Nourredine, B.; Zoubir, D. Chem. Eng. J. 2008, 136, 295.
4. Senthilkumaar, S.; Varadarajan, P. R.; Porkodi, K.; Subbhuraam, C.V. J. Colloid Interface Sci. 2005, 284, 78.
5. D browski, A. Adv. Colloid Interfac. 2001, 93, 135.
6. Allen, S. J.; McKay, G.; Porter, J. F. J. Colloid Interf. Sci. 2004, 280, 322.
7. Tan, I. A. W.; Ahmad, A. L.; Hameed, B. H. J. Hazard. Mater. 2008, 154, 337.
8. Annadurai, G.; Ling, L. Y.; Lee, J. F. J. Hazard. Mater. 2008, 152, 337.
9. Huang, H.; Chang, K.-P.; Ou, H.-D.; Chiang, Y.-C.; Wang, C.-F. Micropor. Mesopor. Mat. 2011, 141, 102.
10. Fan, X.; Tu, B.; Ma, H.; Wang, X. Bull. Korean Chem. Soc. 2011, 38, 2560.
11. Wang, L.; Zhang, J.; Wang, A. Colloid Surface A 2008, 322, 47. 12. El Qada, E. N.; Allen, S. J.; Walker, G. M. Chem. Eng. J. 2006,
124, 103.
13. Hameed, B. H.; Ahmad, A. A.; Aziz, N. Chem. Eng. J. 2007, 133, 195.
14. Al-Futaisi, A.; Jamrah, A.; Al-Hanai, R. Desalination 2007, 214,
327.
15. Allen, S. J.; Gan, Q.; Matthews, R.; Johnson, P. A. Bioresour. Technol. 2003, 88, 143.
16. Talman, R. Y.; Atun, G. Colloid Surface A 2006, 281, 15. 17. Han, R.; Han, P.; Cai, Z.; Zhao, Z.; Tang, M. J. Environ. Sci.
(China) 2008, 20, 1035.
18. Harris, R. G.; Johnson, B. B.; Wells, J. D. Clay Clay Miner. 2006, 54, 449.
19. Harris, R. G.; Wells, J. D.; Angove, M. J.; Johnson, B. B. Clay Clay Miner. 2006, 54, 456.
20. Weng, C.-H.; Pan, Y.-F. J. Hazard. Mater. 2007, 144, 355. 21. Liu, Y.; Zheng, Y.; Wang, A. J. Environ. Sci. (China) 2010, 22,
486.
22. Rytwo, G.; Gonen, Y.; Huterer-Shveky, R. Clay Clay Miner. 2009, 57, 555.
23. Qiu, M.; Qian, C.; Xu, J.; Wu, J.; Wang, G. Desalination 2009, 243, 286.
24. Strawn, D. G.; Palmer, N. E.; Furnare, L. J.; Goodell, C.; Amonette, J. E.; Kukkadapu, R. K. Clay Clay Miner. 2004, 52, 321.
25. Guegan, R.; Gautier, M.; Beny, J.-M.; Muller, F. Clay Clay Miner. 2009, 57, 502.
26. Arma an, B.; Özdemir, O.; Turan, M.; Çelik, M. S. J. Chem. Technol. Biot. 2003, 78, 725.
27. Elaziouti, A.; Laouedj, N. J. Korean Chem. Soc. 2010, 54, 603. 28. Do an, M.; Alkan, M. Chemosphere 2003, 50, 517.
29. Anirudhan, T. S.; Suchithra, P. S. J. Environ. Sci. (China) 2009, 21, 884.
30. Özdemir, A.; Keskin, C. S. Clay Clay Miner. 2009, 57, 695. 31. Crini, G. Bioresour. Technol. 2006, 97, 1061.
32. Rodríguez, A.; García, J.; Ovejero, G.; Mestanza, M. J. Hazard. Mater. 2009, 172, 1311.
33. Dogan, M.; Alkan, M.; Türkyilmaz, A.; Özdemir, Y. J. Hazard. Mater. 2004, 109, 141.
34. Yang, X.-Y.; Al-Duri, B. Chem. Eng. J. 2001, 83, 15. 35. Langmuir, I. J. Am. Chem. Soc. 1918, 1361.
36. Hall, K. R.; Eagleton, L. C.; Acrivos, A.; Vermeulen, T. Ind. Eng. Chem. Fund. 1966, 5, 212.
37. Freundlich, H. M. F. J. Phys. Chem. 1906, 57, 385.
38. Elovich, S. Y.; Larionov, O. G. Russ. Chem. Bull. 1962, 2, 209. 39. Temkin, M. I. Zh. Fiz. Khim. 1941, 15, 296.
40. Dubinin, M. M.; Radushkevich, L. V. Chem. Zentr. 1947, 55, 331. 41. Hasany, S. M.; Chaudhary, M. H. Appl. Radiat. Isotopes 1996, 47,
467.
42. Hajjaji, M.; Alami, A.; Bouadili, A. E. J. Hazard. Mater. 2006, 135, 188.
43. Do an, M.; Alkan, M. J. Colloid Interf. Sci. 2003, 267, 32. 44. Purkait, M. K.; Maiti, A.; DasGupta, S.; De, S. J. Hazard. Mater.
2007, 145, 287.
45. Al-Qodah, Z. Water. Res. 2000, 34, 4295.
46. Narine, D. R.; Guy, R. D. Clay Clay Miner. 1981, 29, 205. 47. Ma, Y. L.; Xu, Z. R.; Guo, T.; You, P. J. Colloid Interf. Sci. 2004,
280, 283.
48. Özdemir, Y.; Do an, M.; Alkan, M. Micropor. Mesopor. Mat. 2006, 96, 419.
49. Wong, Y. C.; Szeto, Y. S.; Cheung, W. H.; McKay, G. Process Biochem. 2004, 39, 695.
50. Alkan, M.; Do an, M. J. Colloid Interf. Sci. 2001, 243, 280. 51. Gunay, A.; Arslankaya, E.; Tosun, I. J. Hazard. Mater. 2007, 146,
362.
52. Nandi, B. K.; Goswami, A.; Purkait, M. K. J. Hazard. Mater. 2009, 161, 387. a˛ g o g o g o g o g o