JOURNAL OF HOUSING ECONOMICS7, 343–376 (1998) ARTICLE NO. HE980238
Individual and Neighborhood Effects on FHA Mortgage
Activity: Evidence from HMDA Data
Zeynep O¨ nder*
Faculty of Business Administration, Bilkent University, Bilkent, Ankara 06533, Turkey E-mail: [email protected]
Received August 19, 1998
The effects of individual and neighborhood characteristics on relative FHA-insured mortgage applications and originations are examined. A sample of low-and moderate-income households drawn from the 1990 low-and 1991 Home Mortgage Disclosure Act is analyzed using census tract data. Although the relationship be-tween relative FHA-insured mortgage activity and minority composition in a census tract is not significant, there is a negative relationship between median family income and FHA-insured mortgage activity controlling for individual characteristics of
borrowers and some census tract characteristics. 1998 Academic Press
Several studies have examined the characteristics of borrowers of Federal Housing Administration (FHA) insured loans and neighborhoods that the FHA serves. These studies find that minorities are more likely to use FHA loans (Canner et al., 1991; Gabriel and Rosenthal, 1991); FHA mortgage activity is higher in central cities and low-income neighborhoods than in other neighborhoods (MacRae et al., 1982; Barth et al., 1983). However, these studies have left some questions unanswered. First, ex post data are used in their analyses. Therefore, it is not clear whether minorities are more likely to get FHA loans because they demand more FHA loans or because they are more likely to be denied for conventional loans. It is known that minorities are exposed to FHA loans more often than whites (Yinger, 1991). Second, since FHA loans are assumable, studies based on loans that home owners actually have, rather than those that they selected at the time of purchase, may reflect effects other than mortgage choice. Third, previous studies that examine the effect of indivdual and neighbor-hood characteristics on FHA borrowing are not very comprehensive. In
* I would like to thank Bob Avery for providing the data and for his guidance and comments. In addition, helpful comments are provided by Peter Zorn, Austin Kelly and David Burchfield. All remaining errors are mine alone. This study was supported by U.S. Department of Housing and Urban Development Dissertation Grant.
343
1051-1377/98 $25.00
Copyright1998 by Academic Press All rights of reproduction in any form reserved.
general, they use either the American Housing Survey or the Survey of Consumer Finances. The former covers only a few MSAs and the latter samples mostly from relatively high-income households.
This study tries to eliminate some of the problems faced by the previous research in answering the empirical question of what markets and whom FHA mortgage insurance programs serve. First, the dataset used in this study is taken from the Home Mortgage Disclosure Act (HMDA) data which are most relevant U.S. observations.1Second, it examines both
mort-gage applications (pre-approval demand) and mortmort-gage originations (post-approval outcome) in order to identify whether mortgage applications for FHA loans differ from mortgage originations. Third, the empirical model tries to segregate the individual effects from the neighborhood effects.
Answering the question of what kind of people or neighborhoods the FHA serves will be useful for housing policy makers who decide continuity and availability of FHA-insured mortgage loans to these individuals and neighborhoods. Recent developments in the mortgage insurance market might jeopardize the continuity of the FHA’s mortgage insurance programs. First, the FHA’s losses were close to $6 billion during the 1980s (Hender-shoot and Waddell, 1992). Second, the Housing and Community Develop-ment Act of 1992 requires that a certain percentage of mortgages purchased by Government Sponsored Enterprises should be from central cities which are considered to be served by the FHA loans and for housing units occupied by families with income less than the median income (Weicher, 1994). Third, the Financial Institutions Reform, Recovery and Enforcement Act of 1989 requires Home Loan Banks to subsidize low income housing.
This study shows that although the relationship between relative FHA-insured mortgage activity and minority composition in a census tract is not significant, there is a negative relationship between median family income and FHA-insured mortgage activity controlling for individual characteris-tics of borrowers and some census tract characterischaracteris-tics. In addition, the results suggest that high black FHA loan originations can be explained by the high black FHA application.
This paper is organized as follows. The next section discusses previous studies examining the characteristics of FHA borrowers and their
neighbor-1Depository institutions, their direct subsidiaries and saving and loan associations and
mortgage lending institutions with assets exceeding $10 million are required to report their mortgage activities according to the HMDA reporting requirements. However, there is a debate about the coverage of the HMDA dataset. For example, comparing the loans purchased by Freddie Mac with the loans sold to Freddie Mac as reported in the 1992 HMDA dataset, Berkovec and Zorn (1996) estimate that the 1992 HMDA dataset contains only 70 percent of the total loans purchased by Freddie Mac even though the coverage of mortgage institutions are expanded at the end of 1991. In addition, their results show that the HMDA coverage rate is higher in the lower income census tracts relative to the higher income census tracts.
HMDA EVIDENCE ON FHA MORTGAGE ACTIVITY 345
hoods. The third section explains the empirical model and the data used. The results of the analysis and the conclusion follow.
BACKGROUND
The aim of the FHA is to increase home ownership among low- and moderate-income households by insuring home mortgages with low down-payments.2In order to achieve this objective, home buyers are required to
pay mortgage insurance to the FHA. In return, lenders are 100% protected in the case of default on the part of the borrower. Since the FHA requires a lower downpayment and is more flexible in terms of other liquidity conditions,3 liquidity-constrained and riskier borrowers are expected to
receive more FHA loans than conventional loans relative to less risky borrowers (Gabriel and Rosenthal, 1991).
In the mortgage choice literature, it is generally argued that individual borrowers maximize their expected utilities given their budget sets and wealth. Individuals who do not have enough down payment or who are constrained by the underwriting requirements of the private mortgage insur-ance companies are found to be more likely to choose an FHA loan relative to a conventional loan (for example, see Hendershoot and LaFayette, 1994). Theoretically, Brueckner (1985) shows that those borrowers who get higher utility from current consumption are more likely to get an FHA loan. However, although Bruecker assumes a competitive and homogeneous mortgage market in his model, the real mortgage market is not homoge-neous; the lenders would offer different mortgages at different rates to their borrowers, depending on their riskiness. Therefore, each borrower faces a different choice set, depending on a borrower’s riskiness or on other factors.
It can be argued that lenders originate different mortgages based on the riskiness of an applicant. If the mortgage applicant is riskier, lenders can credit ration their customers either by increasing the interest rate on the
2
An individual borrower can get a mortgage without insurance if the loan-to-value (LTV) ratio is below 0.80. If LTV ratio is above 0.80, lenders require borrowers to procure mortgage insurance which affords protection to lenders in case of a default of an individual borrower. Private mortgage insurance companies generally do not insure mortgages with LTV ratios above 0.95. If they do, they price them to reflect additional risk. However, during the years of this study, through the FHA, it was possible to get FHA-insured mortgages with high LTV ratios.
3For example, according to the government sponsored enterprises’ underwriting
require-ments, the monthly payment for mortgage principal, interest, taxes and insurance must be less than 28% of the monthly gross income. According to the FHA, total housing expenses to net income ratio should be 0.36.
conventional loan or by deciding not to provide the conventional loan to those borrowers. Duca and Rosenthal (1991) show that the FHA share of mortgage origination increases as the aggegate default risk increases. A study by Yinger (1991) has found that blacks and other minorities are more likely than whites to be notified about the availability of FHA-insured mortgages. The results of previous studies that blacks are more likely to get an FHA loan (for example, Gabriel and Rosenthal, 1991; Canner et
al., 1991) might be explained by the idea that blacks are more likely to
apply for an FHA loan. Then, the results would not be because of a high mortgage denial rate but rather because of a high FHA application rate by black households. In addition, since the FHA provides 100% insurance to lenders in the case of a default by the borrower, lenders have an incentive to originate FHA loans relative to conventional loans when the default risk for a borrower is high.
There is a correlation between the individual characteristics and the neighborhood characteristics in which an individual lives. For example, Gabriel and Rosenthal (1989) show that there is a tendency among minori-ties to live in minority neighborhoods. It implies that not only individual characteristics but also neighborhood characteristics may affect the type of loan applied for or received. However, most of the previous studies examin-ing the effect of neighborhood characteristics on FHA mortgage activity do not control for individual factors (for example, MacRae et al., 1982; Megbolugbe et al., 1994). Therefore, it is not possible to conclude whether blacks are more likely to get FHA loans because they are black, live in neighborhoods with growing minority population, or live in central cities, or are more likely to apply for the FHA-insured loans. Although Canner
et al. (1991) control for some neighborhood characteristics in the analysis
of the probability of getting a conventional loan, their sample is very small. This study investigates the effect of neighborhood characteristics on relative FHA mortgage activity by controlling for the individual mortgage applicant’s characteristics. In addition, it examines the effect of individual characteristics on mortgage applications and originations between FHA-insured and conventional loans by controlling for neighborhood characteris-tics. The next section explains the empirical model used in this study.
EMPIRICAL MODEL
The current literature on the mortgage choice between FHA and conven-tional loans suggests that the factors affecting the mortgage choice can be basically grouped into two categories: individual and neighborhood characteristics. Individual factors include race, default risk, liquidity condi-tion, age, available wealth of an individual, and value of a house. All affect the type of mortgage that an individual can receive. Neighborhood
HMDA EVIDENCE ON FHA MORTGAGE ACTIVITY 347
characteristics include demographic factors such as racial composition, eco-nomic factors, housing characteristics, FHA loan limit, and availability of alternative mortgage instruments or mortgage programs in the neighbor-hood. So, in the analysis of what markets and what individuals the FHA serves, both individual and neighborhood factors should be included in the model. Given this information, the general model for an individual’s choice for an FHA loan can be written
P(FHAuapply for a mortgage)i5 f(XIi, XNi), (1)
where P(FHAuapply for a mortgage)iis the probability than an individual
i applies for an FHA loan given that an individual i applied for a mortgage. XIiand XNirepresent the characteristics of individual i and the
characteris-tics of the neighborhood where individual i lives, respectively.
A variety of functional forms can be used to present the relationship in equation (1). A linear probability model is selected as a specification for this equation because of the size of the HMDA data,
P(FHAuXI, XN)i5 a01 XIia11 XNia21 ei, (2)
where P(FHAuXI, XN)iis the conditional probability that individual i will
apply for an FHA loan given individual and neighborhood characteristics. If the error term in the regression equation, ei, meets the assumptions of
the classical regression model, the coefficients in Eq. (2) can be estimated consistently. If data on XIand XNwere available, all of the apparatus of
the classical model would apply. However, in reality, some of the variables that are represented by XI and XN are not available and may have only
crude proxies. Thus, the actual variables can be expressed as a combination of observed variables and error terms,
XIi5 INDIVIDUALi1 eIi
XNn5 NEIGHBORHOODn1 eNn,
where INDIVIDUALirepresents a vector of characteristics of individual i,
reported in the HMDA data, which are used as proxies for the actual vari-ables, XI. Similarly, NEIGHBORHOODnrepresents a vector of
characteris-tics of neighborhoods available from the 1980 and 1990 U.S. Censuses that are used as proxies for the actual neighborhood characteristics, XN. eIiand eNnare the error terms since INDIVIDUALiand NEIGHBORHOODnare
only proxies for the actual variables. Thus, Eq. (2) can be written
P(FHAuXI, XN)i5 a01 INDIVIDUALia11 NEIGHBORHOODia21 ui,
where ui5 ei2 a1eIi 2 a2eNi. Since INDIVIDUALi and
NEIGHBOR-HOODiare correlated with error terms, one of the central assumptions of
the classical regression model is violated and the least squares estimation will not provide consistent estimates. In order to get consistent estimates, a two-stage estimation mechanism is used in the analysis,4
Step I: P(FHAuXI, XN)in5 a*0 1 a*I INDIVIDUALi1
O
N n51bnDin1 e*in
Step II:bˆn5d*0 1d*NNEIGHBORHOODn1 e*n,
where Dinis a vector of dummy variables indicating the census tract n where
the loan application of an individual i is located andbˆnrepresents the fixed
effect coefficient on neighborhood n estimated from the regression equation in the first step. The consistent estimates of the coefficients on individual characteristics are obtained from the fixed effects model in the first stage.5
The second step is estimated at the neighborhood level. The estimated fixed effect coefficient in the first stage is used as a dependent variable in the second stage. It is regressed against neighborhood characteristics.
Two-stage analysis with the fixed effects model provides the benefit of getting pure effects at each level. For example, estimation at the individual level disentangles neighborhood effects. In addition to getting consistent estimates, another reason for the selection of two-stage analysis is that given the size of the HMDA data, it was impossible to estimate the model specified in Eq. (2). However, there is a disadvantage of getting biased estimates of standard errors. The next discussion presents the variables used in the estimation in each stage.
First Stage: Individual Level
In the first stage, it is assumed that an individual’s mortgage application can be expressed as a function of some individual characteristics, such as income, race, sex, existence of a co-applicant, and neighborhood (census tract). A linear probability model is estimated at the individual level with the census tract fixed effects,
4This mechanism will eliminate the problem of getting inconsistent estimates due to the
correlation between XIand eN, or the correlation between XNand eI. The problem of getting
inconsistent estimates due to measurement errors still holds. For more detailed information on two-stage procedure, see Avery et al. (1993, 1994).
5The coefficients are consistent because including dummy variables for each neighborhood
in the model makes the error terms exclude any unobserved or observed neighborhood effects from the estimated coefficients on individual variables.
HMDA EVIDENCE ON FHA MORTGAGE ACTIVITY 349
Step I: P(FHA)in5
O
N n51bnDni1 INDIVIDUALinaI1 e*in,
where P(FHA)in is operationalized to be 1 if an individual i, in a census
tract n, is applying for or getting an FHA loan; it is 0 if the loan is a conventional loan. It is a conditional probability of applying for an FHA loan given that an individual applies for a mortgage. INDIVIDUALin
repre-sents a vector of an individual i’s characteristics living in a neighborhood
n. The individual variables include the existence of a co-applicant, the sex,
income, and race of an applicant, and those of a co-applicant. Ideally, more individual characteristics such as wealth, credit rating, age, and risk of an individual borrower need to be controlled for in the mortgage application process. However, the HMDA dataset does not provide such information. Therefore, only those individual characteristics reported in the HMDA dataset are included in the model. A reduced form model is estimated with income and some demographic characteristics of the individual applicant since the loan amount is endogeneous because of the FHA loan limit. It is known that the income level of some minority groups is different from that of whites. Therefore, the interaction variables for race and income are also included in the model.
Second Stage: Neighborhood (Census Tract) Level
The second stage is the estimation at the census tract level. The dependent variable in this stage is the fixed effect coefficient on each census tract dummy variable, estimated in the first stage. In other words, it is a part of FHA activity that is not explained by individual factors aggregated at the census tract level. Thus, the dependent variable is
Fixed effect coefficient5 bˆn5 FHAn2 INDIVIDUALnaˆI,
where FHAn is the observed percentage of FHA-insured applications in
census tract n (FHAn 5 (
o
Nni51 FHAin) /Nn, where Nn is the number of
individual applications in census tract n and FHAin is 1 if it is an FHA
loan), INDIVIDUALnis the average of each individual variable in tract
n (INDIVIDUALn5 (
o
Nni51 INDIVIDUALin)/Nn), andaˆ1represents the
estimated coefficients on each individual variable in the first step.
In the second stage, these neighborhood residuals are regressed on the various neighborhood characteristics. Two models are estimated in this stage, Model I:bˆn5d1 NEIGHBORHOODndN1 en Model II:bˆn5
O
M m51 dmDm1 NEIGHBORHOODndN1 en,where NEIGHBORHOODn represents the variables representing the
neighborhood characteristics in the census tract n. Dm represents dummy
variables indicating an MSA m where a census tract n is located. Model I assumes that it is the tract characteristics that count (within and between MSA variation). It shows the general effect of neighborhood characteristics on the probability of applying for or getting an FHA loan. Model II answers how neighborhood characteristics affect the probability of applying for or getting an FHA loan within the same MSA because some of the variation in FHA activity among neighborhoods can be attributed to the MSA charac-teristics such as FHA loan limit (within MSA variation).
The neighborhood characteristics are grouped into three categories: de-mographic characteristics, economic characteristics and housing market characteristics. Demographic characteristics include the minority percent-age of residents in the neighborhood, the change in minority share from 1980 to 1990, and the age distribution of the household heads. Minority shares in neighborhood in 1990 are represented with splines6 in order to
identify the effect of the different levels of minority shares in the census tract. In addition, the changes in minority shares from 1980 to 1990 are represented with dummy variables. An age of an individual applicant is approximated by the distribution of age of household heads in the neighbor-hood in 1990. In order to control for the size of the housing unit that an individual borrower will buy, the average household size for the owner-occupied units is also included in the model. The bigger the household, the more likely it is to demand a larger (more expensive) house, and the less likely to apply for and get an FHA loan, because of the FHA loan limit.
Economic characteristics are represented by median family income, its splines, and the dummy variables representing the percentage change in median family income from 1980 to 1990. A study by MacRae et al. (1983) finds a quadratic relationship between FHA activity and median income level in a neighborhood. A nonlinear relationship is imposed in the model with median family income splines.
Housing market characteristics include the distribution of housing units in terms of the number of units in structure, the housing occupancy vari-ables, the change in housing occupancy variables during the decade from 1980 to 1990, and the age distribution of housing units. It can be hypothe-sized that if the vacancy or rental rate is high in the neighborhood, the probability of deterioration is also high, and FHA activity will be high. In addition, if the percentage of older houses in the neighborhood is high, the probability of getting an FHA loan is expected to be high. Housing occu-pancy is measured by the rental and vacancy rates in 1990 and the change
6Throughout the range of values of minority share, the probability of getting an FHA loan
might be rising, but the slope might change at some percentages. One could fit the regression model by dividing the sample into subsamples and use dummy variables. However, this would neglect the continuity of the function. Instead, a spline function is applied.
HMDA EVIDENCE ON FHA MORTGAGE ACTIVITY 351
in these rates during the past decade. Since the FHA provides mortgage insur-ance for one- to four-family units, the rental rate, vacancy rate, and change in these rates are considered only for 1–4 housing units. The growth rate in total housing units is included in the model in order to control for the general economic conditions. The age of housing stock is approximated by the per-centage of housing units built in different time periods. Previous studies find that FHA activity is high in central cities, and these areas are found to be underserved by conventional mortgage lenders. A central city dummy vari-able is added to the model. The next section describes the data.
DATA
Only owner-occupied new home purchase mortgage applicants are in-cluded in the sample because a borrower has to be an owner-occupant to get an FHA loan. The sample includes only those households that have income less than or equal to 120% of the median family income in the corresponding Metropolitan Statistical Area (MSA). They can be consid-ered as representing low- and moderate-income households which are aimed to be served by the FHA.
Mortgage Applications and Originations
Individual level data are obtained from the Home Mortgage Disclosure Act (HMDA) data. According to this Act, the depository institutions (com-mercial banks, savings and loan associations, savings banks and credit unions), their direct subsidiaries, and other unaffiliated mortgage lending institutions with assets more than $10 million (Canner and Gabriel, 1992) are required to provide information about their mortgage applicants. The data have the highest coverage of mortgage applications in the United States.7
In this study, two years of HMDA datasets are used, 1990 and 1991. All mortgages are divided into two groups: FHA loans and conventional loans. In this study, all other loans that are not insured by the FHA are classified as conventional loans. They include state mortgage programs, privately insured loans and uninsured loans. The Veterans Administration (VA) and Farmers Home Association (FmHA) insured loans are not included in the sample.
Some characteristics of the applicants in the sample are presented in Table I. The samples from the 1990 and 1991 HMDA datasets show similar characteristics. The percentage of FHA-insured loans is higher than normal because of the elimination of high-income applicants and borrowers. The
7During 1990 and 1991, the HMDA did not require smaller mortgage bankers to report
their mortgage activities. Hence, the exclusion of the smaller mortgage bankers from the dataset will result in the underrepresentation of FHA loans. According to Berkovec and Zorn (1996), the HMDA dataset for 1992 is estimated to contain only 65% of total mortgage loans.
percentage of FHA-insured mortgage applicants who are black is 13.3 (13.1) in 1990 (1991).8However, the percentage of conventional loan applicants
who are black is only 5.8 (5.3). The black percentages decline slightly for originations: 11.2% (11.3%) of FHA-insured mortgage borrowers and 4.6% (4.2%) of conventional loan borrowers are black. The denial rates on FHA loans are lower than the conventional loans: 15.8% (15.7%) versus 20.7% (21.9%) percent. Although the median loan amount and loan-to-income ratio for FHA loans are higher than those for conventional loans because of higher allowable LTV ratios, median incomes of FHA applicants and borrowers are slightly lower than those for conventional loan borrowers.
Neighborhood Characteristics
The neighborhood data are obtained from the 1980 and the 1990 U.S. Censuses. In this study, neighborhood and census tract are used inter-changeably. Rural census tracts and census tracts with zero population (either in 1990 or in 1980) or those with nonpositive median house values, nonpositive median family income, or less than 50 total housing units (in either 1980 or in 1990) are excluded from the sample.9
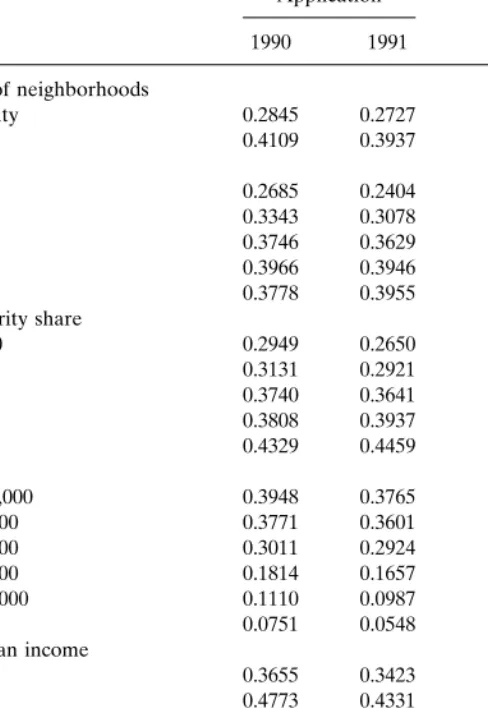
Table II shows the FHA application and origination rates of census tracts on the basis of several neighborhood characteristics weighted by the number of mortgage applications or mortgage originations in each neighborhood. According to the HMDA data and the U.S. Census, FHA application and FHA origination rates are higher in central cities and in more minority-popu-lated, low income, low house value, and high-risk neighborhoods, i.e., those neighborhoods with low growth rates in median house value and in median family income from 1980 to 1990. The descriptive statistics of the census tract characteristics included in the model are presented in the Appendix.
RESULTS Individual Characteristics
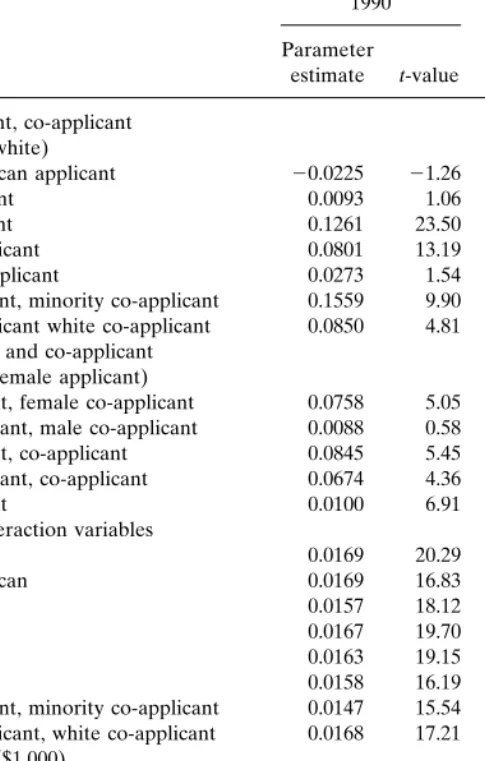
Mortgage Applications. The results of the linear probability model with neighborhood fixed effects for individual mortgage applications in 1990 and 1991 are presented in Table III. They are similar in both years. Dramatic
8
The figures in parentheses throughout the paper represent the corresponding figures in 1991.
9The characteristics of neighborhoods where the lender is located are used as an
approxima-tion for the individual borrower’s neighborhood characteristics because HMDA dataset pro-vides the location of the loan. Another limitation is that the 1990 and 1991 HMDA data use 1980 census tract definitions. The census tract definitions used in 1990 Census are different from the ones used in the 1980 Census. A common unit of analysis is needed in combining these data sets. Claritas converted the 1990 Census data into 1980 census tract definitions. Therefore, the 1990 Census data provided by Claritas are used in the analysis. Hence, the variables used in the second stage are only available from Claritas.
TABLE I Characteristics of 1990 and 1991 HMDA Data for the Sample of Low-and Moderate-Income Individuals (in Percent) a Mortgage applications Mortgage originations 1990 1991 1990 1991 conven-total tional FHA total tional FHA total tional FHA total tional FHA Race of applicant Native American 0.6 0.6 0.5 0.5 0.5 0.5 0.5 0.6 0.5 0.5 0.5 0.5 Asian 3.4 4.1 2.0 3.2 3.7 2.0 3.5 4.3 2.0 3.2 3.8 2.1 Black 8.4 5.8 13.3 7.8 5.3 13.1 6.9 4.6 11.2 6.6 4.2 11.3 Hispanic 7.2 7.1 7.5 7.0 6.2 8.7 6.6 6.4 7.1 6.3 5.4 8.1 White 79.8 81.6 76.1 80.8 83.6 75.2 81.7 83.4 78.8 82.7 85.3 77.6 Other 0.7 0.8 0.4 0.7 0.7 0.5 0.6 0.8 0.4 0.6 0.7 0.5 Race of co-applicant Same as applicant 57.4 58.7 55.0 54.9 55.8 53.2 57.4 58.9 54.6 55.1 56.0 53.0 Different from applicant 1.5 1.3 1.9 1.6 1.3 2.0 1.5 1.3 1.9 1.5 1.4 1.9 No co-applicant 41.1 40.0 43.1 43.5 42.9 44.8 41.1 39.8 43.5 43.4 42.6 45.1 Sex Male applicant, co-applicant 1.3 1.4 1.2 1.1 1.1 1.1 1.3 1.3 1.2 1.0 1.0 1.1 Female applicant, co-applicant 1.4 1.4 1.4 1.3 1.3 1.4 1.3 1.3 1.3 1.2 1.2 1.3 Male applicant, female co-applicant 51.7 51.9 51.2 49.5 49.7 49.1 52.1 52.6 50.9 50.0 50.5 49.0 Female applicant, Male co-applicant 4.5 5.3 3.1 4.5 5.0 3.6 4.3 4.9 3.0 4.3 4.7 3.5 Male applicant 21.1 20.6 22.0 21.7 21.6 21.9 20.7 19.9 22.2 21.1 20.8 21.8 Female applicant 20.0 19.4 21.1 21.8 21.3 22.9 20.4 19.9 21.3 22.3 21.8 23.3 Action Origination rate 81.0 79.3 84.2 80.1 78.1 84.3 Denial rate 19.0 20.7 15.8 19.9 21.9 15.7 Memo items: Median loan-to-income 1.9 1.8 2.1 1.9 1.8 2.1 1.9 1.8 2.1 2.0 2.4 2.1 Median loan amount ($1,000) 55 53 57 56 54 60 58 56 59 59 58 61 Median income ($1,000) 30 31 29 30 31 30 31 32 30 31 32 30 Total (% ) 100.0 66.2 33.8 100.0 67.8 32.2 100.0 64.8 35.2 100.0 66.1 33.9 Total number of individuals 783,790 518,876 264,914 788,800 534,502 254,298 634,587 411,421 223,166 631,623 417,299 214,324 aLow and moderate income households are defined as those that have income less than or equal to the MSA median family income. 353
TABLE II
Weighted Mean FHA Application and Origination Rates with Respect to Census Tract Characteristics
Application Origination 1990 1991 1990 1991 Characteristics of neighborhoods Non-central-city 0.2845 0.2727 0.2982 0.2898 Central city 0.4109 0.3937 0.4272 0.4125 Minority share 0.00–0.05 0.2685 0.2404 0.2804 0.2554 0.05–0.10 0.3343 0.3078 0.3475 0.3210 0.10–0.25 0.3746 0.3629 0.3938 0.3858 0.25–0.50 0.3966 0.3946 0.4180 0.4222 0.50– 0.3778 0.3955 0.3918 0.4226
Change in minority share
Less than 0.00 0.2949 0.2650 0.3136 0.2878 0.00–0.05 0.3131 0.2921 0.3253 0.3066 0.05–0.10 0.3740 0.3641 0.3916 0.3859 0.10–0.15 0.3808 0.3937 0.3988 0.4192 0.15– 0.4329 0.4459 0.4485 0.4692 Median income Less than $20,000 0.3948 0.3765 0.4191 0.4150 $20,000–$40,000 0.3771 0.3601 0.3990 0.3865 $40,000–$60,000 0.3011 0.2924 0.3107 0.3032 $60,000–$80,000 0.1814 0.1657 0.1868 0.1718 $80,000–$100,000 0.1110 0.0987 0.1152 0.0985 $100,000– 0.0751 0.0548 0.0792 0.0585
Change in median income
Less than 0% 0.3655 0.3423 0.3923 0.3772 0–25% 0.4773 0.4331 0.5012 0.4637 25–50% 0.4632 0.4426 0.4892 0.4739 50–100% 0.3463 0.3303 0.3614 0.3484 100–150% 0.2138 0.2125 0.2236 0.2238 150%– 0.2118 0.2090 0.2227 0.2234
Median house value
Less than $25,000 0.3607 0.3303 0.3866 0.3562 $25,000–$50,000 0.4524 0.4113 0.4796 0.4429 $50,000–$75,000 0.4242 0.3936 0.4455 0.4196 $75,000–$100,000 0.3706 0.3613 0.3858 0.3767 $100,000–$150,000 0.2681 0.2796 0.2808 0.2925 $150,000– 0.1064 0.1140 0.1139 0.1237
Change in median house value
Less than 0% 0.4646 0.4004 0.4815 0.4217 0–25% 0.4787 0.4480 0.4924 0.4629 25–50% 0.4067 0.3763 0.4228 0.3929 50–100% 0.3570 0.3374 0.3729 0.3590 100–150% 0.2418 0.2403 0.2562 0.2599 150%– 0.1104 0.1240 0.1161 0.1308
HMDA EVIDENCE ON FHA MORTGAGE ACTIVITY 355
racial differences between black and white mortgage applicants are ob-served in the analysis of low- and moderate-income mortgage applicants. Blacks were 12.61% (12.28%) more likely to apply for an FHA loan than white applicants in 1990 (1991), controlling for their income, sex, and co-applicant and the census tract where they applied for a mortgage. The difference is found to be less for other racial groups. For example, Hispanics are 8.01% (9.37%) more likely to apply for an FHA loan, but Native Ameri-cans are 2.25% (4.88%) less likely to apply for FHA loans than their white counterparts. No significant difference was found between Asian and white applicants.
There are several explanations as to why blacks are more likely to apply for FHA loans than their white counterparts. One explanation is that they are more likely to be exposed to FHA loans than whites, as reported by Yinger (1991). A second explanation is that there may be prescreening by lenders or by an individual applicant, which leads to more FHA applications because of the higher possibility of rejection with conventional loans. Third, in general, the relative wealth of blacks is less than that of whites,10 and
they are more likely to be liquidity-constrained than whites (Duca and Rosenthal, 1993 and 1994). Therefore, they may be more likely to apply for FHA loans than whites even though they have similar income levels. Unfortunately, the default risk and liquidity condition of applicants are not controlled for in this paper.11Fourth, it can be argued that blacks are more
likely to get smaller houses, requiring smaller loan amounts; hence, they are more likely to be eligible for FHA loans because of the FHA loan limit.12
10According to the 1989 Survey of Consumer Finances, the median total worth and the
median total financial assets of white households are $58,500 and $11,500, respectively. For nonwhite households, these figures are $4,000 and $2,000, respectively (Kennickel and Shack-Marquez, 1992).
11The same model is estimated for a sample of mortgage applicants that have income less
than or equal to 80% of the MSA median family income. The difference still holds between white and black applicants. For example, black individuals are 11.6% (8.5%) more likely to apply for FHA loans than white applicants with the same income and sex and in the same census tract.
12
To answer the question of whether blacks are more likely to apply for FHA loans because of higher default risk or because of requiring smaller loan amounts, a similar model is estimated for a sample of applicants with loan amounts less than the FHA mortgage loan limit. In the estimation, it is assumed that the loan amount is exogenous. In addition to demographic characteristics, loan amount with splines and loan-amount-to-income ratio as a proxy for default risk are included in the model. Results are found to be similar. It is found that blacks are 9.8% (12.6%) more likely to apply for an FHA-insured loan than their white counterparts; as the loan-to-income ratio increases, the probability of applying for an FHA loan increases; the black and white differences are found to be greater at higher income levels. For example, in 1991, a black applicant with a $20,000 income or a $120,000 income is 13.3 or 18.5% more likely respectively, to apply for an FHA loan than a white applicant with the same character-istics.
TABLE III
Linear Probability Model of FHA Application (1) or Conventional Application (0) for a Sample of Low and Moderate Income Applicants
(Model: P(FHA)in5o
N
n51bnDni1 INDIVIDUALinaI1 e*in)
1990 1991
Parameter Parameter
estimate t-value estimate t-value
Race of applicant, co-applicant (base group: white)
Native American applicant 20.0225 21.26 20.0488 22.63
Asian applicant 0.0093 1.06 20.0050 20.54
Black applicant 0.1261 23.50 0.1228 22.12
Hispanic applicant 0.0801 13.19 0.0937 15.37
Other race applicant 0.0273 1.54 20.0203 21.12
White applicant, minority co-applicant 0.1559 9.90 0.0611 3.78
Minority applicant white co-applicant 0.0850 4.81 0.0972 5.61
Sex of applicant and co-applicant (base group: female applicant)
Male applicant, female co-applicant 0.0758 5.05 0.0222 1.31
Female applicant, male co-applicant 0.0088 0.58 20.0263 21.54
Male applicant, co-applicant 0.0845 5.45 0.0369 2.11
Female applicant, co-applicant 0.0674 4.36 0.0192 1.11
Male applicant 0.0100 6.91 0.0075 5.33
Income race interaction variables
White 0.0169 20.29 0.0155 15.75 Native American 0.0169 16.83 0.0166 14.57 Asian 0.0157 18.12 0.0146 14.41 Black 0.0167 19.70 0.0158 15.88 Hispanic 0.0163 19.15 0.0151 15.13 Other race 0.0158 16.19 0.0154 13.85
White applicant, minority co-applicant 0.0147 15.54 0.0150 13.89
Minority applicant, white co-applicant 0.0168 17.21 0.0149 13.50
Income splines ($1,000) Income spline at $15,000 20.0092 26.31 20.0074 24.59 Income spline at $20,000 20.0004 20.26 20.0008 20.57 Income spline at $25,000 0.0009 0.78 20.0008 20.67 Income spline at $30,000 20.0111 210.87 20.0075 27.18 Income spline at $35,000 0.0043 4.18 0.0030 2.88 Income spline at $40,000 20.0034 22.95 20.0048 24.17 Income spline at $45,000 20.0038 24.34 20.0024 22.73
Income and no co-applicant interaction variables Income 0.0050 4.39 0.0009 0.74 Income spline at $15,000 0.0008 0.39 0.0043 2.05 Income spline at $20,000 20.0091 24.72 20.0056 22.87 Income spline at $25,000 20.0012 20.69 20.0043 22.57 Income spline at $30,000 0.0025 1.54 0.0033 2.06 Income spline at $35,000 20.0016 20.90 20.0050 22.89 Income spline at $40,000 0.0014 0.69 0.0062 3.13 Income spline at $45,000 0.0028 1.79 0.0004 0.29
HMDA EVIDENCE ON FHA MORTGAGE ACTIVITY 357
TABLE III—Continued
1990 1991
Parameter Parameter
estimate t-value estimate t-value
Memo items
Number of observations 783,789 788,799
Number of census tracts 38,008 37,766
R-squared 0.3455 0.3167
Mean of the dependent variable 0.3380 0.3224
When the hypothesis that the effect of income is the same for all racial groups is tested, it is found that racial groups are not significantly different. The results show that the differences between whites and blacks in terms of applying for an FHA loan do not change significantly as income level changes. For example, at income level $15,000, blacks are 12.31% (12.31%) percent more likely than whites to apply for FHA loans. This difference is 13.78% (11.61%) percent at the $50,000 income level.
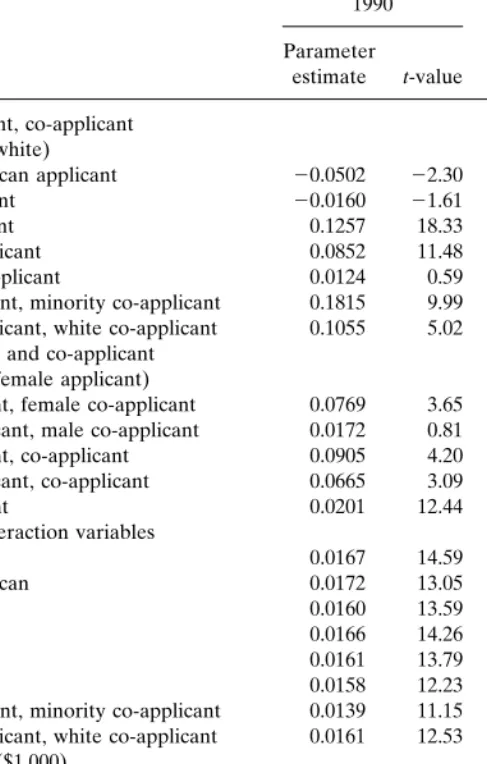
Mortgage Originations. A similar model is estimated for mortgage origi-nations to examine whether individual factors affect mortgage origiorigi-nations and mortgage applications differently. The results are found to be similar to those for the mortgage applications (Table IV).
Racial differences are also found with respect to mortgage originations. Blacks are 12.57% (12.21%) more likely to get an FHA loan than whites, and Hispanics are 8.52% (10.00%) percent more likely to get an FHA loan than whites. The difference is the probability of FHA origination between blacks and whites is slightly lower than the difference with FHA applica-tions. The smaller difference between whites and blacks in terms of FHA mortgage originations suggests that whites’ relative denial rate for conven-tional loans is higher than blacks’ relative denial rate. According to the HMDA datasets, blacks are 1.96 (2.35) times more likely than whites to be denied conventional loans. The relative denial rate for FHA loans is higher: blacks are 2.26 times more likely than whites to be denied.13Another
possibility is that whites may be applying for higher loan amounts than other racial groups, leading to higher relative denial rates in conventional loans since loan amount is not included in this model.14
The effect of income level on mortgage originations is similar to that on
13According to the 1990 (1991) HMDA datasets, the black denial rates for conventional
and FHA loans are 37.39% (31.5%) and 29.16% (28.10%), respectively. The white denial rate is 19.03% (13.40%) for conventional loans and 12.86% (11.90%) for FHA loans.
14It is found that controlling for the loan amount and a proxy for default risk, blacks are
TABLE IV
Linear Probability Model of FHA Origination (1) or Conventional Origination (0) for Borrowers with Income Less Than $50,000
(Model: P(FHA)in5o
N
n51bnDni1 INDIVIDUALinaI1 e*in)
1990 1991
Parameter Parameter
estimate t-value estimate t-value
Race of applicant, co-applicant (base group: white)
Native American applicant 20.0502 22.30 20.0560 22.45
Asian applicant 20.0160 21.61 20.0365 23.45
Black applicant 0.1257 18.33 0.1221 17.14
Hispanic applicant 0.0852 11.48 0.1000 13.25
Other race applicant 0.0124 0.59 20.0220 21.01
White applicant, minority co-applicant 0.1815 9.99 0.0504 2.66
Minority applicant, white co-applicant 0.1055 5.02 0.0939 4.45
Sex of applicant and co-applicant (base group: female applicant)
Male applicant, female co-applicant 0.0769 3.65 0.0291 1.22
Female applicant, male co-applicant 0.0172 0.81 20.0118 20.49
Male applicant, co-applicant 0.0905 4.20 0.0575 2.35
Female applicant, co-applicant 0.0665 3.09 0.0284 1.17
Male applicant 0.0201 12.44 0.0169 10.51
Income race interaction variables
White 0.0167 14.59 0.0149 11.08 Native American 0.0172 13.05 0.0161 10.66 Asian 0.0160 13.59 0.0146 10.62 Black 0.0166 14.26 0.0154 11.30 Hispanic 0.0161 13.79 0.0145 10.64 Other race 0.0158 12.23 0.0148 10.01
White applicant, minority co-applicant 0.0139 11.15 0.0146 10.15
Minority applicant, white co-applicant 0.0161 12.53 0.0145 9.84
Income splines ($1,000) Income spline at $15,000 20.0079 24.16 20.0050 22.37 Income spline at $20,000 20.0019 21.11 20.0041 22.28 Income spline at $25,000 0.0002 0.15 0.0004 0.30 Income spline at $30,000 20.0100 28.80 20.0078 26.53 Income spline at $35,000 0.0042 3.75 0.0030 2.55 Income spline at $40,000 20.0037 22.95 20.0047 23.68 Income spline at $45,000 20.0040 24.21 20.0025 22.60
Income and no co-applicant interaction variables Income 0.0057 3.64 0.0020 1.14 Income spline at $15,000 20.0028 21.07 0.0008 0.28 Income spline at $20,000 20.0065 22.86 20.0032 21.36 Income spline at $25,000 20.0009 20.48 20.0049 22.49 Income spline at $30,000 0.0024 1.38 0.0038 2.11 Income spline at $35,000 20.0021 21.11 20.0044 22.35 Income spline at $40,000 0.0024 1.12 0.0056 2.60 Income spline at $45,000 0.0023 1.34 0.0006 0.34
HMDA EVIDENCE ON FHA MORTGAGE ACTIVITY 359
TABLE IV—Continued
1990 1991
Parameter Parameter
estimate t-value estimate t-value
Memo items
Number of observations 634,586 631,622
Number of census tracts 37,138 36,871
R-squared 0.3622 0.3295
Mean of the dependent variable 0.3517 0.3393
mortgage applications. At income levels below $30,000, income and the probability of FHA origination are positively correlated; at income levels above $30,000, they are negatively correlated. At income level of $15,000, blacks’ probability of getting an FHA loan is 12.42% (12.96%) higher than that of whites. This is 12.07% (14.71%) at the income level of $50,000. The difference between whites and other racial groups at different income levels in terms of the expected probability of getting an FHA loan is similar to the differences in the expected probability of FHA applications. However, results do not explain why the results differ in two years. It may be because of policy changes or changes in the characteristics of white applicants.
The next section examines how neighborhood characteristics affect the individuals’ probabilities of applying for and getting an FHA loan, control-ling for individual characteristics.
Neighborhood Characteristics
Mortgage Applications.15 The estimations for FHA applications are
pre-sented in Table V. The regression results show that the correlation between the probability of applying for an FHA loan and minority percentage in census tract is positive in less and highly minority-populated census tracts, but it is negative in moderately minority-populated census tracts. In addi-tion, the probability of applying for an FHA loan is found to be positively correlated with the change in minority share over the last decade.
Results with respect to housing characteristics are similar to expectations.
15Three different dependent variables are used in the analysis of the effect of neighborhood
characteristics on mortgage applications and originations: the 1990/1991 average of fixed census tract effects, the fixed census tract effects obtained from the 1990 estimates, and the fixed census tract effects obtained from the 1991 estimates. The results are similar for the years 1990 and 1991 and the averages of 1990 and 1991 figures weighted by the number of applications in each year. Only the results with the 1990–1991 averages are presented. The other estimations are available from the author upon request.
TABLE V Second Stage Estimation for 1990 – 1991 (Model I: b ˆ5n d 1 NEIGHBORHOOD n dN 1 en ; Model II: b ˆ5n o M m5 1 dm Dm 1 NEIGHBORHOOD n dN 1 en ) Mortgage applications Mortgage originations Model I Model II Model I Model II Parameter Parameter Parameter Parameter estimate t-value estimate t-value estimate t-value estimate t-value Intercept 1.2275 9.41 1.6046 11.08 Demographic variables Minority population share, 1990 Minority share 3.2101 26.26 1.5523 17.00 3.3788 26.65 1.6019 16.87 Spline at 5 % 2 2.9583 2 15.68 2 0.9589 2 7.08 2 3.1016 2 15.85 2 1.0046 2 7.14 Spline at 10 % 2 0.1813 2 1.65 2 0.4975 2 6.47 2 0.1758 2 1.53 2 0.4752 2 5.92 Spline at 25 % 2 0.3126 2 6.02 2 0.2037 2 5.66 2 0.3578 2 6.44 2 0.2338 2 6.08 Spline at 50 % 0.4452 11.63 0.3168 11.87 0.4512 10.76 0.3031 10.36 Change in minority share, 1980 – 1990 (Dummy variables, base group: less than 0) Change in share 0 – 5 % 0.0031 0.94 0.0235 10.09 0.0010 0.29 0.0239 9.65 Change in share 5 – 10 % 0.0060 1.40 0.0408 13.48 0.0048 1.05 0.0411 12.72 Change in share 10 – 15 % 0.0068 1.30 0.0495 13.35 0.0042 0.75 0.0473 11.89 Change in share more than 15 % 0.0425 7.66 0.0796 20.07 0.0395 6.57 0.0765 17.81 Age of household head, 1990 Share of household heads aged 25 – 34 0.0908 0.64 0.3438 3.43 2 0.2710 2 1.73 0.0900 0.81 Share of household heads aged 35 – 44 2 0.4063 2 3.22 2 0.2692 2 3.01 2 0.8541 2 6.11 2 0.6082 2 6.12 Share of household heads aged 45 – 54 2 0.6517 2 4.73 2 0.3801 2 3.91 2 1.0086 2 6.61 2 0.6491 2 6.02 Share of household heads aged 55 – 64 2 0.6844 2 5.06 2 0.2268 2 2.38 2 1.0859 2 7.27 2 0.4810 2 4.55 Share of household heads aged 65 – 74 2 1.2819 2 9.68 2 0.5025 2 5.33 2 1.7297 2 11.82 2 0.8470 2 8.12 Share of household heads aged 75 – 2 0.8957 2 6.85 2 0.4387 2 4.74 2 1.3115 2 9.06 2 0.7472 2 7.28 Average household size (owner-occupied) 2 0.1706 2 37.88 2 0.0778 2 21.26 2 0.1701 2 35.40 2 0.0735 2 18.73
HMDA EVIDENCE ON FHA MORTGAGE ACTIVITY 361 Economic variables Median family income, 1990 Median family income 2 0.0037 2 2.62 0.0049 4.97 2 0.0025 2 1.48 0.0049 4.18 Spline at $20,000 2 0.0075 2 5.14 2 0.0087 2 8.68 2 0.0095 2 5.55 2 0.0098 2 8.23 Spline at $40,000 0.0000 0.05 2 0.0031 2 10.96 0.0008 1.80 2 0.0024 2 7.77 Spline at $60,000 0.0104 15.16 0.0070 14.73 0.0104 14.87 0.0071 14.79 Spline at $80,000 0.0023 1.39 0.0006 0.54 0.0026 1.49 0.0007 0.56 Spline at $100,000 0.0009 0.36 0.0014 0.80 0.0008 0.30 0.0013 0.74 Change in median family income, 1980 – 1990 (Dummy variables, base group: less than 0) Change in income 0 – 25 % 2 0.0044 2 0.22 2 0.0190 2 1.39 2 0.0066 2 0.28 2 0.0152 2 0.94 Change in income 25 – 50 % 0.0165 0.84 2 0.0241 2 1.79 0.0189 0.82 2 0.0138 2 0.88 Change in income 50 – 100 % 2 0.0187 2 0.95 2 0.0444 2 3.26 2 0.0175 2 0.75 2 0.0353 2 2.21 Change in income 100 % – 2 0.0510 2 2.55 2 0.0343 2 2.47 2 0.0487 2 2.08 2 0.0261 2 1.61 Housing market characteristics Housing units by units in structure, 1990 Share of 1-unit attached 2 0.0399 2 4.14 2 0.0147 2 1.76 2 0.0352 2 3.52 2 0.0211 2 2.43 Share of 2 units 0.0719 3.31 0.1930 11.32 0.0307 1.33 0.1791 9.87 Share of 3 – 4 units 2 0.0484 2 1.81 2 0.0897 2 4.60 2 0.0611 2 2.13 2 0.1050 2 4.99 Share of 5 – units 2 0.2573 2 30.84 2 0.1442 2 21.86 2 0.2630 2 29.79 2 0.1467 2 21.03 Share of mobile homes 2 0.8249 2 59.73 2 0.5618 2 56.02 2 0.8379 2 55.42 2 0.5807 2 52.96 House usage variables, 1990 Rental rate (1 – 4 units) 2 0.4778 2 29.51 2 0.2065 2 15.91 2 0.4530 2 26.02 2 0.1898 2 13.57 Change in rental rate (1 – 4 units) 0.3853 18.69 0.2770 19.14 0.4037 18.16 0.2920 18.70 Vacancy rate (1 – 4 units) 2 0.1829 2 6.62 2 0.3040 2 15.03 2 0.1783 2 6.00 2 0.3184 2 14.60 Change in vacancy rate (1 – 4 units) 0.3335 10.66 0.1878 8.42 0.3184 9.50 0.1974 8.25 Growth in housing units 2 0.0015 2 1.69 2 0.0039 2 6.47 2 0.0023 2 2.56 2 0.0047 2 7.50 Growth in 1 – 4 units 2 0.0001 2 1.41 0.0000 0.34 2 0.0001 2 1.23 0.0000 0.46 (continued )
TABLE V — Continued Mortgage applications Mortgage originations Model I Model II Model I Model II Parameter Parameter Parameter Parameter estimate t-value estimate t-value estimate t-value estimate t-value Age of housing stock, 1990 Share of units built in 1979 – 1980 0.2314 10.87 0.0325 2.09 0.2262 10.16 0.0299 1.83 Share of units built in 1975 – 1978 0.1375 9.78 0.0111 1.06 0.1402 9.58 0.0108 1.00 Share of units built in 1970 – 1974 0.2242 18.54 0.0773 8.52 0.2229 17.59 0.0821 8.66 Share of units built in 1960 – 1969 0.1489 14.17 0.0429 5.54 0.1550 14.03 0.0456 5.61 Share of units built in 1950 – 1959 0.1682 15.32 0.0927 11.68 0.1775 15.37 0.0996 11.95 Share of units built in 1940 – 1949 0.2021 11.66 0.1134 9.20 0.2111 11.56 0.1264 9.74 Central city dummy 0.0620 26.22 0.0344 18.45 0.0582 23.42 0.0315 16.04 Memo items Number of observations 36,641 36,641 35,464 35,464 Number of MSA dummy variables — 333 — 333 R -squared 0.3893 0.7224 0.3881 0.7217
HMDA EVIDENCE ON FHA MORTGAGE ACTIVITY 363
It is found that vacancy and rental rates on one-to-four housing units and growth in housing units are negatively related, and the change in rental rate and vacancy rate from 1980 to 1990 are positively related to the proba-bility of FHA applications.
It can be argued that FHA loans are preferred by young households because most of them are liquidity-constrained (Duca and Rosenthal, 1994). Results support this argument. Although the individual’s age is not included in the model directly, it is found that if the percentage of households with older head of household is higher in the census tract the probability of applying for an FHA loan is lower. The results show a negative relationship between average household size in the census tract and the probability of applying for an FHA loan. As expected, the probability of applying for an FHA loan is found to be higher in central cities than in suburbs, controlling for individual characteristics and economic, demographic, and housing mar-ket characteristics of census tracts.
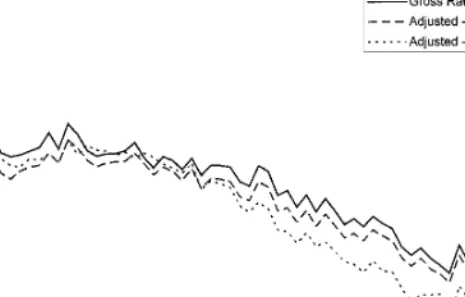
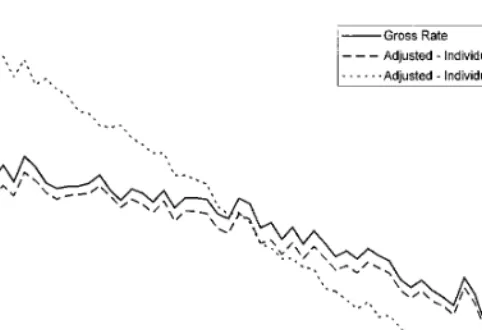
It is very difficult to interpret these results because several variables are included in the model at the census tract level. Therefore, the results are also presented in graphical form. Two census tract characteristics are selected for the analysis because most of the recent policy changes are based on these variables. They are minority share and median family income in the census tract. Three different relative FHA application rates are shown in the graphs:
(1) Gross FHA rates,
(2) Adjusted FHA rates, controlling for individual factors,
(3) Adjusted FHA rates, controlling for individual and neighbor-hood factors.16
16The gross FHA rates are the observed FHA rates as shown in Table II. The adjusted
FHA rates are calculated by deducting the estimated FHA rates from the gross FHA rates. They are normalized to have the same mean as the gross FHA rates. The adjusted FHA rates, controlling for individual factors, correspond to the residuals from the linear probability model. The individual and neighborhood adjusted FHA rates are calculated by including all variables except the variable against which the graph is drawn. For example, minority shares, their splines, and the change in minority share between 1980 and 1990 are not included in exploring the effect of minority percentage in the neighborhood. These residuals can be interpreted as deviations from the predicted FHA activity in a census tract with all white and with zero or negative change in minority share from 1980 to 1990. Similarly, median family income, its splines, and the dummy variables for the changes in median family income are not included in investigating the effects of median family income. The estimated residuals can be interpreted as deviations of the FHA application rate from a hypothetical neighborhood with an average tract income. Census tracts are ranked on the basis of the variable under investigation and are weighted based on the total loan applications. In order to make the comparisons easier, the probability of applying for an FHA loan is assumed to be zero in tracts with 0 or 1% minority share, or tracts with an $80,000 or higher median family income. Each point in the graphs represents the weighted average of FHA activity in the corresponding census tracts. For example, if there are 100 tracts with 100% minority population, the weighted mean of the FHA activity of these tracts is taken in order to get a corresponding figure for all-minority census tracts.
FIG. 1. FHA application rates versus minority share in census tract (Model II).
The next two subsections examine the effect of two neighborhood character-istics on relative FHA application rates.
The Effect of Racial Composition in Census Tract. Figure 1 shows that other than the initial increase from an all-white to a 10-percent minority share, the relative FHA application rates fluctuate randomly over different minority shares in the census tract.17The data indicate that minority share
affects FHA applications when the shift is from an all-white to any mixed census tract within the same MSA (Model II). However, it does not show any systematic effect on FHA application rates in any mixed or minority census tracts. Although individual factors explain some of the variation in moderately and highly minority populated census tracts, other neighbor-hood factors do not explain much of the variation in neighborneighbor-hoods. The sharp increase from an all-white to a 10% minority census tract may be explained by the low supply of FHA loans. Unavailability of FHA loans may lead to a very small FHA applications rate in these census tracts.
17The figure does not change much when all neighborhoods are compared without
control-ling for the MSA (Model I). Except the initial increase in the FHA application rate from all white to any minority neighborhoods, the fluctuations on the relative FHA application rates are observed in all neighborhoods. The difference is observed only in highly minority-populated census tracts. Even though individual factors explain some of the variation in the more than 90% minority-populated neighborhoods, when other neighborhood factors are controlled in addition to the individual factors, the relative FHA application rates are expected to be higher than the observed.
HMDA EVIDENCE ON FHA MORTGAGE ACTIVITY 365
FIG. 2. FHA application rates versus median family income in census tract (Model II).
Another explanation may be that in those census tracts, the house values are high, and because of the FHA loan limit, individuals may not be eligible for FHA loans. A similar relationship is observed when all census tracts are examined without controlling for the MSA (Model I).
Effect of Median Family Income in Census Tract. The regression results show that median family income and the probability of applying for an FHA loan are negatively correlated when the income level is above $60,000 (Model II). Figure 2 shows a negative relationship between FHA activity and median income. According to this figure, individual factors explain very small variation in census tracts with low and moderate income levels. However, in high income census tracts, individual factors do not explain anything but census tract factors with the exception of income level related factors explaining most of the variation in FHA application rates.
When all census tracts are compared without controlling for the MSA, it is found that although the gross difference between $10,000 and $80,000 income census tracts is around 21.7%, it increases to almost 54.8% controlling for individual and neighborhood factors (Model I). Figure 3 supports the argu-ment that median family income in census tract is an important factor in ex-plaining differences among census tracts. When an individual’s income and race, and demographic and housing characteristics in census tract are taken into consideration, low and middle income households are expected to get more FHA loans in lower-income census tracts than the actual levels. The observed and predicted differences suggest that the FHA is expected to serve
FIG. 3. FHA application rates versus median family income in census tract (Model I).
more to low-income census tracts (a median income less than $30,000) given an individual’s income, race, and other census tract factors. Instead, in reality, it serves more than predicted in high-income census tracts.
The observed low relative FHA rate in the low-income census tracts may be because of the definition of conventional loans. In low-income census tracts, borrowers may be using a state-supported or special mortgage pro-gram available for low and middle income households. However, loans issued with these programs are treated as conventional loans in this study since the HMDA dataset does not differentiate these loans from conven-tional loans.
FHA Originations
The estimates for FHA originations using 1990/91 averages as dependent variables are presented in Table V. The effects of the neighborhood charac-teristics on the relative FHA originations are found to be similar to their effects on applications. The signs of almost all coefficients in mortgage origination model are the same as those in the mortgage application model. The graphs also indicate that the impact of minority percentage and that of median family income in census tract on the relative FHA origination rates are similar to their impacts on the relative FHA application rates. For example, other than the initial increase in the FHA origination rates in an all-white to any mixed census tract, the relative FHA origination rates do not show any systematic relationship with respect to the minority percentage in the census tract. Similar to mortgage applications, the FHA
HMDA EVIDENCE ON FHA MORTGAGE ACTIVITY 367
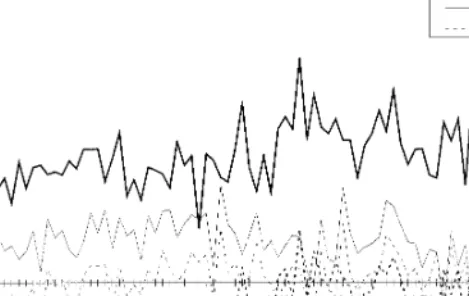
FIG. 4. Differences in gross and adjusted FHA application rates by race versus minority percentage in census tract.
origination rates are found to decrease with increases in median family income.18
Racial Differences
The neighborhood characteristics may affect each racial group’s mortgage behavior in a different way. In this section, the interaction between individu-al’s race and the racial composition and median family income in a neighbor-hood are examined.19 Three racial groups are compared: whites, blacks,
and Hispanics.
Minority Percentage in Census Tract. Figure 4 shows the differences in gross and adjusted FHA application rates between whites and other racial groups in census tracts with different minority shares. Although the gross relative FHA application rate for black individuals is higher than that for white individuals, when individual and neighborhood characteristics are controlled, it is found that blacks are expected to have lower relative FHA application rates than whites in white-populated and highly
minority-18The graphs are similar to graphs of mortgage applications. In order to continue the
discussion without any interruption from graphs, they are not presented. They are available from the author upon request.
19All the remaining graphs are based on the estimations using Model II. The results with
Model I are similar to the graphs presented in the paper. They are available from the author upon request.
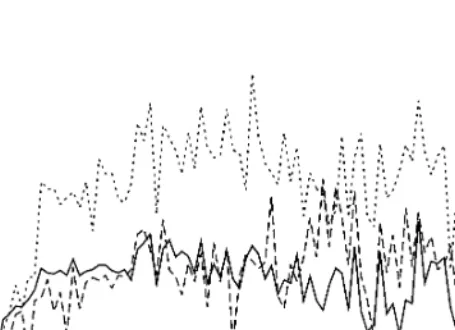
FIG. 5. FHA application rates by race controlling for individual factors versus minority percentage in census tract.
populated census tracts and the difference disappears in moderately minor-ity-populated census tracts. The difference between Hispanics and white applicants does not decline much when individual and other neighborhood factors are controlled for.
When only individual factors are included in the model,20white and black
FHA application rates show similarities (Fig. 5). White and black mortgage applicants with the same income level have a similar probability of applying for an FHA loan in both low and moderately minority-populated census tracts. However, in very highly minority-populated census tracts, whites are expected to apply for FHA loans more often than their black counter-parts. On the other hand, Hispanic borrowers with the same level of income have a higher probability of applying for an FHA loan than their white and black counterparts, controlling for their income and sex.
Median Family Income. Both the gross and adjusted differences be-tween blacks and whites and bebe-tween Hispanics and whites first increase and then fluctuate as the median income in the census tract increases (Fig. 6). However, this difference almost disappears at the higher income census tracts when individual and other neighborhood factors are controlled for.
20In this graph, the relative FHA rates, controlling for individual factors, are normalized
HMDA EVIDENCE ON FHA MORTGAGE ACTIVITY 369
FIG. 6. Differences in gross and adjusted FHA application rates by race versus median family income in census tract.
Hence, the difference between racial groups in FHA application rates can be explained by income and sex of applicant and neighborhood characteristics. Interestingly, in the low income census tracts, controlling for individual and neighborhood factors, whites are expected to have higher relative FHA application rates than their black counterparts. This is also observed when Hispanic applicants are compared with white applicants. When only individ-ual factors are controlled for, whites’ relative FHA application rates decline with the median family income (Fig. 7), but blacks’ and Hispanics’ relative FHA application rates show a quadratic relationship with median family income.
Although the gross and adjusted differences are found to be showing similar patterns with respect to mortgage originations, the trend in FHA originations is slightly different from FHA applications when only individ-ual factors are controlled for. For example, blacks are more likely to get FHA loans than whites in all census tracts regardless of minority share.
Central Cities and Suburbs
Central city and suburban tracts are examined separately in order to see the interaction effects of neighborhood characteristics on relative FHA rates. In central cities, FHA rates are significantly higher than in suburban census tracts, and central cities are considered to have more minority popu-lation and low income households.
FIG. 7. FHA application rates by race controlling for individual factors versus median family income in census tract.
When the variation in all census tracts within the same MSA is examined, it is found that the difference between central city and suburban tracts in terms of FHA application rates lowers slightly after controlling for individ-ual and neighborhood factors in almost all census tracts regardless of the minority share (Fig. 8). Even though individual and other neighborhood factors explain some of the variation of FHA rates in central cities, they do not explain much in the suburbs. However, there is more fluctuation in relative FHA application rates in the suburbs than in central cities when minority share is more than 50%. Similar to the other results, other than the initial effect, the minority percentage does not seem to affect the central city and suburban relative FHA mortgage activity systematically. These results suggest that the major difference between central cities and suburban areas can be explained by factors other than minority share in the area such as median income level. The initial difference can be explained by the unavailability of FHA loans in the almost all-white census tracts both in central cities and suburbs.
Figure 9 supports the previous argument that median income level in the area can explain the differences between central cities and suburban areas. The gap between central city and suburban tracts in terms of the gross FHA activity declines in a similar way as median income in the census tract increases. The differences between central cities and suburban areas
HMDA EVIDENCE ON FHA MORTGAGE ACTIVITY 371
FIG. 8. FHA application rates by location versus minority percentage in census tract.
disappear when individual factors and other neighborhood characteristics are controlled within the same MSA. Similar to the other results, a negative relationship is observed between FHA application rates and median family income in the suburbs and central cities.
CONCLUSION AND POLICY IMPLICATIONS
This study investigates the effect of individual and neighborhood charac-teristics on FHA application and origination rates of low- and moderate-income households defined as those that have moderate-income less than or equal to 120% of the MSA median family income. The major findings of this study are: (1) Racial composition in a neighborhood has relatively little effect on relative FHA activity when minority share in the census tract is more than 10%. (2) As median family income increases, the relative FHA activity declines. However, high relative FHA activity in low-income neigh-borhoods can be explained by neither individual nor neighborhood charac-teristics. (3) The effect of neighborhood characteristics on minority FHA applications is similar to their effect on white applications. The difference between whites and blacks in FHA activity disappears in moderate and high income and in more than 50% minority-populated census tracts. Inter-estingly, whites are expected to have higher FHA activity in less than 50% minority-populated and low income census tracts. (4) Central city and suburban FHA activity are affected in a similar way by minority percent-age and median family income. The difference in FHA activity between suburban areas and central cities can be explained by the differences in median family income. (5) The individual and neighborhood characteris-tics affect relative FHA application and origination rates in the same way.
The evidence from the 1990 and 1991 HMDA datasets indicates that minority population in neighborhood does not have a systematic relation-ship with FHA activity except the movement from all-white-populated to any-minority-populated census tracts, and the FHA does play an important role in low-income census tracts which cannot be explained by individual characteristics. The finding of previous studies that blacks were more likely to get FHA loans can be explained by the higher application rate by blacks for FHA loans than by whites.
These results have several policy implications. They suggest that if the FHA’s mortgage insurance programs cease, those living in low-income census tracts will be most affected. The results of this study suggest that if policies are made based on minority population among the census tract characteristics, it will not be very effective. Policies should be based on median family income in neighborhoods or census tracts.
The results should be interpreted with caution. First, several individual variables, such as wealth, credit history, debt burdens, and default risk, are not included in the model because of unavailability. They are all important in the individual’s application for conventional or FHA loans. The inclusion of these factors into the model would reduce the racial difference as re-ported by Munnell et al. (1996) who found that even though the role of
HMDA EVIDENCE ON FHA MORTGAGE ACTIVITY 373
race diminishes with the inclusion of these variables, race was still a signifi-cant factor in the decision to grant a mortgage. The difference in the FHA application rates in the low-minority-populated and low-income census tracts might disappear when the omitted wealth and risk variables are included. Second, FHA activity is underrepresented due to the unavailabil-ity of data from small mortgage bankers. However, in general, these mort-gage bankers operate in the high-minority and low-income census tracts. Since these results are obtained by excluding them, the relationship is expected to be stronger when they are included in the analysis. Low FHA activity in the very low-income census tracts might be explained by the underrepresentation of FHA activity in these census tracts because of the exclusion of small mortgage bankers’ activity. Third, this study uses only the 1990 and 1991 HMDA data. Therefore, the recent changes on the FHA’s mortgage insurance requirements and the effect of the Housing and Community Development Act of 1992 are not observed.
APPENDIX TABLE A
Mean of Neighborhood Characteristics
1990–1991 averages
Neighborhood characteristics Application Origination
Median house value, 1990 $93,681 $94,463
Percentage change in value, 1980–1990 0.7224 0.7121
Change in value dummy variables
0.00–0.25 0.1429 0.1458
0.25–0.50 0.2875 0.2928
0.50–1.00 0.3386 0.3343
1.00–1.50 0.1147 0.1133
1.50– 0.0948 0.0925
Median family income, 1990 $38,680 $39,369
Percentage change in income, 1980–1990 0.7618 0.7670
Change in income dummy variables
0.00–0.25 0.0208 0.0184 0.25–0.50 0.1279 0.1206 0.50–1.00 0.6716 0.6805 1.00–1.50 0.1701 0.1716 Central city 0.4353 0.4286 Black share, 1990 0.0940 0.0854
Change in black share, 1980–1990 0.0194 0.0183
Change in black share dummy variables
0.00–0.05 0.6386 0.6515
0.05–0.10 0.0689 0.0663
0.10–0.15 0.0267 0.0247
TABLE A—Continued
1990–1991 averages
Neighborhood characteristics Application Origination
Nonblack minority share, 1990 0.1025 0.0975
Change in nonblack minority share, 1980–1990 0.0305 0.0294
Change in nonblack minority share dummy variables
0.00–0.05 0.6652 0.6802
0.05–0.10 0.0975 0.0947
0.10–0.15 0.0444 0.0417
0.15– 0.0426 0.0393
Housing variables
Share of 1 unit attached 0.0603 0.0614
Share of 2 units 0.0427 0.0421
Share of 3–4 units 0.0426 0.0418
Share of 5 or more units 0.1530 0.1529
Share of mobile homes 0.0686 0.0643
Rental rate, 1990 0.2906 0.2863
Change in rental rate, 1980–1990 0.0247 0.0250
Rental rate (1–4 units), 1990 0.2112 0.2056
Change in rental rate (1–4 units) 0.0150 0.0146
Total 1–4 units, 1990 2622 2645
Growth in total housing units, 1980–1990 0.4890 0.5025
Growth in 1–4 housing units, 1980–1990 0.6901 0.7312
Vacancy rate, 1990 0.0722 0.0700
Vacancy rate, 1–4 units, 1990 0.0585 0.0565
Change in vacancy rate, 1980–1990 0.0071 0.0061
Change in vacancy rate, 1–4 units 0.0034 0.0025
Share of housing units built in 1981–1990 0.1758 0.1737
Share of housing units built in 1979–1980 0.0599 0.0609
Share of housing units built in 1975–1978 0.1391 0.1413
Share of housing units built in 1970–1974 0.1603 0.1606
Share of housing units built in 1960–1969 0.2083 0.2084
Share of housing units built in 1950–1959 0.1657 0.1656
Share of housing units built in 1940–1949 0.0906 0.0891
Share of household heads aged 25–34 0.1741 0.1753
Share of household heads aged 35–44 0.2435 0.2454
Share of household heads aged 45–54 0.1812 0.1815
Share of household heads aged 55–64 0.1576 0.1567
Share of household heads aged 65–74 0.1402 0.1391
Share of household heads aged 75– 0.0879 0.0868
Average household size (owner-occupied) 2.7738 2.7712
Number of census tracts 36,641 35,464
REFERENCES
Avery, R. B., Beeson, P. E., and Sniderman, M. S. (1994). ‘‘Underserved Mortgage Markets: Evidence from HMDA Data,’’ presented at the 1994 Western Economic Association Meet-ings, Vancouver, BC.