Nanotechnology 23 (2012) 405703 (7pp) doi:10.1088/0957-4484/23/40/405703
Exploring atomic-scale lateral forces in
the attractive regime: a case study on
graphite (0001)
Mehmet Z Baykara
1,2, Todd C Schwendemann
1,3, Boris J Albers
1,
Nicolas Pilet
1,5, Harry M¨onig
1,6, Eric I Altman
4and Udo D Schwarz
1,41Department of Mechanical Engineering and Materials Science and Center for Research on Interface
Structures and Phenomena (CRISP), Yale University, PO Box 208284, New Haven, CT 06520, USA
2Department of Mechanical Engineering, Bilkent University, 06800 Bilkent, Ankara, Turkey 3Physics Department, Southern Connecticut State University, 501 Crescent Street, New Haven,
CT 06515, USA
4Department of Chemical and Environmental Engineering and Center for Research on Interface
Structures and Phenomena (CRISP), Yale University, PO Box 208286, New Haven, CT 06520, USA E-mail:[email protected]@yale.edu
Received 2 July 2012, in final form 17 August 2012 Published 20 September 2012
Online atstacks.iop.org/Nano/23/405703 Abstract
A non-contact atomic force microscopy-based method has been used to map the static lateral forces exerted on an atomically sharp Pt/Ir probe tip by a graphite surface. With measurements carried out at low temperatures and in the attractive regime, where the atomic sharpness of the tip can be maintained over extended time periods, the method allows the quantification and directional analysis of lateral forces with piconewton and picometer resolution as a function of both the in-plane tip position and the vertical tip–sample distance, without limitations due to a finite contact area or to stick-slip-related sudden jumps of tip apex atoms. After reviewing the measurement principle, the data obtained in this case study are utilized to illustrate the unique insight that the method offers. In particular, the local lateral forces that are expected to determine frictional resistance in the attractive regime are found to depend linearly on the normal force for small tip–sample distances.
(Some figures may appear in colour only in the online journal)
1. Introduction
In the last two decades, the atomic origins of friction have been a topic of intense research, spurred by the emergence of micro- and nanoscale devices featuring sliding components with very small dimensions [1, 2]. In such devices, atomic friction and wear play an important role due to the increased percentage of surface atoms compared to those in the bulk and the breakdown of traditional lubrication schemes. The related scientific efforts have been aided by the invention of novel 5 Present Address: Swiss Light Source, Paul Scherrer Institute, 5232
Villigen-PSI, Switzerland.
6 Present Address: Physikalisches Institut at the Center for Nanotechnology
(CeNTech), Westf¨alische Wilhelms-Universit¨at, D-48149 M¨unster, Germany.
experimental tools such as the friction force microscope [3], which enables researchers to observe frictional phenomena at the nanoscale [4–6].
In traditional friction force microscopy (FFM) experi-ments, a nanoscale tip representing a single-asperity contact is moved over the sample surface and the local lateral forces experienced by the tip are recorded to deduce the frictional properties of the surface on the nanoscale (see, e.g. [7–10]). The motivation behind this approach is that understanding the frictional behavior of a single nanoscale asperity allows predictions to be made about friction in spatially larger systems. But even though the nanoasperity realized in an FFM experiment represents an excellent model system mimicking an asperity in an actual slider, it is important to
Nanotechnology 23 (2012) 405703 M Z Baykara et al
realize how the information that can be gathered from such experiments is limited. First, since the contact area of the tip with the substrate surface in traditional FFM experiments comprises many atoms (often dozens or even hundreds of atoms), atom-specific information is difficult to extract due to averaging of the tip–sample interaction over the whole contact area [11,12]. Next, lateral forces experienced by the tip during sliding cause the tip to get ‘trapped’ in local potential minima of the surface under most circumstances, which leads to a ‘stick-slip’ type of movement where the tip ‘jumps’ from one potential minimum to the next [7–9,13,14]. During the rapid slip events, the tip passes the majority of the effective surface potential faster than typical data point collection rates allow to track its path. As a consequence, no information is available on a large portion of the profiled surface potential [9, 15]. Finally, it has been shown that atoms at the tip apex possess a ‘sidewards flexibility’ large enough to avoid passage of the steepest slopes and highest peaks of the potential landscape when moving along a specific direction [9]. Instead, the apex atoms will follow the energetically most favorable path in the chosen general direction of sliding, which often looks like a zigzag path [15,16]. As a result, certain areas, such as the vicinity of potential maxima are not profiled at all.
In recent years, new approaches have been introduced that overcome some of these limitations, such as the appli-cation of very small normal forces during measurement [17], electromechanical actuation of the tip–sample contact [18], and recording the flexural contact resonance frequency [19]. Despite these advances, the recording of complete maps of lateral forces and surface potentials with true atomic resolution could not be achieved.
In this context, non-contact atomic force microscopy (NC-AFM) [20] emerges as an interesting alternative. NC-AFM relies on monitoring and recording the changes in the resonance frequency of a cantilever with an atomically sharp probe tip, which are caused by the tip apex interacting with surface atoms while it is being scanned near a sample’s surface. Due to the non-contact operation, the tip remains atomically sharp, and information on the entire tip–sample potential can be gathered. Applying measurement and analysis procedures that have been introduced with the recently developed method of three-dimensional atomic force microscopy (3D-AFM), which represents an extension of NC-AFM, these shifts in resonance frequency1f can be collected in a dense (x, y, z) array near the surface with picometer spatial positioning accuracy [21–24]. Subsequently, the complete data array can be converted into three-dimensional (3D) force and energy maps with piconewton/millielectronvolt resolution, respectively.
After a brief description of measurement procedures and experimental conditions, this paper illustrates the depth of friction-related information that can be obtained from such investigations. Towards this end, we are using a data set obtained on graphite, aspects of which have been previously published [21,22]. While these earlier papers covered general aspects of the data set [21] as well as methodological issues [22], this third part extends the discussion by focusing on the dependence of the lateral forces on normal forces,
lattice site, and distance from the surface. This information is of considerable interest due to graphite’s excellent properties as a solid lubricant, which make it a meaningful choice for this case study. As the most notable result, we find that the local lateral forces that are expected to determine frictional resistance in the attractive regime depend linearly on normal force for small tip–sample distances.
2. Measurement method and experimental details
The details of the home-built non-contact atomic force microscope used for data acquisition and the three-dimensional data collection scheme we are following have been described elsewhere [21–23, 25]. The corresponding step-by-step procedure is summarized in figure1. In essence, the cantilever-shaped prong of a tuning fork with spring constant k ≈ 2000 N m−1 that has an atomically sharp,
electrochemically etched Pt/Ir tip attached at its free end is oscillated perpendicular to the sample surface with an amplitude of A = 0.25 nm. The aforementioned deviation 1f [26] of the prong’s resonance frequency from its initial value of f0 =29 023 Hz (figure 1(a)) is then recorded at
6 K and under ultrahigh vacuum conditions in a dense grid (every 6.83 pm laterally and every 1 pm vertically, maximum frequency shift −28 Hz) and converted to reflect normal forces (figure1(b)) using the Sader–Jarvis method [27]. The 3D lateral force data are then obtained through a two-step process: normal force data are first integrated in the vertical direction to obtain a 3D potential energy map (figure 1(c)); lateral forces are subsequently recovered by calculating the in-plane derivatives of the potential.
This last step is illustrated in figures 1(d) and (e), where perspective representations of potential energy data obtained at a fixed height of z = 12 pm near a potential energy minimum are displayed as a function of x and y (throughout this paper, we arbitrarily calibrate all heights relative to the plane of closest approach for which we have continuous data). Thereby, the arrows in figure 1(e) represent the in-plane gradients of the energy field and thus the magnitude and direction of the static lateral forces acting on the tip apex at each raster grid point. As expected, lateral forces point towards the potential minimum. Two-dimensional (x, z) and (x, y) maps of lateral forces obtained from potentials by differentiation as well as torsional resonance frequency tracking have been presented before [28–32]. In addition, lateral force data based on an NC-AFM approach have been produced by oscillating the cantilever parallel to the surface and recording the frequency shift caused by lateral forces [12, 33]. The present 3D approach differs from most of these efforts as it enables the analysis of the strength and direction of lateral forces within a given horizontal plane with respect to lattice position as well as their distance dependence from the surface with picometer resolution.
An important point that must be considered when pursuing a rigorous analysis of any data is their accuracy. Even though the piezoelectric scanners commonly employed in low-temperature atomic force microscopy setups are ideally able to achieve the picometer-precise positioning accuracy
Figure 1. Figure illustrating the procedure used to recover the lateral forces acting on the tip apex in the non-contact regime. (a) A tip located at the end of a cantilever oscillating at resonance frequency is scanned near a graphite surface in an (x, y) grid while the difference 1f of the current resonance frequency compared to the eigenfrequency of the free cantilever is recorded for each data point. By variation of the tip–sample distance z, a complete data array (1f , x, y, z) is obtained. (b) From such data, the tip–sample forces Fzacting in the normal
direction can be recovered as a function of their spatial location (x, y, z) relative to the sample surface (array size:
1750 pm × 810 pm × 172 pm). (c) Integration in the z direction produces the corresponding (E, x, y, z) array, where E reflects the potential energy between tip and sample. (d) A 300 pm × 280 pm subset of this data array at a fixed height z = 12 pm is plotted in perspective, showing a potential energy well located at the center of the hexagonal unit cell of graphite (average energy: −5.47 eV, corrugation: 38 meV). (e) By calculating the in-plane derivatives of the potential for each data point (arrows), the magnitude and direction of the forces that act laterally on the tip apex are recovered.
advertised in section 1, the accuracy with which the data collected by the technique can actually be assigned to a specific lattice site is nevertheless limited by structural asymmetries of the tip apex and its elastic deflections under the influence of external forces as it is being scanned over the sample surface [24, 32, 34, 35]. The extent of elastic deformation ultimately depends on how close the tip apex approaches the sample surface in question as well as on the lateral and vertical stiffness of the specific tip. A thorough evaluation of these issues, including a detailed comparison of current methods and approaches used in atomic-scale surface force field spectroscopy, as well as a detailed discussion regarding the effect of tip asymmetry, is presented elsewhere [24]. In short, we find that post-data-acquisition correction procedures as described in [22] alleviate most of the effects associated with overall deflections of the tip apex caused by normal forces, even though structural tip asymmetries and deformations due to local lateral forces may still distort the measured tip–sample force field when compared to the ‘true’ surface force field that would be experienced by a single atom probe. From the maximum lateral force gradient observed in our data set, a lower limit of 9 N m−1for the lateral tip stiffness can be estimated, which translates into a distortion of less than two pixels (<14 pm)
for any data point. This value is small enough that it does not alter any of the findings and conclusions drawn below, i.e. disregarding this experimental aspect is justified. On the other hand, we will see that asymmetry effects associated with the specific tip used in the experiment are evident.
3. Results and discussion
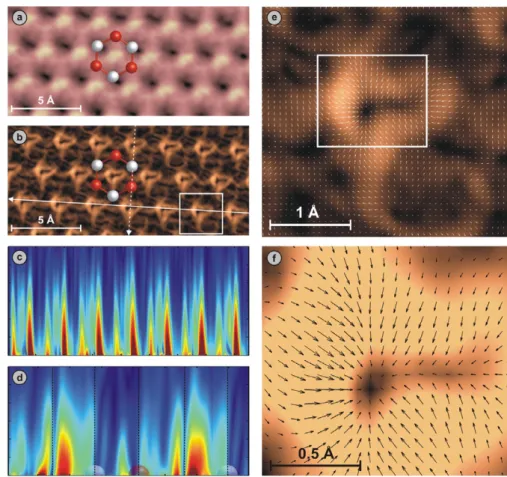
Figure 2 summarizes the basic information needed for the subsequent more detailed analysis. First, normal and lateral force maps obtained at a fixed height above the surface are displayed in figures2(a) and (b), respectively [21,22]. It can be observed that maximum lateral forces are concentrated in asymmetric rings around attractive force maxima, which have previously been identified as coinciding with the hollow sites of the graphite lattice [21, 36–38]. The evolution of lateral forces with varying distance from the surface is investigated using vertical slices through the data set such as those pictured in figures 2(c) and (d) for two different crystallographic directions. We find that the lateral force corrugation decreases gradually with increasing distance from the surface. This reduction causes clear atomic resolution to disappear at heights larger than roughly 120 pm above the plane of closest approach, which corresponds to normal forces smaller than
Nanotechnology 23 (2012) 405703 M Z Baykara et al
Figure 2. (a) Normal force map (1700 pm × 760 pm) obtained at a height of 12 pm. The average normal force at this height is −2.31 nN and the corrugation ≈70 pN. Exemplary locations of A (red) and B (white) type atoms of the graphite lattice are given (with A and B type atoms distinguished based on whether or not they have a neighbor in the layer below; see [21]). (b)–(f) Lateral force maps. (b) The magnitude of the lateral force obtained at the same height as in (a). The color scale ranges from 0 to 120 pN (dark to bright). (c), (d) The distance dependence of lateral forces extracted from the three-dimensional data set by cutting vertical slices along the solid (c) and dashed (d) lines indicated in (b) with the color scale ranging from 0 to 100 pN (dark blue to dark red). Vertical axes correspond to z values from 0 to 120 pm. In (d), the locations of the A and B type atoms are highlighted by semitransparent spheres using the same color code as in (a) and (b). (e) Zoom into the area that is highlighted in (b) by the white rectangle; data points are represented by vectors indicating the magnitude and direction of the lateral forces. (f) A further zoom into the area marked in (e). The background contrast has been altered compared to (e) for better visibility of the force field vectors.
about −1.6 nN (the negative sign indicates attractive forces). The largest lateral force observed in the plane of closest approach is ≈0.21 nN. This is comparable to the maximum lateral forces observed on Si [29] and KBr [30] using similar techniques and the lateral forces observed during lateral atom manipulation [39], but somewhat smaller than the 8 nN observed on NiO [28].7 Finally, figures2(e) and (f) reflect zoom images of the areas marked by the white rectangles in figures2(b) and (e), respectively. The superimposed arrows represent the magnitude and direction of the static lateral forces at each data point, as in figure1(e).
From this starting point, let us move on by noting three interesting issues.
(1) The lateral force rings around attractive normal force maxima exhibit an asymmetry that is incongruent with the hexagonal symmetry of the underlying lattice. As indicated in section 2, we assign this effect to the 7 Note that the chemical composition and the structure of the tip apex affect
the tip–sample interaction significantly (see [40,41]).
asymmetric shape of the tip apex with which the surface force field is probed. In contrast to conventional FFM experiments where the contact is comprised of many atoms, only the few outermost atoms of the tip apex are effectively probing the sample in NC-AFM, with one atom dominating the contrast in atomic-resolution images. Thus, tip asymmetries become readily observable in high-resolution lateral force maps such as the ones presented here.
(2) Lateral force vectors point towards the centers of the lateral force rings, where the potential minima (i.e. normal attractive force maxima) are located on hollow sites of the graphite lattice. Even though the lateral force data presented here have been acquired in the attractive force regime, previous studies [9, 13] suggest that potential minima for contact mode sliding of single asperities on graphite are also located on the hollow sites of the graphite lattice. Sharp sliders moving on this surface would therefore be trapped in these locations, leading to an incomplete surface profiling due to the stick-slip motion discussed earlier. Since the tip oscillation in
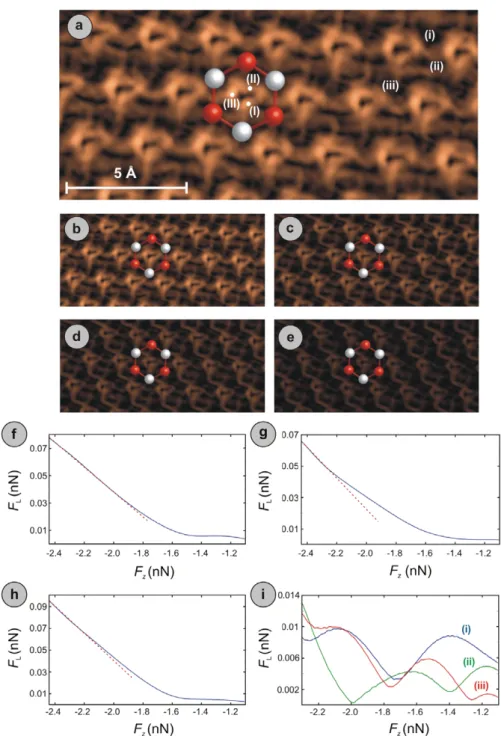
Figure 3. Lateral force maps for fixed normal force values of −2.31 nN (a), −2.19 nN (b), −1.99 nN (c), −1.89 nN (d), and −1.76 nN (e), with the color scale as in figure2(b). Three arbitrary locations on a lateral force ring are designated as (I)–(III). (f)–(h) Plots of lateral force (FL) versus normal force (Fz) for points (I)–(III), respectively. Overall linear behavior is clearly observed for small tip–sample distances,
even though slight deviations to this trend exist, as shown in (g). A similar relationship between lateral and normal forces exists for all points located on lateral force rings. (i) Plot of the lateral force experienced by the tip with respect to normal force at three random locations outside of the lateral force rings. For these locations, which are marked in (a) with (i)–(iii), non-linear behavior is observed.
NC-AFM overcomes such tip trapping, our approach delivers continuous, quantitative real-space images of the lateral forces as well as the underlying potential landscape on all lattice sites of this surface with picometer resolution [23].
(3) The lateral force values measured outside the rings are found to be comparatively low. This localization in confined regions around potential minima differs from other materials, where lateral forces show mainly
sinusoidal character (e.g. [28]). We have previously speculated that this difference might help explain the excellent frictional properties of graphite as a solid lubricant, as sliders incongruent with the hollow site symmetry would float on the region of low lateral forces [21].
To further extend our analysis, we make use of the fact that 3D-AFM intrinsically delivers a complete eight-parameter data array (x, y, z, Fx, Fy, Fz, E, Ediss),
Nanotechnology 23 (2012) 405703 M Z Baykara et al
which comprises the three spatial directions, the conservative (i.e. static) tip–sample forces in these directions, the tip–sample potential energy, and the energy that is dissipated during oscillation, respectively [21–23]. To study correlations and dependences, any of these parameters, or combinations of them, can be investigated as a function of all or a subset of the other parameters. Since we are interested in friction, we construct maps plotting the magnitudes of the lateral forces FL=
q F2
x+Fy2as a function of x and y for selected constant
normal forces Fz. From such maps, the lateral forces that
would be encountered by a hypothetical slider with the shape of the specific AFM tip used in the experiment as it profiles the surface with a fixed attractive normal force covered by the 3D data set can be recovered.
This idea is illustrated in figures 3(a)–(e), where horizontal slices of lateral forces are shown for five fixed normal forces of −2.31 to −1.76 nN. Since all data have been acquired in the attractive interaction regime, our situation does not reflect a true frictional contact, for which the AFM tip would need to move over the surface in repulsive contact. Despite this shortcoming, the dependence of FL
on Fz at different lattice locations on the sample surface
reveals itself as remarkably noteworthy: while FL displays
almost perfectly linear dependence on Fz on rings of high
lateral force concentration up to the distance where atomic resolution is lost (corresponding to normal forces of around −1.6 nN, see figures3(f)–(h)), erratic and non-linear behavior is observed when the dependence of FLon Fz is investigated
for locations outside of the lateral force rings (see figure3(i)). It is important to note here that the data provided by the 3D-AFM technique precisely represents the static lateral force field based on the interaction of the probe tip with the sample surface in the attractive regime. On points above lateral force rings such as (I)–(III) in figure3(a), linear coefficients µ between FL and Fz ranging between 0.09 and 0.17 are
observed, with ≈0.10 being the mean value. The fact that this value is at least an order of magnitude higher than what has been previously observed on graphite using FFM [3,10] supports point 3 discussed above.
To put these findings into context, we remind ourselves that sharp sliders moving over the graphite surface in repulsive contact are known to get stuck in the potential minima (hollow sites) of the surface [9, 13]. The lateral forces concentrated around such potential minima then determine static friction values encountered by those sliders, with the static friction being equivalent to the maximum value of static lateral force encountered while moving out of the potential minimum position in a certain direction. Therefore, if in future experiments the normal force range covered by the 3D-AFM data set could be extended well into the repulsive regime [12,42,43], it would be interesting to see whether the asymmetric lateral force rings observed in the experiments described here would again be encountered and whether the linear trend observed between FL and Fz would
similarly manifest. Such experiments would contribute to a more complete understanding of the fundamental origins for the surprisingly general validity of Amontons’ fundamental law of friction, which features such a linear relationship. But
even for the force range covered by the present set, our data suggest that atoms in a rough sliding contact that are not touching the interface, but are close, may actually follow a basically linear friction–load relationship. Since every rough contact features a very large number of atoms that slide in such close-contact conditions, but are not actually touching, this finding may add another aspect to the many different effects contributing to the linear friction–load behavior found almost universally.
4. Conclusion
In summary, we presented three-dimensional, piconewton resolution lateral force data obtained on graphite with an NC-AFM-based technique, which allowed tracking of the lattice site, distance, and normal force dependence of lateral forces in the attractive interaction regime. Lateral forces were observed to be heavily concentrated in asymmetric rings around potential minima, which correspond to the hollow sites of the graphite lattice, where they depend linearly on normal force at small tip–sample distances. Future experimental challenges include the extension of the experimental approach into the repulsive interaction regime to form a better understanding of lateral forces and potential energy landscapes that would be encountered by single nanoasperities sliding in repulsive contact on surfaces of interest.
Acknowledgments
This work was financially supported by the US Department of Energy (Basic Energy Sciences grant No. DE-FG02-06ER15834), the National Science Foundation through the Yale Materials Research Science and Engineering Center (grant Nos MRSEC DMR-1119826 and DMR-0520495) and the Materials World Network program (grant No. MWN DMR-0806893), and the Petroleum Research Fund (grant No. 42259-AC5).
References
[1] Gnecco E and Meyer E (ed) 2007 Fundamentals of Friction and Wear on the Nanoscale(Berlin: Springer)
[2] Bhushan B (ed) 2008 Nanotribology and Nanomechanics: An Introduction(Berlin: Springer)
[3] Mate C M, McClelland G M, Erlandsson R and Chiang S 1987 Phys. Rev. Lett.59 1942
[4] Szlufarska I, Chandross M and Carpick R W 2008 J. Phys. D: Appl. Phys.41 123001
[5] H¨olscher H, Schirmeisen A and Schwarz U D 2008 Phil. Trans. R. Soc.A366 1383
[6] Carpick R W and Salmeron M 1997 Chem. Rev.97 1163
[7] Ruan J and Bhushan B 1994 J. Appl. Phys.76 5022
[8] L¨uthi R, Meyer E, Bammerlin M, Howald L, Haefke H, Lehmann T, Loppacher C, G¨untherodt H-J, Gyalog T and Thomas H 1996 J. Vac. Sci. Technol. B14 1280
[9] H¨olscher H, Schwarz U D, Zw¨orner O and Wiesendanger R 1998 Phys. Rev. B57 2477
[10] Schwarz U D, Zw¨orner O, K¨oster P and Wiesendanger R 1997 Phys. Rev.B56 6987
[12] Giessibl F J, Herz M and Mannhart J 2002 Proc. Natl Acad. Sci. USA99 12006
[13] Sasaki N, Kobayashi K and Tsukada M 1996 Phys. Rev. B
54 2138
[14] H¨olscher H, Schwarz U D and Wiesendanger R 1996 Europhys. Lett.36 19
[15] H¨olscher H, Schwarz U D, Zw¨orner O and Wiesendanger R 1997 Z. Phys. B104 295
[16] Miura K, Sasaki N and Kamiya S 2004 Phys. Rev. B
69 075420
[17] Socoliuc A, Bennewitz R, Gnecco E and Meyer E 2004 Phys. Rev. Lett.92 134301
[18] Socoliuc A, Gnecco E, Maier S, Pfeiffer O, Baratoff A, Bennewitz R and Meyer E 2006 Science313 207
[19] Steiner P, Roth R, Gnecco E, Glatzel T, Baratoff A and Meyer E 2009 Nanotechnology20 495701
[20] Morita S, Wiesendanger R and Meyer E (ed) 2002 Noncontact Atomic Force Microscopy(Berlin: Springer)
[21] Albers B J, Schwendemann T C, Baykara M Z, Pilet N, Liebmann M, Altman E I and Schwarz U D 2009 Nature Nanotechnol.4 307
[22] Albers B J, Schwendemann T C, Baykara M Z, Pilet N, Liebmann M, Altman E I and Schwarz U D 2009 Nanotechnology20 264002
[23] Baykara M Z, Schwendemann T C, Altman E I and Schwarz U D 2010 Adv. Mater.22 2838
[24] Baykara M Z, Dagdeviren O E, Schwendemann T C, M¨onig H, Altman E I and Schwarz U D 2012 Beilstein J. Nanotechnol.at press
[25] Albers B J, Liebmann M, Schwendemann T C, Baykara M Z, Heyde M, Salmeron M, Altman E I and Schwarz U D 2008 Rev. Sci. Instrum.79 033704
[26] Albrecht T R, Gr¨utter P, Horne D and Rugar D 1991 J. Appl. Phys.69 668
[27] Sader J E and Jarvis S P 2004 Appl. Phys. Lett.84 1801
[28] Schwarz A, H¨olscher H, Langkat S M and Wiesendanger R 2003 AIP Conf. Proc.696 68
[29] Sugimoto Y, Namikawa T, Miki K, Abe M and Morita S 2008 Phys. Rev.B77 195424
[30] Ruschmeier K, Schirmeisen A and Hoffmann R 2008 Phys. Rev. Lett.101 156102
[31] Kawai S, Glatzel T, Koch S, Such B, Baratoff A and Meyer E 2010 Phys. Rev. B81 085420
[32] Fremy S, Kawai S, Pawlak R, Glatzel T, Baratoff A and Meyer E 2012 Nanotechnology23 055401
[33] Atabak M, Unverdi O, Ozer H O and Oral A 2009 J. Vac. Sci. Technol.B27 1001
[34] Such B, Glatzel T, Kawai S, Koch S and Meyer E 2010 J. Vac. Sci. Technol.B28 C4B1
[35] Kawai S, Glatzel T, Koch S, Baratoff A and Meyer E 2011 Phys. Rev.B83 035421
[36] H¨olscher H, Allers W, Schwarz U D and Wiesendanger R 2000 Phys. Rev. B62 6967
[37] Ciraci S, Baratoff A and Batra I P 1990 Phys. Rev. B41 2763
[38] Ashino M, Schwarz A, H¨olscher H, Schwarz U D and Wiesendanger R 2005 Nanotechnology16 S135
[39] Ternes M, Lutz C P, Hirjibehedin C F, Giessibl F J and Heinrich A J 2008 Science319 1066
[40] Enevoldsen G H, Pinto H P, Foster A S, Jensen M C R, K¨uhnle A, Reichling M, Hofer W A, Lauritsen J V and Besenbacher F 2008 Phys. Rev. B78 045416
[41] Pou P, Ghasemi S A, Jelinek P, Lenosky T, Goedecker S and Perez R 2009 Nanotechnology20 26401
[42] Schirmeisen A, Weiner D and Fuchs H 2006 Phys. Rev. Lett.
97 136101
[43] Lichtenstein L, B¨uchner C, Stuckenholz S, Heyde M and Freund H-J 2012 Appl. Phys. Lett.100 123104