Signi
ficance of the Mn-Oxidation State in Catalytic and Noncatalytic
Promotional E
ffects of MnO
x
Domains in Formic Acid
Dehydrogenation on Pd/MnO
x
Interfaces
Bartu Karakurt, Yusuf Kocak, Igor Lyubinetsky, and Emrah Ozensoy
*
Cite This:J. Phys. Chem. C 2020, 124, 22529−22538
ACCESS
Metrics & More Article Recommendations*
sı Supporting InformationABSTRACT: The influence of MnOx overlayers/nanoclusters
deposited on the Pd(111) single-crystal model catalyst surface on the catalytic dehydrogenation of double-deuterated formic acid (FA, DCOOD) was studied under ultrahigh vacuum conditions via temperature-programmed desorption and X-ray photoelectron spectroscopy techniques. A significant boost in D2generation was observed in the catalytic FA dehydrogenation on MnOx/Pd(111) as
compared to that of a clean Pd(111) model catalyst, demonstrating the cooperative interaction between Pd(111) and MnOx sites.
Maximum FA conversion was observed at a submonolayer MnOx
surface coverage of 0.25 ML (monolayer) on Pd(111), whereas D2
formation was found to be suppressed when the Pd(111) surface was entirely covered with relatively thick (15 ML) MnOxoverlayers.
A direct correlation between increasing relative abundance of
oxidized Mn surface states (i.e., Mn2+, Mn3+, and Mn4+) and increasing catalytic FA dehydrogenation was observed. Different modes of promotion of FA dehydrogenation via MnOx (i.e., catalytic promotion versus noncatalytic/stoichiometric promotion) were
discussed as a function of the differences in the model catalyst preparation and the extent of oxidation of the MnOxoverlayer.
1. INTRODUCTION
Formic acid (FA) is a promising hydrogen-based energy vector as it possesses a relatively high hydrogen content by mass (i.e., 4.4 wt %) and exists in liquid form under ambient conditions, having low toxicity and low flammability.1,2 FA can be obtained from naturally abundant sources such as CO23,4 as
well as renewable biomass feedstocks.5 These features render hydrogen production from FA a favorable option in various hydrogen energy applications.6,7 Catalytic decomposition of FA occurs via two competing pathways, namely dehydrogen-ation (HCOOH→ H2+ CO2) and dehydration (HCOOH→
H2O + CO). As the FA dehydration pathway does not yield any H2, catalytic selectivity toward H2 is governed by the
dominance of dehydrogenation over dehydration. In addition, CO generated as a result of dehydration can bind to the catalytically active noble metal sites (e.g., Pd) in a strong and a rather irreversible manner at room temperature (RT), leading to site blocking and catalytic poisoning. Hence, the dehydration pathway significantly limits the catalytic selectivity and the catalyst life span.
FA decomposition on various late transition-metal surfaces such as Pd,8−12Rh,13−15Ru,16,17Pt,18−20Cu,21−23Co,24Ag,25 as well as Pd−Ag26and Pd−Au27bimetallic systems, has been extensively studied under ultrahigh vacuum (UHV) conditions. These studies showed that many high-coordination
transition-metal single-crystal surfaces were capable of carrying out FA dehydrogenation effectively.8,9,13,16,18,19One of the key aspects associated with the catalytic action of these metal surfaces is their ability to stabilize the main FA decomposition intermediate, that is, formate.28
Pd is known to be one of the most active catalytic metals that can efficiently generate ultrahigh purity hydrogen from biomass side products such as FA.29−32 The catalytic FA dehydrogenation performance of Pd-based heterogeneous catalytic systems is often improved via the introduction of additional bases into the reaction medium33 or via the utilization of catalytic metal oxide promoters functionalized with basic groups in order to initiate the reaction and enhance selectivity toward H2 formation.
32,34,35
Former UHV studies on various single-crystal model catalysts revealed that the presence of Brønsted (e.g., NH3)
8
and/or Lewis bases9,13,18 (e.g., atomic O) can enhance the selectivity of group VIII transition-metal single-crystal surfaces toward FA
dehydrogen-Received: July 29, 2020
Revised: September 16, 2020
ation. In a former study,36we also showed that a high-surface-area mesoporous powder catalyst containing PdAg bimetallic nanoparticle active sites promoted with MnOx nanodomains
(dispersed on an amine-functionalized SiO2support) exhibited
an extraordinarily high activity and selectivity in FA dehydrogenation at RT. Using in situ Fourier transform infrared (FTIR) spectroscopy, we demonstrated that36MnOx
promoter enhanced the catalytic FA decomposition over Pd active sites by (a) increasing FA adsorption on the catalyst surface through the formation of new FA adsorption sites, (b) facilitating FA deprotonation and formate production, (c) stabilization of the formate species on the catalyst surface, and (d) capturing/storing the catalytically generated CO(g) side product in the form of carbonates and preventing CO poisoning of the Pd active sites on which formate species are converted into the ultimately desired catalytic product, H2. However, to this date, the relationship between the detailed electronic structure of the MnOxdomains and FA dehydrogen-ation performance has been mostly unknown.
Along these lines, in this study, the influence of MnOx overlayers/nanoclusters deposited on a Pd(111) single-crystal model catalyst on catalytic FA dehydrogenation is investigated using surface-sensitive UHV experimental methods. In the current work, we show that the presence of a MnOx/Pd(111)
interface increases the hydrogen production as compared to a clean Pd(111) single-crystal model catalyst surface, where a correlation is established between the boosted catalytic performance and the extent of the oxidic character of the MnOxsurface states.
2. EXPERIMENTAL SECTION
2.1. Experimental Setup. Experiments were conducted in a custom-made UHV chamber with a base pressure of 1 × 10⁻¹⁰ Torr. The UHV chamber was equipped with the following modules: an X-ray photoemission spectroscopy (XPS; Riber Mg/Al dual anode X-ray source and a Riber EA 150 double pass cylindrical mirror electron energy analyzer) system, a custom-made low-energy electron diffraction optics, temperature-programmed desorption (TPD) instrument, temperature-programmed reaction spectroscopy (containing Ametek Dycor Dymaxion DM 200 quadrupole mass spectrometer and a Heatwave model 101303 PID-controlled linear sample heater) module, custom-made Mn thin-film evaporators, and an Ar+ion gun (LK Technologies, NGI3000). Moreover, the UHV chamber also contained three separate gas dosing lines equipped with high-precision leak valves. The Pd(111) single-crystal sample (10 mm diameter × 1 mm thickness disc, polished on both sides, purity > 99.999%, MaTeck GmbH) was affixed on Ta wires, which allowed cooling of the sample with liquid nitrogen to 90 K and heating it up to 1073 K via resistive heating. The temperature of the sample was measured by using a K-type thermocouple (thickness: 0.005 in., Omega Inc.) which was spot-welded on the upper side of the Pd(111) single crystal.
2.2. Cleaning of Pd(111) Single-Crystal Surface. Before each experiment, the Pd(111) sample surface was cleaned by using various methods depending on the extent of contami-nations present on the surface of the Pd(111) sample. Thefirst method consisted of multiple cleaning cycles, where Pd(111) was exposed to O2(g) (Linde AG, purity ≥ 99.999%) (PO2=
1.0× 10⁻⁸Torr, 5 min at 600 K) and subsequently annealed at 727 K for 5 min in vacuum. In the second method, after
exposing the Pd(111) sample to the conditions given above, the sample wasflash-heated to 1000 K and then Ar+-sputtered (Ar(g), Linde AG, purity≥ 99.999%) with an ion gun (1.5 kV × 15 mA) at RT, followed by annealing at 1000 K in UHV for 5 min. The third method included Ar+ sputtering at RT,
followed by annealing at 1000 K in UHV for 5 min. The cleanliness of the Pd(111) surface was checked by performing blank TPD experiments, where the m/z = 28 desorption channel was monitored to verify the absence of strongly bound CO species on the surface before conducting the experiments.8 2.3. Utilization of Deuterated FA (DCOOD). DCOOD (FA-d2, D > 98%, D2O < 5%) was purchased from Cambridge
Isotopes Laboratories Inc. (USA). The pristine DCOOD sample vial was initially opened inside a glovebox (i.e., under a controlled atmosphere) and transferred into a UHV-compat-ible glass bulb equipped with a Swagelok VCR Nupro valve in order to prevent the exposure of DCOOD to atmospheric H2O and CO2. The UHV-compatible glass bulb was also covered
with an Al foil to prevent possible photochemical reactions. Then, DCOOD(g) was introduced to the UHV chamber through a dedicated high-precision leak valve, using a fresh DCOOD dose before each TPD experiment as DCOOD is known to decompose upon its long-term interaction with stainless steel.9
2.4. Manganese Deposition and MnOxFilm Prepara-tion. Before each experiment, metallic Mn(s) (MaTeck GmbH, Germany, Mn foil casted, purity: >99.9%) was thermally evaporated onto the clean Pd(111) single-crystal model catalyst surface at RT in UHV. The custom-made thermal evaporator had the dimensions of 1 mm× 5 mm × 1 mm and was operated with an input power of 1.5 V× 12 A = 18 W via resistive heating. In the experiments where the MnOx/Pd(111) surface was initially oxidized with O2, Mn was first deposited on the clean Pd(111) substrate in UHV at RT. Then, this MnOx/Pd(111) sample wasflash-heated to 1000 K in UHV in order to mimic the morphology changes that might occur during the FA TPD experiments on MnOx/Pd(111). Next, the MnOx/Pd(111) system was exposed to 4.8× 10⁻⁵L
of O2 at 623 K (4 × 10⁻⁸ Torr × 20 min) in front of the dedicated O2leak valve.
2.5. TPD and XPS Data Acquisition. TPD experiments were performed with a heating rate of 1 K/s. Multiplexing of each desorption channel during the TPD data acquisition was carried out using a dwell time of 30 ms. XPS measurements were performed by applying 250 W power to a Mg anode. The dwell time used for each energy step in the XPS measurement was 1 s, and each XPS spectrum was averaged over 15 scans.
3. RESULTS AND DISCUSSION
3.1. DCOOD Adsorption on Pd(111). The TPD profiles presented in Figure 1 were obtained by the adsorption of DCOOD, with an exposure ofεDCOOD = 8× 10⁻³L (1 L = 10−6Torr s), on a clean Pd(111) surface at 123 K. Note that this particular FA exposure was chosen in order to be able to monitor all the relevant desorption features/products clearly (for instance, as shown in Figure S1, a relatively lower FA exposure of εDCOOD = 4 × 10⁻³ L did not yield sufficiently
strong desorption signals to effectively monitor all relevant reaction desorption channels), while minimizing the effects of water impurities in the FA feedstock, which can react with CO to replenish the poisoned Pd active sites.8,37 Figure 1reveals the presence of m/z = 4 (D2), m/z = 30 (DCO), and m/z = 48 (DCOOD) desorption signals, which is consistent with the
adsorption of DCOOD on Pd(111).8On the other hand, the occurrence of m/z = 2 (H2) and m/z = 3 (DH) desorption
signals indicates the presence of singly deuterated (DCOOH/ HCOOD) and nondeuterated (HCOOH) FA species in the DCOOD feedstock and/or proton exchange events between DCOOD and the background H2 and/or H2O. It should be
noted that the m/z = 46 desorption signal can be associated with both DCOO (i.e., mass spectroscopic fragmentation of DCOOD) and molecular HCOOH species.
The TPD profiles shown inFigure 1can be divided into four main desorption windows. The first desorption window is centered at ca. 167 K, and it is attributed to the desorption of catemeric/monomeric FA species formed on Pd(111).8,9 It should also be pointed out that the signals belonging to water species, that is, m/z = 20 (D2O), m/z = 19 (DHO), and m/z =
18 (H2O) signals, desorbing around 167 K are in line with the
typical submonolayer water desorption from Pd(111).8,38 These species are assigned to the minor impurities in the FA
feedstock. Thus, thefirst desorption window is mostly due to the mass spectroscopic fragmentation of catemeric/monomeric FA units inside the quadrupole mass spectrometer rather than catalytic FA dehydrogenation/dehydration/decomposition re-actions.8
In Figure 1, the second desorption window is centered at
192 K. The presence of a minor molecular FA desorption feature along with the appearance of intense CO2, D2O, DHO, and H2O signals (accompanied by D2, DH, and CO desorption
signals observed at higher temperatures) suggests that FA is catalytically decomposed on Pd(111) at 192 K.8,26 Various experimental9,13,16,18 and theoretical39−41 studies on group VIII metal surfaces such as Pd(111) reported the formation of bidentate bridging formate species upon FA exposure. Consequently, the presence of an intense m/z = 44 (CO2) signal at 192 K may suggest that the Pd(111) surface can decarboxylate the formate intermediate, facilitating FA dehydrogenation.8 However, simultaneous desorption of m/z = 44 (CO2), m/z = 20 (D2O), m/z = 19 (DHO), and m/z = 18 (H2O) species at 192 K suggests that the Pd(111)
single-crystal model catalyst is not 100% selective toward dehydrogenation. Note that the m/z = 28 (CO) signal at ≤192 K is attributed to the mass spectroscopic fragmentation of CO2as the line shapes of the corresponding m/z = 44 and
m/z = 28 signals show significant resemblance, and CO desorption from the Pd(111) surface at submonolayer coverages occurs typically at much higher temperatures, such as 470−500 K, because of the strong chemisorption of CO on Pd(111).42−46
The third desorption window inFigure 1is centered around 320 K, and it is due to the recombinative desorption of hydrogen species, that is, m/z = 4 (D2), m/z = 3 (DH), and
m/z = 2 (H2), from the Pd(111) surface, which are generated as a result of dehydrogenation.8,9In order to clarify the origin of m/z = 2 (H2), the corresponding background H2desorption
signal from a clean Pd(111) surface (i.e., without any FA adsorption) was investigated in a control experiment (Figure S2). This control experiment revealed that H2adsorbed onto a
clean Pd(111) surface from the background desorbed around 335 K, with the tail extending to higher temperatures.
Figure 1.TPD profiles obtained upon a DCOOD exposure of 8 × 10⁻³L at 123 K on clean Pd(111). Some of the desorption signals were multiplied with the given factors for better visualization.
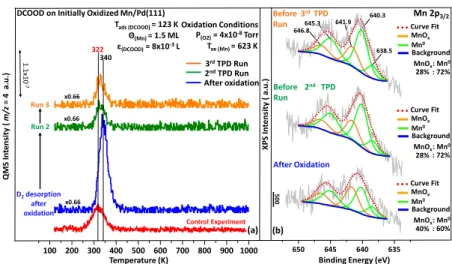
Figure 2.(a) TPD profiles showing the evolution of D2(m/z = 4) desorption signal upon three successive DCOOD adsorptions on MnOx(1.5
ML)/Pd(111) as compared to the control experiment performed on a clean Pd(111) surface under identical conditions. Before each TPD experiment, a fresh dose of DCOOD was adsorbed on MnOx(1.5 ML)/Pd(111) at 123 K (εDCOOD= 8× 10⁻³L). (b) Corresponding Mn 2p3/2
Corresponding differences in the desorption maxima and the lack of the high-temperature desorption tail in the m/z = 2 (H2) desorption channel given inFigure 1suggest that the m/z
= 2 (H2) desorption signal in Figure 1 is not due to
background H2adsorption. Moreover, considering the different
intensity scales in Figures 1 and S2, it is clear that the magnitude of H2desorption in the DCOOD/Pd(111) system
is greater than that of the clean Pd(111) surface. Therefore, the m/z = 2 (H2) desorption signal that is observed inFigure 1
was also classified as a dehydrogenation product.
Finally, the last temperature window in Figure 1 is positioned at ca. 480 K and reveals a relatively intense m/z = 28 desorption signal, whose desorption maximum is in accordance with the CO desorption observed upon the decomposition of FA on Pd(111).8,9 The absence of any m/ z = 44 (CO2) desorption signal at this temperature suggests
that this species is not associated with CO2. 8
Thus, it is apparent that while the first dehydration product (i.e., H2O,
desorbing at T ≤ 192 K) is bound relatively weakly to the Pd(111) surface, the second dehydration product (i.e., CO, desorbing at 480 K) adsorbs extremely strongly on Pd(111) and blocks/poisons the surface.
3.2. D2 Formation on MnOx/Pd(111). In order to
investigate how the MnOx/Pd(111) surface differs from the
clean Pd(111) surface in terms of D2generation capability and
how D2generation evolves after consecutive reaction runs, 1.5
ML (monolayer) MnOxwas deposited on clean Pd(111) prior to FA exposure and investigated in a comparative fashion via TPD (Figure 2a) and XPS (Figure 2b). In these sets of experiments, three successive identical FA adsorptions were carried out on the MnOx (1.5 ML)/Pd(111) surface. Before each FA exposure, XPS analysis was carried out, and after each FA exposure, TPD analysis was performed (seeSection 2.4and
Figure S3 for further details regarding MnOx deposition
protocols and quantification of the MnOxoverlayer coverage
on the Pd(111) surface). ForθMnOx < 1.5 ML, the signal-to-noise ratio of the Mn 2p3/2XP signal of the currently utilized
photoelectron energy analyzer was low, rendering the accurate Mn oxidation state analysis via XPS rather difficult. Therefore, comparative XPS and TPD studies were performed at a MnOx
coverage of 1.5 ML, as shown inFigure 2. It should also be noted that the Pd 3p3/2region (ca. 532 eV47) of the XPS data
overlaps with the O 1s species because of the manganese oxide domains (529.5−532 eV).48Thus, the deduction of conclusive information from the O 1s region of the XPS data regarding the detailed nature of the oxidized manganese overlayer species (such as the possible existence of Mn(OH)xspecies) was not
possible.
Figure 2b presents the Mn 2p3/2 XPS spectrum obtained
after the 1.5 ML MnOx deposition on Pd(111). It is well known that the Mn 2p3/2XPS spectrum of metallic Mn has a
single peak at ca. 638.8 eV.49−51 However, in the former studies regarding Mn overlayers grown on face-centered cubic (fcc) transition-metal surfaces (including Pd52), the main Mn 2p3/2 XPS peak was observed at 640 eV and exhibited an intense satellite separated from the main feature by ca. +5 eV.53−55Therefore, inFigure 2b, the peak located at 640.3 eV, along with the intense satellite feature at 645.3 eV, can be attributed to Mn0species. Moreover, earlier studies have also showed that the main Mn 2p3/2 XPS peak of Mn overlayers
grown on Pd(100)52 and Ni(110)53 exhibited an additional feature located below 640 eV, corresponding to the metallic Mn species that weakly interact with the fcc metal surface
underneath. Consequently, the lowest binding energy peak detected at 638.5 eV in Figure 2b is also attributed to Mn0 species. The XPS spectra of manganese oxide overlayers grown on Pd(100) single-crystal surface showed a close resemblance to bulk manganese oxides,52,56where Mn 2p3/2 peaks located
at ca. 642 eV were mainly associated with the presence of Mn3+
and Mn4+states in bulk manganese oxides.57−59Furthermore, it was reported in earlier studies that the Mn2+ state had a
distinct satellite feature around 647 eV.60−62 As a result of thesefindings, the presence of the broad peak located at 641.9 eV, along with an additional satellite feature occurring at ca. 647 eV, strongly suggests the presence of Mn0as well as oxidic Mn species (i.e., Mn2+, Mn3+, and Mn4+).63
Therefore, the bottommost XPS spectrum in Figure 2b suggests that the deposited manganese overlayer was partially oxidized, where this partial oxidation can be tentatively attributed to the oxidation of Mn by the background water/ hydroxide species generated due to the background pressure spike (ca. 1.5× 10⁻⁹Torr) that occurred during Mn thermal evaporation onto the Pd(111) substrate. The blue D2(m/z = 4) TPD profile given inFigure 2a, corresponding to thefirst of the three successive TPD runs, was obtained after FA adsorption on a freshly prepared MnOx(1.5 ML)/Pd(111)
surface. As can be seen fromFigure 2a, the freshly prepared MnOx(1.5 ML)/Pd(111) surface yielded a significantly smaller
D2desorption signal as compared to that of the clean Pd(111)
surface. Moreover, the presence of MnOx domains also induced a shift in the D2 desorption temperatures toward
higher values, which can be attributed to the hindrance of hydrogen atom surface mobility.8,64Importantly and contrary to thefirst observation, dosing a second identical exposure of DCOOD on the MnOx(1.5 ML)/Pd(111) surface used in the
first run (i.e., spent surface) led to a significant increase in the D2formation in the second TPD run, and the D2desorption signal converged to a constant value in the third subsequent TPD run. It should be noted that the boost in D2formation in the second FA TPD run on the MnOx(1.5 ML)/Pd(111)
surface was also observed for other FA exposures and a variety of MnOx coverages (e.g., see Figures S4 and S5). In other
words, this phenomenon was neither specific to a particular FA exposure nor a unique MnOxcoverage. Although this general behavior was observed for different MnOxcoverages, variation
in the MnOxcoverage had an effect on the ultimate magnitude of the D2increase, as well as the number of runs it took for the
D2signal to saturate (seeFigure S4).
An additional control experiment also revealed that the observed phenomenon was not solely due to the thermally induced morphology changes in the MnOxoverlayer, such as the variations in the dispersion of the MnOx overlayer on
Pd(111) that might occur during the TPD temperature ramp in UHV. Along these lines, running the same reaction on a MnOx(1.5 ML)/Pd(111) surface which was initially annealed
in UHV at 1000 K for 1 min before FA exposure generated a smaller amount of D2 with respect to the clean Pd(111)
surface (Figure S6).
It should also be emphasized that the deposition of a relatively thick (ca. 15 ML) MnOx overlayer, which presumably covered the entire Pd(111) surface, completely suppressed D2and DH formation, while substantially boosting
the CO formation (Figure S7). This observation strongly suggested that MnOxsites were not capable of enhancing D2
formation on their own and the existence of MnOx/Pd interfaces was essential for FA dehydrogenation.
The XPS spectrum in the middle of Figure 2b shows that before the second TPD run (i.e., after thefirst FA adsorption and subsequent TPD run), the MnOx overlayer was further
oxidized. This is somewhat surprising as FA is not a well-known oxidizing agent. Furthermore, the oxidation of MnOx
was also accompanied by an increase in the overall Mn 2p3/2 XPS intensity, which could be attributed to the increased dispersion of the MnOx overlayer on the Pd(111) substrate
upon thefirst TPD temperature ramp to 1000 K (as in the case of a typical strong metal−support interaction). Similarly, the XPS spectrum obtained before the third TPD run, shown as the topmost spectrum inFigure 2b, indicated an additional but minor increase in the oxidic character of the MnOxoverlayer.
Thesefindings suggest that increasing the oxidic character of the MnOxoverlayer enhanced D2formation, implying that the
oxidation state of MnOx plays a crucial role in the D2
production ability of the Pd/MnOx interface in FA dehydrogenation.
3.3. D2Formation on MnOx/Pd(111) Surface Oxidized
with O2 Prior to FA Exposure. As the findings discussed
above indicated that the increase in the oxidic character of MnOx promoted D2 formation, an additional set of
experi-ments was carried out on the MnOx(1.5 ML)/Pd(111)
surface, where the freshly prepared MnOx(1.5 ML)/Pd(111) surface was oxidized via O2(PO2= 4 × 10
−8Torr, 623 K, 20
min) prior to FA dosing (Figure 3a,b). After the initial oxidation of the MnOx(1.5 ML)/Pd(111) surface with O2,
three successive FA exposures were introduced on this model catalyst surface. Then, XPS/TPD analyses were performed before/after each FA dose. The bottommost Mn 2p3/2 XPS spectrum given inFigure 3b suggests that the MnOx(1.5 ML)/
Pd(111) surface that was initially oxidized with O2prior to FA
Figure 3.(a) TPD profiles showing the evolution of the m/z = 4 (D2) desorption signal upon three successive DCOOD adsorptions on MnOx(1.5
ML)/Pd(111) which was initially oxidized with O2. Before each TPD experiment, a fresh dose of DCOOD was adsorbed on oxidized MnOx(1.5
ML)/Pd(111). (b) Corresponding Mn 2p3/2XPS spectra obtained before each TPD experiment for MnOx(1.5 ML)/Pd(111) which was initially
oxidized with O2. Some of the desorption signals were multiplied with the given factors for better visualization.
Figure 4.Integrated TPD desorption signals of various DCOOD (TDCOOD ads= 123 K,εDCOOD= 8× 10⁻³L) catalytic decomposition products on
MnOx/Pd(111) model catalysts as a function of MnOxoverlayer coverage. Corresponding histograms for each MnOxcoverage were obtained by
integrating the saturation TPD signal after the nth TPD run, yielding the maximum amount of desorption products for that particular MnOx
adsorption had a MnOx overlayer with the highest oxidic
character among all other currently studied cases. Furthermore, the TPD profiles inFigure 3a clearly show that the oxidation of MnOx with O2prior to FA adsorption caused an immediate
boost in the D2formation. It should be noted that the initial oxidation with O2prior to FA adsorption also shifted the D2
desorption maxima to higher temperatures (by ca. 20 K). This shift can be attributed to the hindrance of hydrogen atom mobility8,64 and stabilization of the formate intermediate by MnOxoxidized with O2(seeFigure 5c).
Unlike in Figure 2a, the reactivity boost due to initial oxidation with O2was observed only for thefirst TPD run in
Figure 3a, and this boost diminished in the successive TPD
runs. As a result of this observation, it can be argued that O2 exposure can lead to the formation of more reactive but less stable MnOx/Mn(OH)xspecies compared to FA, where these more reactive species are depleted immediately after reacting with FA.
The XPS spectrum in the middle ofFigure 3b indicates that, before the second TPD run (i.e., after the oxidation step and thefirst TPD run), the oxidic character of MnOxconsiderably
decreased. On the other hand, the topmost XPS spectrum in
Figure 3b suggests that, within our detection limits, the third
reaction run caused a negligible change in the general oxidation state of the MnOx overlayer as compared to that
of the second run. As a result, it can be argued that the correlation between the increasing oxidic character of the MnOx overlayer and enhanced FA dehydrogenation activity
observed for MnOx(1.5 ML)/Pd(111) in Figure 2 was also
generally valid for the data given inFigure 3for the MnOx(1.5 ML)/Pd(111) surface which was initially oxidized with O2.
3.4. Effects of MnOx Coverage on Catalytic FA Decomposition. The influence of the MnOx overlayer
coverage on the catalytic FA decomposition ability of the MnOx/Pd(111) model catalysts was also investigated. Hence,
different MnOx/Pd(111) model catalysts with varying MnOx
overlayer coverages were prepared, and the optimum MnOx
overlayer coverage was determined. Figure 4 illustrates the integrated relative quantities of FA dehydrogenation and dehydration products (see Figure S8for the associated TPD profiles andTable S1for the integration temperature intervals used for the calculation of the histograms inFigure 4). One can see in Figure 4 that both the dehydration and dehydrogenation products followed a similar trend, having a maximum yield at the MnOxcoverage of 0.25 ML. It should be emphasized that a somewhat different trend was observed for the integrated H2 production signals (which might be
attributed to the influence of the background H2 in the UHV chamber).
It is clear that the highest FA conversion was obtained for the MnOx (0.25 ML)/Pd(111) surface. On this surface, the
MnOx overlayer had a submonolayer coverage and did not
fully cover the Pd(111) substrate surface, allowing the existence of active Pd/MnOx interfaces available for FA
adsorption. Hence, it is clear that within 0 <θMnOx< 0.25 ML,
there exists a sufficiently large number of available/exposed Pd(111) active sites, and thus, catalytic performance increases monotonically with the increasing surface coverage of MnOx
domains which act as promoters. However, at coverages higher thanθMnOx> 0.25 ML, because of the blocking of the Pd(111)
active sites, the number of Pd(111) active sites decreases below the sufficient value and the catalytic performance starts to diminish.
3.5. Catalytic and Noncatalytic Promotional Effects of MnOx on FA Decomposition over Pd(111). After having determined the optimum MnOx overlayer coverage for
DCOOD dehydrogenation on MnOx/Pd(111) model catalysts as 0.25 ML, we investigated the detailed behavior of this particular MnOxoverlayer coverage in successive FA TPD runs
in the absence (Figure 5a) and presence of initial oxidation with O2(Figure 5c).
The TPD data inFigure 5a,c correspond to two of the most active MnOx(0.25 ML)/Pd(111) model catalysts obtained (i)
after oxidation with FA (Figure 5a, third TPD run) and (ii) in
Figure 5.TPD data obtained for (a) third successive FA TPD run on MnOx(0.25 ML)/Pd(111). (b) High-temperature portion (400−800 K) of
the m/z = 28 (CO) desorption channel given in (a). (c) First FA TPD run over MnOx(0.25 ML)/Pd(111) which was initially oxidized with O2.
(d) High-temperature portion (400−800 K) of the m/z = 28 (CO) desorption channel given in (c). (e) Integrated quadrupole mass spectrometry intensities of various desorption channels obtained from the indicated surfaces. Some of the data were multiplied with the given factors for better visualization.
a single FA TPD run after initial oxidation with O2(Figure 5c, first TPD run). Comparison of these two different types of MnOx(0.25 ML)/Pd(111) model catalysts (Figure 5a,c) with
that of the clean Pd(111) surface (Figure 1) is given inFigure 5e. This comparison reveals that increasing the oxidic nature of the MnOxoverlayer either by successive FA TPD runs or via initial oxidation with O2 leads to a simultaneous increase in
both dehydrogenation and dehydration products and an increase in the overall total FA conversion (seeTable S2 for the integration temperature intervals used for the calculation of the histograms given inFigure 5e).
Despite the fact that both of the MnOx(0.25 ML)/Pd(111)
model catalysts given in Figure 5a,c increase the overall FA conversion, surface chemistries of these differently prepared catalysts were quite dissimilar. First, the comparison of the CO2desorption signals for the FA TPD data of clean Pd(111)
(Figure 1) and that of the third FA TPD run of MnOx(0.25
ML)/Pd(111) (Figure 5a) points to the fact that when the MnOx overlayer was oxidized via three successive FA TPD
runs (Figure 5a), an additional high-temperature CO2 desorption shoulder was observed at 322 K, which was absent in the case of clean Pd(111) (Figure 1). Moreover, the inset given inFigure 5b reveals the presence of an additional broad CO desorption feature that centers at ca. 750 K inFigure 5a, whereas these high-temperature CO features are absent for clean Pd(111) (Figure 1). In our former in situ FTIR studies,36 we reported the formation of carbonates on the PdAg/MnOx/ SiO2and MnOx/SiO2mesoporous powder catalysts upon CO
adsorption. Therefore, the high-temperature CO2 desorption features observed inFigure 5a and the high-temperature CO desorption features observed inFigure 5b can be attributed to the presence of adsorbed carbonate species on MnOxdomains,
where the presence of CO and CO2desorption peaks around
750 K was also attributed to the presence of strongly bound carbonate species that are formed upon the adsorption of FA on K-promoted Rh(111) surface.65This observation suggests that this particular oxidic character of MnOxcan enhance FA
adsorption and deprotonation,36 where FA adsorbed on manganese oxide domains can eventually spillover onto the Pd(111) active sites, regenerating/unveiling the MnOx
adsorption sites for the next catalytic cycle. This particular performance-boosting action of the MnOx overlayers can be
considered to be a noncatalytic (i.e., stoichiometric or sacrificial) effect, as this type of promotional effect is expected to gradually diminish as the MnOxdomains are continuously
and irreversibly covered with strongly bound carbonate species. Accordingly, lack of significant differences in the desorption temperatures of the major desorption features of the clean Pd(111) single crystal (Figure 1) and that of the MnOx(0.25 ML)/Pd(111) surface shown in Figure 5a also implies such a noncatalytic performance enhancement by MnOxdomains. In addition, the presence of high-temperature
CO desorption features (Figure 5b) also suggests that MnOx
domains can act as sacrificial sites for CO adsorption36 and hinder CO poisoning of the Pd(111) active sites.
On the other hand, as a manifestation of the differences in the oxidic nature of the MnOxoverlayers due to the variations in catalyst preparation protocols, catalytic promotional effects of the MnOxdomains can also be envisaged, particularly in the
case of the MnOx(0.25 ML)/Pd(111) surface which was
initially oxidized with O2 (Figure 5c). Similar to the case in
which the MnOx overlayer was oxidized via three successive FA TPD runs (Figure 5a),Figure 5d also reveals the presence
of high-temperature CO desorption signals which can be attributed to the presence of strongly adsorbed carbonate species.36,65 Unlike in Figure 5a, the major CO2 desorption signal in Figure 5c was observed to shift to a significantly higher temperature of 283 K (along with a drastic growth in CO2 desorption intensity) as compared to that of the clean
Pd(111) surface, whereas the major CO2 desorption signal appeared at 192 K in the latter case (Figure 1). This significant increase in the major CO2 desorption temperature for the MnOx(0.25 ML)/Pd(111) surface which was initially oxidized
with O2(Figure 5b) implies that, when MnOx is sufficiently oxidized, it can simultaneously improve FA adsorption/ deprotonation and formate stability,8,9 positively contributing to the catalytic FA dehydrogenation.39 Moreover, Figure 5c also reveals that oxidizing MnOx with O2 separates the desorption temperatures of water (243 K) and CO2(283 K)
species, suggesting that oxidized MnOx is also capable of decoupling the dehydrogenation and dehydration reactions that occur simultaneously on a clean Pd(111) surface (Figure 1) via improving formate stability. On the other hand,Figure 5c reveals that oxidizing MnOxwith O2also possibly triggers additional dehydration pathways (such as the condensation reactions of catemeric FA species, leading to the formation of water), once again showing that MnOx does not selectively
enhance catalytic FA dehydrogenation. As a result, the significant alterations that were observed in the FA decomposition chemistry after MnOx oxidation with O2 suggest that MnOx can also catalytically contribute to FA
decomposition when it is sufficiently oxidized. It should be noted that similar to the MnOxoverlayer that is oxidized via
three successive FA TPD runs, the presence of high-temperature CO adsorption features implies that manganese oxide that was initially oxidized with oxygen can contribute to the enhanced catalytic FA conversion performance of MnOx(0.25 ML)/Pd(111) by hindering CO poisoning of the Pd(111) active sites as well.
4. CONCLUSIONS
In the current work, we investigated catalytic FA decom-position on planar model catalyst surfaces composed of a MnOx overlayer grown on a Pd(111) single crystal surface
using various catalyst preparation protocols and compared the catalytic behavior of these systems to that of a clean Pd(111) benchmark catalyst. Increasing the oxidation state of the Mnx+
species in the MnOx overlayer was found to boost both the
dehydrogenation and dehydration pathways in a simultaneous manner. As a consequence of the differences in the surface chemistry and oxidation extent of the MnOx overlayers on Pd(111) in different model catalyst preparation protocols, different promotional effects for MnOx domains were proposed. In the case of the noncatalytic (i.e., stoichiometric or sacrificial) promotional effect, MnOx overlayers mainly serve as additional FA adsorption sites and facilitate FA adsorption/deprotonation, where FA that is adsorbed on the MnOx domains can eventually spillover onto the Pd(111)
active sites, regenerating/unveiling MnOxadsorption sites for the next catalytic cycle. This particular promotional effect was observed for the moderately oxidic MnOx overlayers on Pd(111). On the other hand, in the case of the catalytic promotional effect, highly oxidic MnOxdomains increased the formate stability and decoupled the dehydrogenation reaction from the dehydration reaction in terms of the corresponding product desorption temperatures. In all cases, MnOxoverlayers
also acted as CO capture domains, hindering CO poisoning of the Pd(111) active sites. The currently reported mechanistic results on MnOx/Pd(111) model catalysts are in very good agreement with the former literature on high-surface-area powder catalysts containing Pd/MnOxinterfaces36and provide valuable molecular-level insights regarding the fundamental understanding of the promotional effects of MnOx in the catalytic dehydrogenation of FA on Pd. Along these lines, current results can also be potentially applicable to the catalytic dehydrogenation of not only FA but also other organic acids or carboxylated oxygenates on different mesoporous high-surface-area transition-metal/metal oxide interfaces in order to design superior dehydrogenation catalysts to produce hydrogen from sustainable biomass feedstock.
■
ASSOCIATED CONTENT*
sı Supporting InformationThe Supporting Information is available free of charge at
https://pubs.acs.org/doi/10.1021/acs.jpcc.0c06942.
TPD profiles obtained upon a relatively low DCOOD exposure ofεDCOOD= 4× 10⁻³L on clean Pd(111); m/z = 2 desorption channel from a blank (control) TPD experiment on a freshly cleaned Pd(111) surface in the absence of any intentionally introduced adsorbates; variation of the Mn 2p3/2/Pd 3d integrated XPS intensity ratio of MnOx/Pd(111) as a function of Mn
deposition time; D2(m/z = 4) desorption channel in the TPD data upon three successive FA adsorption steps on MnOx/Pd(111) with varying MnOx surface coverages; variation of the D2(m/z = 4) desorption channel in the
TPD data upon three successive DCOOD adsorption steps on MnOx(0.25 ML)/Pd(111); change of the D2
(m/z = 4) desorption signal in the TPD data upon two successive FA exposures ofεDCOOD= 8× 10⁻³L on a
MnOx(1.5 ML)/Pd(111) surface which was initially
annealed in UHV at 1000 K for 1 min before thefirst TPD run; TPD profiles for DCOOD adsorption on MnOx(15 ML)/Pd(111), where a very thick
(multi-layer) MnOx overlayer entirely covers/blocks the
Pd(111) substrate; TPD profiles for DCOOD adsorp-tion on MnOx/Pd(111) as a function of MnOx
coverage; integration temperature intervals of the histograms given in Figure 4 of the main text; and integration temperature intervals of the histograms given inFigure 5e (PDF)
■
AUTHOR INFORMATIONCorresponding Author
Emrah Ozensoy − Department of Chemistry and UNAM-National Nanotechnology Center, Bilkent University, 06800 Ankara, Turkey; orcid.org/0000-0003-4352-3824; Email:[email protected]
Authors
Bartu Karakurt − Department of Chemistry, Bilkent University, 06800 Ankara, Turkey
Yusuf Kocak − Department of Chemistry, Bilkent University, 06800 Ankara, Turkey; orcid.org/0000-0003-4511-1321
Igor Lyubinetsky − Department of Chemistry, Bilkent University, 06800 Ankara, Turkey
Complete contact information is available at:
https://pubs.acs.org/10.1021/acs.jpcc.0c06942
Notes
The authors declare no competingfinancial interest.
■
ACKNOWLEDGMENTSE.O. acknowledges the scientific collaboration with the TARLA project funded by the Ministry of Development of Turkey (project code: DPT2006K-120470). The authors also acknowledge Prof. Mehmet Erbudak (ETH Zurich) for his invaluable assistance with the UHV experimental setup. I.L. acknowledges The Scientific and Technological Research Council of Turkey (TUBITAK) and Horizon 2020 Marie Sklodowska-Curie CoCirculation2 Program for financial support (project code: 119C014). E.O. acknowledges the scientific collaboration with the TARLA project funded by the Republic of Turkey Presidential Directorate of Strategy and Budget (project code: 2006K12-827). The authors also acknowledge Mete Duman (UNAM-National Nanotechnology Center, Bilkent, Ankara, Turkey) for the design and production of the technical schematics.
■
REFERENCES(1) Eppinger, J.; Huang, K.-W. Formic Acid as a Hydrogen Energy Carrier. ACS Energy Lett. 2017, 2, 188−195.
(2) Allsopp, M. W.; Vianello, G. Poly(Vinyl Chloride). Ullmann’s Encyclopedia of Industrial Chemistry; Wiley-VCH Verlag GmbH, 2000. (3) Moret, S.; Dyson, P. J.; Laurenczy, G. Direct Synthesis of Formic Acid from Carbon Dioxide by Hydrogenation in Acidic Media. Nat. Commun. 2014, 5, 4017.
(4) Ikemiya, N.; Natsui, K.; Nakata, K.; Einaga, Y. Long-Term Continuous Conversion of CO2 to Formic Acid Using Boron-Doped Diamond Electrodes. ACS Sustainable Chem. Eng. 2018, 6, 8108− 8112.
(5) Valentini, F.; Kozell, V.; Petrucci, C.; Marrocchi, A.; Gu, Y.; Gelman, D.; Vaccaro, L. Formic Acid, a Biomass-Derived Source of Energy and Hydrogen for Biomass Upgrading. Energy Environ. Sci. 2019, 12, 2646−2664.
(6) Brieger, G.; Nestrick, T. J. Catalytic Transfer Hydrogenation. Chem. Rev. 1974, 74, 567−580.
(7) Zhang, D.; Ye, F.; Xue, T.; Guan, Y.; Wang, Y. M. Transfer Hydrogenation of Phenol on Supported Pd Catalysts Using Formic Acid as an Alternative Hydrogen Source. Catal. Today 2014, 234, 133−138.
(8) Karakurt, B.; Kocak, Y.; Ozensoy, E. Enhancement of Formic Acid Dehydrogenation Selectivity of Pd(111) Single Crystal Model Catalyst Surface via Brønsted Bases. J. Phys. Chem. C 2019, 123, 28777−28788.
(9) Davis, J. L.; Barteau, M. A. Reactions of carboxylic acids on the Pd(111)-(2× 2)O surface: multiple roles of surface oxygen atoms. Surf. Sci. 1991, 256, 50−66.
(10) Kovács, I.; Kiss, J.; Solymosi, F. On the Role of Adsorbed Formate in the Oxidation of C1 Species on Clean and Modified Pd (100) Surfaces. Vacuum 2017, 138, 152−156.
(11) Solymosi, F.; Kovács, I. Adsorption and reaction of HCOOH on K-promoted Pd(100) surfaces. Surf. Sci. 1991, 259, 95−108.
(12) Jorgensen, S. W.; Madix, R. J. Active oxygen on Group VIII metals: activation of formic acid and formaldehyde on Pd(100). J. Am. Chem. Soc. 1988, 110, 397−400.
(13) Houtman, C.; Barteau, M. A. Reactions of formic acid and formaldehyde on Rh(111) and Rh(111)-(2× 2)O surfaces. Surf. Sci. 1991, 248, 57−76.
(14) Solymosi, F.; Kiss, J.; Kovacs, I. Adsorption and Decomposition of Formic Acid on Potassium-Promoted Rhodium(111) Surfaces. J. Phys. Chem. 1988, 92, 796−803.
(15) Solymosi, F.; Kiss, J.; Kovács, I. Adsorption of HCOOH on Rh(111) and its reaction with preadsorbed oxygen. Surf. Sci. 1987, 192, 47−65.
(16) Avery, N. R.; Toby, B. H.; Anton, A. B.; Weinberg, W. H. Decomposition of formic acid on Ru(001): An eels search for a formic anhydride intermediate. Surf. Sci. 1982, 122, L574−L578.
(17) Sun, Y. K.; Weinberg, W. H. Catalytic decomposition of formic acid on Ru(001): Transient measurements. J. Chem. Phys. 1991, 94, 4587−4599.
(18) Avery, N. R. Adsorption of formic acid on clean and oxygen covered Pt(111). Appl. Surf. Sci. 1982, 11−12, 774−783.
(19) Columbia, M. R.; Thiel, P. A. The reaction of formic acid with clean and water-covered Pt(111). Surf. Sci. 1990, 235, 53−59.
(20) Silbaugh, T. L.; Karp, E. M.; Campbell, C. T. Energetics of Formic Acid Conversion to Adsorbed Formates on Pt(111) by Transient Calorimetry. J. Am. Chem. Soc. 2014, 136, 3964−3971.
(21) Bowker, M.; Rowbotham, E.; Leibsle, F. M.; Haq, S. The Adsorption and Decomposition of Formic Acid on Cu {110}. Surf. Sci. 1996, 349, 97−110.
(22) Yao, Y.; Zaera, F. Adsorption and thermal chemistry of formic acid on clean and oxygen-predosed Cu(110) single-crystal surfaces revisited. Surf. Sci. 2016, 646, 37−44.
(23) Ying, D.; Robert, J. M. Thermal desorption study of formic acid decomposition on a clean Cu(110) surface. J. Catal. 1980, 61, 48−56. (24) Sims, J. J.; Ould Hamou, C. A.; Réocreux, R.; Michel, C.; Giorgi, J. B. Adsorption and Decomposition of Formic Acid on Cobalt(0001). J. Phys. Chem. C 2018, 122, 20279−20288.
(25) Barteau, M. A.; Bowker, M.; Madix, R. J. Acid-base reactions on solid surfaces: The reactions of HCOOH, H2CO, and HCOOCH3 with oxygen on Ag(110). Surf. Sci. 1980, 94, 303−322.
(26) Karatok, M.; Duanmu, K.; O’Connor, C. R.; Boscoboinik, J. A.; Sautet, P.; Madix, R. J.; Friend, C. Tuning Reactivity Layer-by-Layer: Formic Acid Activation on Ag/Pd(111). Chem. Sci. 2020, 11, 6492− 6499.
(27) Yu, W.-Y.; Mullen, G. M.; Flaherty, D. W.; Mullins, C. B. Selective Hydrogen Production from Formic Acid Decomposition on Pd−Au Bimetallic Surfaces. J. Am. Chem. Soc. 2014, 136, 11070− 11078.
(28) Shustorovich, E.; Bell, A. T. An Analysis of Formic Acid Decomposition on Metal Surfaces by the Bond-Order-Conservation-Morse-Potential Approach. Surf. Sci. 1989, 222, 371−382.
(29) Choi, B.-S.; Song, J.; Song, M.; Goo, B. S.; Lee, Y. W.; Kim, Y.; Yang, H.; Han, S. W. Core−Shell Engineering of Pd−Ag Bimetallic Catalysts for Efficient Hydrogen Production from Formic Acid Decomposition. ACS Catal. 2018, 9, 819−826.
(30) Bi, Q.-Y.; Lin, J.-D.; Liu, Y.-M.; He, H.-Y.; Huang, F.-Q.; Cao, Y. Dehydrogenation of Formic Acid at Room Temperature: Boosting Palladium Nanoparticle Efficiency by Coupling with Pyridinic-Nitrogen-Doped Carbon. Angew. Chem., Int. Ed. 2016, 55, 11849− 11853.
(31) Jiang, Y.; Fan, X.; Chen, M.; Xiao, X.; Zhang, Y.; Wang, C.; Chen, L. AuPd Nanoparticles Anchored on Nitrogen-Decorated Carbon Nanosheets with Highly Efficient and Selective Catalysis for the Dehydrogenation of Formic Acid. J. Phys. Chem. C 2018, 122, 4792−4801.
(32) Bulut, A.; Yurderi, M.; Karatas, Y.; Zahmakiran, M.; Kivrak, H.; Gulcan, M.; Kaya, M. Pd-MnO nanoparticles dispersed on amine-grafted silica: Highly efficient nanocatalyst for hydrogen production from additive-free dehydrogenation of formic acid under mild conditions. Appl. Catal., B 2015, 164, 324−333.
(33) Silverman, R. B.; Holladay, M. W. The Organic Chemistry of Drug Design and Drug Action; Academic Press, 2014.
(34) Yadav, M.; Akita, T.; Tsumori, N.; Xu, Q. Strong metal-molecular support interaction (SMMSI): Amine-functionalized gold nanoparticles encapsulated in silica nanospheres highly active for catalytic decomposition of formic acid. J. Mater. Chem. 2012, 22, 12582−12586.
(35) Mori, K.; Dojo, M.; Yamashita, H. Pd and Pd−Ag
Nanoparticles within a Macroreticular Basic Resin: An Efficient Catalyst for Hydrogen Production from Formic Acid Decomposition. ACS Catal. 2013, 3, 1114−1119.
(36) Bulut, A.; Yurderi, M.; Karatas, Y.; Say, Z.; Kivrak, H.; Kaya, M.; Gulcan, M.; Ozensoy, E.; Zahmakiran, M. MnOx-Promoted PdAg Alloy Nanoparticles for the Additive-Free Dehydrogenation of Formic Acid at Room Temperature. ACS Catal. 2015, 5, 6099−6110.
(37) Sridhar, M.; Van Bokhoven, J. A.; Kröcher, O. Effect of ammonia on the decomposition of ammonium formate over Au/ TiO2 under oxidizing conditions relevant to SCR: Enhancement of formic acid decomposition rate and CO2 production. Appl. Catal., A 2014, 486, 219−229.
(38) McBride, F.; Omer, A.; Clay, C. M.; Cummings, L.; Darling, G. R.; Hodgson, A. Strain relief and disorder in commensurate water layers formed on Pd(111). J. Phys.: Condens. Matter 2012, 24, 124102. (39) Scaranto, J.; Mavrikakis, M. Density functional theory studies of HCOOH decomposition on Pd(111). Surf. Sci. 2016, 650, 111−120. (40) Wang, Y.; Qi, Y.; Zhang, D.; Liu, C. New Insight into the Decomposition Mechanism of Formic Acid on Pd(111): Competing Formation of CO2 and CO. J. Phys. Chem. C 2014, 118, 2067−2076. (41) Zheng, T.; Stacchiola, D.; Saldin, D. K.; James, J.; Sholl, D. S.; Tysoe, W. T. The structure of formate species on Pd(111) calculated by density functional theory and determined using low energy electron diffraction. Surf. Sci. 2005, 574, 166−174.
(42) Kiskinova, M. P.; Bliznakov, G. M. Adsorption and coadsorption of carbon monoxide and hydrogen on Pd(111). Surf. Sci. 1982, 123, 61−76.
(43) Erley, W.; Wagner, H. Absolute Co Coverage: Direct Comparison between the (111) and (110) Faces of Ni, Pd, and Pt at 300 K. J. Chem. Phys. 1980, 72, 2207−2208.
(44) Ozensoy, E.; Meier, D. C.; Goodman, D. W. Polarization Modulation Infrared Reflection Absorption Spectroscopy at Elevated Pressures: CO Adsorption on Pd(111) at Atmospheric Pressures. J. Phys. Chem. B 2002, 106, 9367−9371.
(45) Ozensoy, E.; Min, B. K.; Santra, A. K.; Goodman, D. W. Co Dissociation at Elevated Pressures on Supported Pd Nanoclusters. J. Phys. Chem. B 2004, 108, 4351−4357.
(46) Ozensoy, E.; Wayne Goodman, D. Vibrational spectroscopic studies on CO adsorption, NO adsorption CO + NO reaction on Pd model catalysts. Phys. Chem. Chem. Phys. 2004, 6, 3765−3778.
(47) Thompson, A. C.; Vaughan, D. X-ray Data Booklet; Lawrence Berkeley National Laboratory, University of California Berkeley: CA, 2001; Vol. 8.
(48) Moulder, J. F. Handbook of X-ray Photoelectron Spectroscopy; Physical Electronics, 1995; pp 230−232.
(49) Mandale, A. B.; Badrinarayanan, S. X-ray photoelectron spectroscopic studies of the semimagnetic semiconductor system Pb1−xMnxTe. J. Electron Spectrosc. Relat. Phenom. 1990, 53, 87−95.
(50) Hsin-Kuei, H.; Rabalais, J. W. Chemisorption and the Initial Stage of Oxidation on Mn. Surf. Sci. 1981, 107, 376−390.
(51) Jenks, C. J.; Chang, S.-L.; Anderegg, J. W.; Thiel, P. A.; Lynch, D. W. Photoelectron spectra of an Al70Pd21Mn9quasicrystal and the
cubic alloyAl60Pd25Mn15. Phys. Rev. B: Condens. Matter Mater. Phys.
1996, 54, 6301.
(52) Sandell, A.; Jaworowski, A. J. The Mn 2p core-level photoelectron spectrum of Pd−Mn bimetallic systems on Pd(100). J. Electron Spectrosc. Relat. Phenom. 2004, 135, 7−14.
(53) Rader, O.; Mizokawa, T.; Fujimori, A.; Kimura, A. Structure and Electron Correlation of Mn on Ni (110). Phys. Rev. B: Condens. Matter Mater. Phys. 2001, 64, 165414.
(54) Rader, O.; Vescovo, E.; Wuttig, M.; Sarma, D. D.; Blügel, S.; Himpsel, F. J.; Kimura, A.; An, K. S.; Mizokawa, T.; Fujimori, A.; Carbone, C. Correlation Satellite Driven by Reduced Dimensionality. Europhys. Lett. 1997, 39, 429.
(55) Schieffer, P.; Krembel, C.; Hanf, M.-C.; Gewinner, G. Strong correlation satellites in core level photoemission from Mn in the monolayer range on Ag(001). J. Electron Spectrosc. Relat. Phenom. 1999, 104, 127−134.
(56) Li, F.; Parteder, G.; Allegretti, F.; Franchini, C.; Podloucky, R.; Surnev, S.; Netzer, F. P. Two-dimensional manganese oxide nanolayers on Pd(100): the surface phase diagram. J. Phys.: Condens. Matter 2009, 21, 134008.
(57) Oku, M.; Hirokawa, K.; Ikeda, S. X-ray photoelectron spectroscopy of manganese−oxygen systems. J. Electron Spectrosc. Relat. Phenom. 1975, 7, 465−473.
(58) Di Castro, V.; Polzonetti, G. XPS Study of MnO Oxidation. J. Electron Spectrosc. Relat. Phenom. 1989, 48, 117−123.
(59) Foord, J. S.; Jackman, R. B.; Allen, G. C. An X-Ray Photoelectron Spectroscopic Investigation of the Oxidation of Manganese. Philos. Mag. A 1984, 49, 657−663.
(60) Strohmeier, B. R.; Hercules, D. M. Surface Spectroscopic Characterization of Manganese/Aluminum Oxide Catalysts. J. Phys. Chem. 1984, 88, 4922−4929.
(61) Aoki, A. X-ray Photoelectron Spectroscopic Studies on ZnS: MnF2Phosphors. Jpn. J. Appl. Phys. 1976, 15, 305.
(62) Biesinger, M. C.; Payne, B. P.; Grosvenor, A. P.; Lau, L. W. M.; Gerson, A. R.; Smart, R. S. C. Resolving Surface Chemical States in XPS Analysis of First Row Transition Metals, Oxides and Hydroxides: Cr, Mn, Fe, Co and Ni. Appl. Surf. Sci. 2011, 257, 2717−2730.
(63) Zeng, F.; Pan, Y.; Yang, Y.; Li, Q.; Li, G.; Hou, Z.; Gu, G. Facile Construction of Mn3O4-MnO2 Hetero-Nanorods/Graphene Nano-composite for Highly Sensitive Electrochemical Detection of Hydrogen Peroxide. Electrochim. Acta 2016, 196, 587−596.
(64) Nilekar, A. U.; Greeley, J.; Mavrikakis, M. A Simple Rule of Thumb for Diffusion on Transition-Metal Surfaces. Angew. Chem., Int. Ed. 2006, 45, 7046−7049.
(65) Kovács, I.; Kiss, J.; Kónya, Z. The Potassium-Induced Decomposition Pathway of HCOOH on Rh(111). Catalysts 2020, 10, 675.