ISTANBUL BILGI UNIVERSITY INSTITUTE OF GRADUATE PROGRAMS
INTERNATIONAL FINANCE MASTER’S DEGREE PROGRAM
COMPARING INTELLECTUAL CAPITAL EFFICIENCY OF INTERNATIONAL FINANCIAL INSTITUTIONS
Deniz Tan CELASUN 117664009
Prof. Dr. Cenktan ÖZYILDIRIM
ISTANBUL 2020
Comparing Intellectual Capital Efficiency of International Financial Institutions
Uluslararası Finansal Kuruluşların Entelektüel Sermaye Verimliliklerinin Karşılaştırılması
Deniz Tan CELASUN 117664009
Tez Danışmanı: Prof. Dr. Cenktan ÖZYILDIRIM ... İstanbul Bilgi Üniversitesi
Jüri Üyesi: Dr. Öğr. Üyesi Ebru REİS ... İstanbul Bilgi Üniversitesi
Jüri Üyesi: Prof. Dr. Ömer ERZURUMLU ... Bahçeşehir Üniversitesi
Tezin Onaylandığı Tarih : /06/2020 Toplam Sayfa Sayısı: 50
Anahtar Kelimeler (Türkçe) Anahtar Kelimeler (İngilizce) 1) Entelektüel sermaye verimliliği 1) Intellectual capital efficiency 2) Entelektüel katma değer katsayısı 2) Value added intellectual coefficient 3) Uluslararası finansal kuruluşlar 3) International financial institutions
4) T-testi 4) T-test
ACKHOWLEDGEMENTS
First, I would like to thank my father Prof. Dr. Bülent Celasun, who tirelessly read many drafts and pointed me towards the right direction, and without his help and motivation, I simply would not be able to complete this study.
Furthermore, I would like to express my gratitude to my supervisor, Prof. Dr. Cenktan Özyıldırım for his lectures and invaluable assistance with this analysis. I would also like to thank all of the lecturers at Istanbul Bilgi University that I am privileged to be taught by.
Finally, I am extremely lucky to have studied at TOBB University of Economics and Technology during my undergraduate studies, which clearly contributed a lot to this study.
TABLE OF CONTENTS
ACKHOWLEDGEMENTS ... iii
LIST OF ABBREVIATIONS ... vii
LIST OF FIGURES ... x LIST OF TABLES ... xi ABSTRACT ... xii ÖZET ... xiii INTRODUCTION ... 1 CHAPTER I ... 3 1.1. LITERATURE REVIEW ... 3 CHAPTER II ... 7
2.1. DEFINITIONS AND METHODOLOGY ... 7
2.1.1. International Financial Institutions ... 7
2.1.1.2. Selected IFIs ... 8
2.1.1.3. Brief Background of the Selected IFIs ... 9
2.1.1.3.1 African Development Bank ... 9
2.1.1.3.2 Arab Bank for Economic Development in Africa ... 9
2.1.1.3.3 Asian Development Bank ... 10
2.1.1.3.4 Asian Infrastructure Investment Bank ... 10
2.1.1.3.5 Black Sea Trade and Development Bank ... 11
2.1.1.3.6 Caribbean Development Bank ... 11
2.1.1.3.7 Central American Bank for Economic Integration ... 11
2.1.1.3.8 Council of Europe Development Bank ... 12
2.1.1.3.10 East African Development Bank ... 13
2.1.1.3.11 Eurasian Development Bank ... 13
2.1.1.3.12 European Bank for Reconstruction and Development .... 13
2.1.1.3.13 European Investment Bank ... 14
2.1.1.3.14 Inter-American Development Bank ... 14
2.1.1.3.15 International Bank for Reconstruction and Development ... 15
2.1.1.3.16 International Finance Corporation ... 15
2.1.1.3.17 International Fund for Agricultural Development ... 15
2.1.1.3.18 International Investment Bank ... 16
2.1.1.3.19 Islamic Development Bank ... 16
2.1.1.3.20 New Development Bank ... 17
2.1.1.3.21 Nordic Investment Bank ... 17
2.1.1.3.22 OPEC Fund for International Development ... 18
2.1.1.3.23 West African Development Bank ... 18
2.1.2. Value Added Intellectual Coefficient (VAICTM) ... 19
CHAPTER III ... 22
3.1. DATA AND CALCULATIONS ... 22
3.1.1. VAICTM Calculations ... 24
3.1.2. Adjustments to the dataset ... 34
3.1.3. T-Test Application ... 35
3.1.4. ANOVA Application ... 36
3.1.5. Regression Application ... 37
CHAPTER IV ... 38
4.1.1. ANOVA Results ... 38 4.1.2. T-Test Results ... 39 4.1.3. Regression Results ... 42 CONCLUSION ... 44 REFERENCES ... 46 ANNEXES ... 50 1. List of Dependent and Independent Variables for Regression Analysis 50
LIST OF ABBREVIATIONS
ADB: Asian Development Bank AfDB: African Development Bank
AIIB: Asian Infrastructure Investment Bank
BADEA: Arab Bank for Economic Development in Africa BIST: Istanbul Stock Exchange
BOAD: West African Development Bank
BRICS: Brazil, Russia, India, China and South Africa BSTDB: Black Sea Trade and Development Bank BWO: Bretton Woods Organization
CABEI: Central American Bank for Economic Integration CAF: Development Bank of Latin America
CDB: Caribbean Development Bank
CEB: Council of Europe Development Bank CEE: Capital Employed Efficiency
COMECON: Council for Mutual Economic Assistance D&A: Depreciation and Amortisation
EADB: East African Development Bank
EBRD: European Bank for Reconstruction and Development EC: Employee Cost
EDB: Eurasian Development Bank EIB: European Investment Bank
EU: European Union
FDI: Foreign Direct Investment HC: Human Capital
HCE: Human Capital Efficiency HCE: Human Capital Efficiency
IADB: Inter-American Development Bank
IBRD: International Bank for Reconstruction and Development ICE: Intellectual Capital Efficiency
IFAD: International Fund for Agricultural Development IFC: International Finance Corporation
IFI: International Financial Institution IIB: International Investment Bank IMF: International Monetary Fund IsDB: Islamic Development Bank ITO: International Trade Organization NDB: New Development Bank
NFG: Nordic Finance Group NIB: Nordic Investment Bank
OFID: OPEC Fund for International Development OIC: Organisation of Islamic Cooperation
OP: Operating Profit
ROA: Return on Assets SC: Structural Capital
SCE: Structural Capital Efficiency UN: United Nations
USA: United States of America
USSR: Union of Soviet Socialist Republics VA: Value Added
VAICTM: Value Added Intellectual Coefficient
WB: World Bank
WBG: World Bank Group WTO: World Trade Organization
LIST OF FIGURES
Figure 1 VAICTM Model Breakdown 1 ... 19
Figure 2 VAICTM Model Breakdown 2 ... 19
Figure 3 Value Added in Ante Pulic’s VAICTM Model - 1 ... 20
Figure 4 Value Added in Ante Pulic’s VAICTM Model - 2 ... 20
Figure 5 VAICTM Model Breakdown 3 ... 21
Figure 6 Ante Pulic’s VAICTM Model (2004) ... 21
Figure 7 Capital Employed Formulation for Corporates ... 24
Figure 8 VAICTM Observations – 3-Years Average (23 Observations) ... 32
Figure 9 VAICTM Observations – Complete Dataset (69 Observations) ... 32
Figure 10 Adjustment to Enlarge Dataset ... 34
LIST OF TABLES
Table 1 - Selected IFIs ... 8
Table 2 – Years of Data Used ... 22
Table 3 – Data Used for Year 1 (millions) ... 23
Table 4 – Calculated NOPAT (millions) ... 25
Table 5 – Calculated VA (millions) ... 26
Table 6 – Capital Employed Efficiency (CEE) ... 27
Table 7 – Observed CEE Statistics ... 28
Table 8 – Human Capital Efficiency (HCE) ... 28
Table 9 – Observed HCE Statistics ... 29
Table 10 – Structural Capital Efficiency (SCE) ... 30
Table 11 – Observed SCE Statistics ... 31
Table 12 – Observed VAICTM Statistics ... 31
Table 13 – VAICTM Observations ... 33
Table 14 – Complete Dataset for Statistical Testing ... 35
Table 15 – Levene Test Results ... 38
Table 16 – ANOVA Results for Group A, Group B and Group C ... 39
Table 17 – T-Test Results for Group A vs. Group B ... 40
Table 18 – T-Test Results for Group B vs. Group C ... 41
Table 19 – T-Test Results for Group A vs. Group C ... 42
ABSTRACT
Comparing Intellectual Capital Efficiency of International Financial Institutions
The “basic economic problem” of satisfying infinite needs with finite resources requires efficiency by its nature. Although international financial institutions (IFIs) are exempt from national taxes in most cases, they are not exempt from the basic economic problem. Hence, their efficiency requires attention. Measuring the efficiency of tangible assets (such as invested capital, owned lands etc.) has been done using specific ratios and analyses for many years. However, the efficiency of intangible assets (such as knowledge, institutional culture etc.) is more difficult to measure and its importance has been growing significantly in the recent years. This study analyses the relationship between IFIs’ shareholder diversity and their intellectual capital efficiencies (ICE) based on Value Added Intellectual Coefficient (VAICTM) calculations. In the analysis, for the sake of simplicity, number of shareholders represents diversity. All of the 23 currently operational IFIs, which were separated into three groups based on their number of shareholders, were included in the analysis and for each of them VAICTM was calculated for the past three years, resulting in a dataset of 69 observations. This dataset was analysed using ANOVA (for three groups together) and T-tests (for each pair of groups). The results of the ANOVA and T-tests showed that groups’ means are different from each other; hence, the ICE was found to be related with the number of members. Furthermore, the VAICTM observations indicate a negative correlation between intellectual capital efficiency and diversity. This admittedly unexpected result invites a closer look at the notion of diversity and intellectual capital as assessed by VAICTM.
Key words: Intellectual capital efficiency, value added intellectual coefficient, International financial institutions, T-test, ANOVA.
ÖZET
Uluslararası Finansal Kuruluşların Entelektüel Sermaye Verimliliklerinin Karşılaştırılması
Sınırlı kaynaklarla sınırsız ihtiyaçların karşılanması gerçeğinden doğan “temel ekonomi sorunsalı”, verimliliği gerekli kılar. Uluslararası finansal kuruluşlar (UFK), her ne kadar milli vergilerden muaf olsalar da, temel ekonomi sorunsalından muaf değillerdir. Bu nedenle UFK’lerin de verimliliğine bakılmalıdır. Somut varlıkların (yatırılan sermaye, sahip olunan taşınmazlar vb.) verimliliğinin ölçülmesi yıllardır belli rasyolar ve incelemeler ile yapılmaktadır. Öte yandan, soyut varlıkların (bilgi birikimi, kurum kültürü vb.) verimliliğinin ölçülmesi daha zordur ve bunlar son yıllarda daha fazla önem kazanmıştır.
Bu çalışma UFK’lerin ortaklık yapılarındaki çeşitlilik ile entelektüel sermaye verimlilikleri (ESV) arasındaki ilişkiyi, entelektüel katma değer katsayısı (EKDK) hesaplamalarını kullanarak incelemektedir. Sadelik amacıyla, çeşitlilik UFK’lerin üye sayıları ile sınırlı tutulmuştur. Çalışmanın yapıldığı tarihte işlevsel olan 23 UFK’nin tamamı, üye sayılarına göre üç gruba ayrılarak, incelemeye konu edilmiş; her bir UFK’nin son üç yıl için EKDK’leri hesaplanmış ve 69 gözlemden oluşan bir veri seti elde edilmiştir. Bu veri seti ANOVA (üç grup için birlikte) ve T-testi (her bir ikili grup için ayrı ayrı) kullanılarak incelenmiştir.
ANOVA ve T-testi sonuçları grupların ortalamalarının birbirlerinden farklı olduğunu göstermiş ve ESV ile üye sayısının ilişkili bulunmuştur. Ayrıca EKDK gözlemleri, entelektüel sermaye verimliliği ile çeşitlilik arasında ters ilinti olduğunu ortaya koymuştur. Bu gerçekten beklenmedik sonuç, çeşitlilik ve EKDK ile ölçülen entelektüel sermaye kavramlarının daha yakından incelenmesini gerektirmektedir. Anahtar Kelimeler: Entelektüel sermaye verimliliği, entelektüel katma değer katsayısı, uluslararası finansal kuruluşlar, T-testi, ANOVA.
INTRODUCTION
While the first institutional international organizations date back to the 19th century (i.e. International Telegraphic Union, 1865), the emergence of international financial institutions (IFIs) is relatively new. After the World War II, the victorious allies established – what is known as – the Bretton Woods Institutions. Led by the United States of America (USA), 43 countries formed the World Bank (WB) and the International Monetary Fund (IMF) in order to i) finance redevelopment of the war torn world and ii) promote international economic integration (Ray, 1998). Over the decades, various IFIs, based on different political agendas and overlapping geographical coverage have been established in different parts of the World with certain member countries. Driven by the core, limited sources principle of economy
(Colander, 2008), countries are obliged to assess the effectiveness (or efficiency) of the capital that they invest in these IFIs. This pressing need drew much academic attention, which resulted in a large number of studies.
Searching for the driving forces of efficiency, scholars around the World examined what is called the “invested capital” (combined value of equity and debt capital raised) and then they argued that the nominal financial capital cannot be the only component, as there was also human (or intellectual) capital. Broadly corresponding to the sum of the experience and skills that the employees have, the human capital poses an economic value and it is an off-balance sheet intangible asset.
Although the term diversity as we use it today made its first appearance in 1978 in a US Supreme Court decision (Unversity of California Regents v. Bakke, 1978), it became popular only in 1990s and emerged as a widely accepted value of contemporary liberalism. Since then many academic studies showed that institutions benefit from a diverse employee base, which enriches their human capital. In this study, for the sake of simplicity, diversity is treated as a numeric measure; meaning IFIs with a larger number of members assumed to be more diverse compared to the rest.
In this context, this study aims to explore possible relations between human capital and financial performance of IFIs. For this purpose, all of the currently operational 23 IFIs with different shareholder structures and mandates were analysed. As an index for comparison, Pulic’s Value Added Intellectual Coefficient (VAICTM) model is utilized and a T-test is conducted in order to demonstrate correlation. Although challenged by some recent studies (Ståhle, Aho, & Ståhle, 2011), the VAICTM model has been widely used for measuring intellectual/human capital efficiency and this paper only aims to benefit from it as an index that allows comparison rather than considering it a measuring model.
The results of the ANOVA and T-tests and Regression analysis show that the hypothesis of this study, that the IFIs with a more diverse background perform better and they should have a higher VAICTM, is wrong. The statistical methods indicates a negative correlation between the number of IFIs’ members and their intellectual capital efficiency.
CHAPTER I
1.1. LITERATURE REVIEW
In general, efficiency is defined as “achieving a goal as cheaply as possible” and most of the time this is linked with Adam Smith’s Invisible Hand Theory (Colander,
2008). Unsurprisingly, financial institutions’ efficiency has been a discussion topic
for academia (Harker & Zenios, 2000), (Berger, Hunter, & Timme, 1993) mainly due to their direct effect on economic growth and their importance as key parties for a functioning financial system. As economic liberalisation increases competition in financial markets, efficiency becomes an increasingly more important subject for financial institutions (Denizer, Dinc, & Tarimcilar, 2000). The efficiency of international financial institutions (IFIs) needs to be analysed systematically since by definition IFIs are institutions that have more than one founder counterparty, which necessitates mediating between financial return and political agendas. Under this perspective, the efficiency of IFIs requires greater emphasis due to their wider reach and multinational capital structure.
In their study, Berger, Hunter and Timme analysed the efficiency of banks with various asset sizes using scale and scope efficiency methods. They have found that the academia has failed to keep pace with the rapidly evolving environment of financial institutions let alone measuring their efficiencies properly (Berger, Hunter, & Timme, 1993).
Harker and Zenios studied on the driving forces behind FIs’ efficiency in their study “Performance of Financial Institutions” and they argued that as one of the most significant sectors in the contemporary economics, the performance analysis of financial services is indeed a subject of great importance, which requires more than classical scale and scope efficiency analyses. Harker and Zenios add other factors such as innovation and technology, and management of human resources as measures of efficiency (Harker & Zenios, 2000).
In 1996, the OECD defined the contemporary economic structure as “knowledge economy” in which knowledge (with its utilisation, production and distribution) is the main driving force behind growth, employment and wealth creation in all sectors. Furthermore, a World Bank study in 1998 emphasised the significance of intellectual ability and knowledge for national and global economic advancement. Subsequently, the academia followed OECD’s and World Bank’s lead and a large number of studies on intellectual capital and intellectual capital efficiency (ICE) were published. Moreover, an internationally renowned journal1, Journal of Intellectual Capital made its debut in 2000 become a central source for IC studies. Although there are many studies on analysis of financial institutions’ efficiency, ICE as a significant contributor to operational efficiency has not been analysed in detail.
A large number of post-millennium studies on ICE suggest that, as a component of overall institutional efficiency, it has been gaining more importance for all companies as well as for IFIs. Given its intangible nature, intellectual capital is rather difficult to analyse, which makes studies on ICE even harder. Literature on ICE’s definition is rich (Mayo, 2001), (Lev, 2001), (Ahonen & Hussi, 2022), and a consensus on its components prevails. These are i) human capital (HC) and ii) structural capital (SC) (Petty & Guthrie, 2000), (Kujansivu, 2005)
The majority of the existing studies on ICE use Value Added Intellectual Coefficient (VAIC™), which was first suggested by Ante Pulic in 1993 (Pulic, Intellectual capital-does it create or destroy value?, 2004) as a method measuring the correlation between intellectual capital and efficiency of companies. Pulic further studied VAIC™ in his following researches (Pulic, Measuring the Performance of Intellectual Potential in Knowledge Economy, 1998), (Pulic, VAIC – an accounting tool for IC management, 2000).
1 Journal of Intellectual Capital is ranked in Australian Business Deans Council (ABDC) Quality
Journal List, The Publication Forum (Finland), VHB-JOURQUAL 3 (Germany), BFI (Denmark) and with its 2018 edition received an impact factor of 3,744 placing it in 1st quartile of both the
In their 2007 article, Nazari and Herremans acknowledged the wide usage of Pulic’s method as well as commenting on its limitations. In their study, -for real economy businesses- they proposed to extend structural capital by making additions based on Skandia Navigator2.
Although there are number of studies on financial institutions’ ICE, most of these focused on institutions in a certain geographical area (Ting & Lean, 2009), (Joshi, Cahill, & Sidhu, 2013), (Ozkan, Cakan, & Kayacan, 2017), while the present study aims to compare a selection of IFIs from around the world. Previous studies with a narrower geographical and institutional focus include:
i) Mohiuddin et al. analysing 17 Bangladeshi commercial banks’ ICE within a 2 years frame (Mohiuddin, Najibullah, & Shahid, 2006).
ii) A comparative study on ICE of domestic and foreign banks in India
(Kamath, 2010).
iii) A relationship analysis between ICE and financial returns of banks that are listed in Turkey’s Istanbul Stock Exchange (BIST) (Yalama, 2005). iv) A variable analysis by Magdi El-Bannany on British banks’ ICE
between 1995 and 2005, which stresses that usage of information technology systems have a significant in impact on ICE (El-Bannany, 2008).
v) Another study on Indian banks by Sharma and Mani showed that, between 2005 and 2010, in terms of human capital efficiency (HCE), public banks were out-performed by private banks (Sharma & Mani, 2012).
In a study published in the Journal of Intellectual Capital, (Joshi, Cahill, & Sidhu,
2013) analysed Australian financial sector’s intellectual capital performance using
VAICTM and concluded that investment companies had higher ICE compared to
2 The Skandia Navigator is a collection of measurements methods for intangibles, first suggested by
Leif Edvinsson at Skandia. The Navigator facilitates a holistic understanding of the organization and its value creation along 5 focus areas. These areas are; i) Financial focus, ii) Customer focus, iii) Process focus, iv) Renewal & Development focus and v) Human focus.
other financial institutions (i.e. insurance companies). The study also showed that higher VAICTM was not necessarily correlated with higher financial performance. Although VAIC™ is used widely in current studies; it has been criticized to present the correlation and have limits to present an adequate measurement and similar observation has been reported in some earlier studies (Firer & William, 2003),
(Mosavi, Nekoueizadeh, & Ghaedi, 2012), (Ståhle, Aho, & Ståhle, 2011). Likewise, a paper by (Paknezhad & Ahmadkhani, 2012) found that VAICTM failed to present a relationship between IC and financial return indicators such as return on assets (ROA).
Furthermore, there are several studies on expanding / improving VAICTM by introducing other variables that Pulic’s model discounts such as research and development expenses, advertising expenses etc. This study, although acknowledges present criticism, uses the original model proposed by Pulic to keep the results comparable with the most of the precedent studies that applied the model as it was.
CHAPTER II
2.1. DEFINITIONS AND METHODOLOGY
2.1.1. International Financial Institutions
In 1944, in a conference in Bretton Woods, New Hampshire, USA, three renowned experts (US Treasury Secretary Henry Morganthau, his lead economic advisor Harry Dexter White, and British economist John Maynard Keynes) shared their ideas on promoting international economic cooperation. As a result, the IMF and the WB, later known as the Bretton Woods Organisations (BWOs), were established. The original agreement included a third organisation, the International Trade Organisation (ITO), to promote and regulate international trade enabling economic growth for all (Baylis, Smith, & Owens, 2008). This only came into existence in 1995 in Geneva, Switzerland under the name of World Trade Organisation (WTO).
Over the decades, plenty of new IFIs have been established in different parts of the World with a variety of agendas. Their common goals can be summarised as follows:
i) Helping developing countries to attract foreign direct investment (FDI) ii) Mitigating political risks and stimulating capital flows (both public and
private) towards less developed countries/regions iii) Enhancing hosting country’s government’s credibility
iv) Promoting either sub-regional, regional or international economic integration
v) Providing much needed liquidity to distressed economies during difficult times
vi) Funding large infrastructural projects
vii) Promoting economic liberalisation (i.e. lowering barriers to trade, easing capital regulations)
2.1.1.2. Selected IFIs
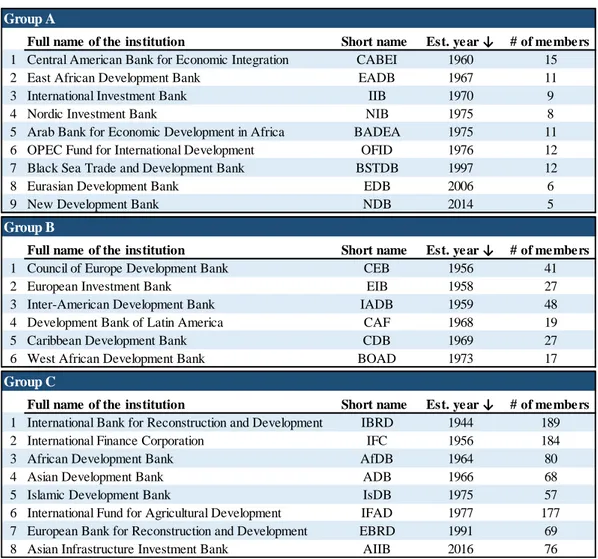
All of the currently operational 23 IFIs are included in this study and classified under three groups depending on their number of members; Group A) between 2 to 15 members, Group B) between 16 to 50 members and Group C) over 50 members. Table 1 below presents the Groups along with their full and –more commonly used– short names, year of establishment and latest number of members of the selected IFIs. While the majority of the members are sovereign countries, some of the selected IFIs also have institutional members (i.e. the EU is a member of the EBRD). The data collected and used in this study is available online, as all of these institutions publish their annual financial statements and activity reports.
Table 1 - Selected IFIs
Group A
Full name of the institution Short name Est. year ↓ # of members
1 Central American Bank for Economic Integration CABEI 1960 15
2 East African Development Bank EADB 1967 11
3 International Investment Bank IIB 1970 9
4 Nordic Investment Bank NIB 1975 8
5 Arab Bank for Economic Development in Africa BADEA 1975 11
6 OPEC Fund for International Development OFID 1976 12
7 Black Sea Trade and Development Bank BSTDB 1997 12
8 Eurasian Development Bank EDB 2006 6
9 New Development Bank NDB 2014 5
Group B
Full name of the institution Short name Est. year ↓ # of members
1 Council of Europe Development Bank CEB 1956 41
2 European Investment Bank EIB 1958 27
3 Inter-American Development Bank IADB 1959 48
4 Development Bank of Latin America CAF 1968 19
5 Caribbean Development Bank CDB 1969 27
6 West African Development Bank BOAD 1973 17
Group C
Full name of the institution Short name Est. year ↓ # of members
1 International Bank for Reconstruction and Development IBRD 1944 189
2 International Finance Corporation IFC 1956 184
3 African Development Bank AfDB 1964 80
4 Asian Development Bank ADB 1966 68
5 Islamic Development Bank IsDB 1975 57
6 International Fund for Agricultural Development IFAD 1977 177 7 European Bank for Reconstruction and Development EBRD 1991 69
2.1.1.3. Brief Background of the Selected IFIs
2.1.1.3.1 African Development Bank
After the end of colonial era in Africa, in 1963 African countries established the African Union. In the following year, member states founded the African Development Bank (AfDB) to promote sustainable economic development and social progress in its region in order to achieve poverty reduction. The AfDB operates along with the African Development Fund and Nigeria Trust Fund under the AfDB Group.
Based on 2018YE financial statements, bank’s total asset size stood at XUA 33.8 billion (c. EUR 27.1 billion) with and equity base of 21%.
Link to AfDB Homepage & Financial Statements
2.1.1.3.2 Arab Bank for Economic Development in Africa
Owned by the members of the Arab League, the Arab Bank for Economic Development in Africa (or Banque Arabe pour le Développement Economique en Afrique, BADEA) was established in 1974. Bank’s objectives include strengthening financial, economic and technical cooperation in Arabic regions in Africa by i) participating in financing economic development, ii) stimulating the contribution of Arabic capital to Africa’s development and iii) providing the necessary technical assistance.
According to audited 2018YE results, BADEA’s total asset size was USD 4.8 billion with an equity base of 98%. The bank has 11 members among which, Saudi Arabia, Kuwait and Iraq are the largest shareholders (26%, 16% and 15%, respectively.)
2.1.1.3.3 Asian Development Bank
Established in 1966, the Asian Development Bank (ADB) promotes sustainable development and prosperity in the Asia-Pacific region, which accounts for a large portion of the World’s underdeveloped countries. One of its prevailing goals is to eradicate extreme poverty through a number of tools such as direct investments, technical assistance and policy dialogue with the governments.
As of today, ADB has 68 member countries, 19 of which are from outside of its region. Based on the 2018 financial statements ADB’s total asset size was USD 191.9 billion with an equity base of 27%. Shareholders with largest shares are the USA (16%), Japan (16%) and China (6%).
Link to ADB Homepage & Financial Statements
2.1.1.3.4 Asian Infrastructure Investment Bank
Initially proposed in 2009 after the global financial crises by China to utilize its foreign currency reserves in a more efficient way, the Asian Infrastructure Investment Bank (AIIB) was founded in 2016. The AIIB focuses on large infrastructure projects in the Asia-Oceania region, which it views as a tool of regional integration and foreign policy. Similar to other IFIs, the AIIB also promotes long-term sustainable economic development.
As of today, the AIIB has 78 shareholders and 24 prospective members from all around the World. Based on the 2018 financial statements the bank’s total asset size was USD 19.6 billion with a very high equity base of 99%. China is the largest shareholder with 40% and followed by India (11%) and Russia (9%).
2.1.1.3.5 Black Sea Trade and Development Bank
Founded by 12 countries in the Black Sea region in 1997, the Black Sea Trade and Development Bank (BSTDB) primarily promotes regional trade. The BSTDB also aims to enhance regional cooperation through loans, equity investments and guarantees to both private and public sectors. Furthermore, the bank does not have an announced political criteria for its investments (i.e. other institutions such as EIB and EBRD requires commitment to democratic principles). The BSTDB also provides financing to SMEs and trade finance facilities, mainly to local financial institutions.
The BSTDB has 12 member countries. Based on the 2018 financial statements its total asset size was EUR 1.8 billion with an equity base of 44%.
Link to BSTDB Homepage & Financial Statements
2.1.1.3.6 Caribbean Development Bank
Initially established by Caribbean Common Wealth countries together with Canada and the UK in 1969, the Caribbean Development Bank (CDB) attracted more members. The CDB provides funding and technical assistance primarily under four themes: i) education, ii) agriculture, iii) disaster prevention and iv) water and sanitation.
As of today, CDB has 27 shareholders, 19 of which are borrowing members from its region. Based on the 2018 financial statements its total asset size was USD 1.7 billion with an equity base of 53%.
Link to CDB Homepage & Financial Statements
2.1.1.3.7 Central American Bank for Economic Integration
Founded by five Central American countries in 1960, the Central American Bank for Economic Integration (CABEI) provides funding to its members for reducing poverty and inequality and aims to foster regional integration. The CABEI also has
specific programs for environmental sustainability. Over the years, the bank received new members from overseas such as China, Spain and South Korea. As of today, CABEI has 15 shareholders countries. Based on the 2019 audited financial statements the bank’s total asset size was USD 11.6 billion with an equity base of 30%.
Link to CABEI Homepage & Financial Statements
2.1.1.3.8 Council of Europe Development Bank
Initially founded as a fund for refugees in order to tackle the difficulties of over-population in 1956, the bank took its current name the Council of Europe Development Bank (CEB) in 1999. Today CEB’s main goal is to promote social cohesion among its members by granting loans and participating in co-financing projects.
As of today, CEB has 41 member countries. Based on the 2018 financial statements its total asset size was EUR 24.3 billion with an equity base of 12%.
Link to CEB Homepage & Financial Statements
2.1.1.3.9 Development Bank of Latin America
Established as a development bank for the Latin America to ensure regional integration and sustainable development, the Development Bank for Latin America (or Corporación Andina de Fomento, CAF) provides funding and technical assistance for both private and public sectors in its region.
Currently, CAF has 19 member states and 13 private banks as shareholders. Based on the 2018 financial statements CAF’s total asset size was USD 40.0 billion with an equity base of 30%.
2.1.1.3.10 East African Development Bank
Founded in 1967 by a multilateral treaty signed between Kenya, Tanzania and Uganda, the East African Development Bank (EADB) was used to called East African Cooperation. In addition to its lending products, EADB also provides advisory services and conducts policy dialogue for development of capital and real estate markets in its regions.
As of today, EADB has four shareholding countries and nine institutional members. Based on the 2017 financial statements EADB’s total asset size was USD 0.4 billion with an equity base of 67%.
Link to EADB Homepage & Financial Statements
2.1.1.3.11 Eurasian Development Bank
Being one of the newest IFIs, the Eurasian Development Bank (EDB) was founded by Russia and Kazakhstan in 2006. While large infrastructural projects are the focus of EDB, it also provides technical assistance (i.e. energy efficiency, agricultural development), research, micro-finance and finance for small medium size enterprises (SMEs).
As of today, EDB has 6 shareholders. Based on the 2019 audited financial statements EDB’s total asset size was USD 5.2 billion with an equity base of 36%. Link to EDB Homepage & Financial Statements
2.1.1.3.12 European Bank for Reconstruction and Development
Following the dissolution of the Union of Soviet Socialist Republics (USSR), Western countries led by the USA established the European Bank for Reconstruction and Development (EBRD) in 1991. Initially focused on investing in the former USSR countries and the Eastern Bloc to promote market economy, over the years EBRD expanded its coverage to a wider geography.
As of today, EBRD has 69 shareholders (countries and other institutions). Based on the 2018 financial statements EBRD’s total asset size was EUR 61.9 billion with an equity base of 26%.
Link to EBRD Homepage & Financial Statements
2.1.1.3.13 European Investment Bank
As part of the Treaty of Rome, which established the European Economic Community processor of the European Union (EU), the European Investment Bank (EIB) was founded in 1958 to promote EU policies such as integration and social cohesion in war-torn Europe. Although majority of EIB’s investments are in the EU members, the bank also invests in other regions in the World with specific aims including private sector development and environmental sustainability.
All members of the EU are also members of the EIB, as of today it has 27 shareholders. Based on the 2018 financial statements EIB’s total asset size was EUR 604.6 billion with an equity base of 11%.
Link to EIB Homepage & Financial Statements
2.1.1.3.14 Inter-American Development Bank
Established in 1959, the Inter-American Development Bank (IADB) is one of the largest development bank operating in the region based on the amount of funding provided. Covering Latin America and Caribbean region, the IADB’s focus is on tackling social exclusion and inequality, low productivity and innovation and limited economic integration.
As of today, the IADB has 48 member countries. Based on the 2019 audited financial statements IADB’s total asset size was USD 136.4 billion with an equity base of 25%.
2.1.1.3.15 International Bank for Reconstruction and Development
As one of the earliest IFIs, which was founded at the Bretton Woods Conference in 1944, the International Bank for Reconstruction and Development (IBRD) is a part of the World Bank Group (WBG). The IBRD has a global coverage in terms of investments and only provides funding to sovereign governments and investment projects with sovereign guarantees. The bank has wide access to international capital markets, hence is able to offer funding in 27 different currencies.
IBRD being the largest IFI in terms of the number of shareholders, as of today it has 189 countries in its ownership. Based on the 2018 financial statements IBRD’s total asset size was USD 403.1 billion with an equity base of 10%.
Link to IBRD Homepage & Financial Statements
2.1.1.3.16 International Finance Corporation
As the private-sector wing of the WBG, the International Finance Corporation (IFC) was founded in 1956. In addition to financial investments, the IFC also provides advisory services and asset-management to the private sectors in developing countries. Working on a profit driven basis, IFC is aiming to reduce poverty and increase economic integration throughout the World.
As of today, IFC has 184 shareholders. Based on the 2018 financial statements IFC’s total asset size was USD 94.3 billion with an equity base of 28%.
Link to IFC Homepage & Financial Statements
2.1.1.3.17 International Fund for Agricultural Development
As an outcome of the World Food Conference that was held in 1974, the International Fund for Agricultural Development (IFAD) was founded in 1977 as a subsidiary of the United Nations (UN). IFAD’s main goal is to tackle poverty and hunger in World’s rural regions through loans, grants and technical assistance. The
IFAD also works on issues like climate change, gender inequality, indigenous peoples and access to water.
As of today, IFAD has 177 shareholder countries. Based on the 2018 financial statements IFAD’s total asset size was USD 9.0 billion with an equity base of 79%. Link to IFAD Homepage & Financial Statements
2.1.1.3.18 International Investment Bank
In 1970, the International Investment Bank (IIB) was founded by the Council for Mutual Economic Assistance (COMECON). COMECON was a multilateral financial development institution for the USSR, the Eastern Bloc and several other socialist states from different parts of the World and dissolved in 1991. The IIB’s institutional mission is to establish economic and social development and integration to increase prosperity in its regions focusing on SMEs.
Currently the IIB has nine shareholders. Based on the 2019 financial statements IIB’s total asset size was EUR 1.4 billion with an equity base of 30%.
Link to IIB Homepage & Financial Statements
2.1.1.3.19 Islamic Development Bank
Founded by the members of the Organisation of Islamic Cooperation (OIC) in 1975, the Islamic Development Bank (IsDB) focuses in economic development in its member countries with a focus on Islamic finance. The IsDB provides funding to both public and private sectors, technical assistance, promotes tools of Islamic finance (i.e. Sukuk similar private bonds) and conducts direct equity investments in Islamic financial institutions.
As of today, IsDB has 57 shareholder countries. Based on the 2018 financial statements IsDB’s total asset size was ID3 22.1 billion (c. USD 20.3 billion) with an equity base of 40%.
Link to IsDB Homepage & Financial Statements
2.1.1.3.20 New Development Bank
The newest IFI in the World, the New Development Bank (NDB) was founded in 2014 by Brazil, Russia, India, China and South Africa (BRICS states) and formerly referred as the BRICS Development Bank. The NDB provides loans, guarantees and equity investments to both public and private sectors.
NDB has five member countries (all of the BRICS countries). Based on the 2018 financial statements NDB’s total asset size was USD 10.4 billion with an equity base of 96%.
Link to NDB Homepage & Financial Statements
2.1.1.3.21 Nordic Investment Bank
Established in 1975 by five Nordic countries, the Nordic Investment Bank (NIB) is a part of the Nordic Finance Group (NFG), which has two other funds and another risk capital institution in it. The NIB’s product portfolio includes loans, guarantees for projects in energy, infrastructure and financial institutions sectors. The bank provides its services to both public and private sectors in its region.
With three Baltic countries joined in 2005, as of today NIB has 8 shareholding countries. Based on the 2019 audited financial statements NIB’s total asset size was EUR 32.7 billion with an equity base of 11%.
Link to NIB Homepage & Financial Statements
2.1.1.3.22 OPEC Fund for International Development
In 1976, the members of the Organization of the Petroleum Exporting Countries (OPEC) founded the OPEC Fund for International Development (OFID). The fund aims to increase cooperation between OPEC members and developing countries through financial support to promote socioeconomic development. In addition to financial and advisory services, OFID also provides aids for food, research and humanitarian relief.
Following Qatar’s resignation from membership in early 2019, OFID currently has 12 shareholders. Based on the 2018 financial statements OFID’s total asset size was USD 7.4 billion with an equity base of 97%.
Link to OFID Homepage & Financial Statements
2.1.1.3.23 West African Development Bank
Founded in 1973, the West African Development Bank (or Banque Ouest Africaine de Développement, BOAD) is established by the Central Bank of West African States and its members. BOAD’s investments focus on three pillars, i) reduction of poverty, ii) economic integration and iii) private sector promotion. The bank also has direct lending programs for its member governments.
Currently BOAD has 8 African shareholding countries and 9 other members from around the World. Based on the 2017 financial statements BOAD’s total asset size was XOF 2,653.3 billion (c. USD 4.4 billion) with an equity base of 27%.
2.1.2. Value Added Intellectual Coefficient (VAICTM)
In the 2nd McMaster World Congress in 1998, Ante Pulic (an economics professor from Croatia) delivered a presentation on measuring intellectual potential performance, in which he argued that “business success depends… …on the ability
and efficiency of using company knowledge”. Pulic acknowledged other scholars’
works ( (Edvinsson, 1997), (Sveiby, 1997) and (Stewart, 1998)) in his presentation, he criticized their suggested methods to be subjective (Edvinsson himself wrote “…apply some subjective judgments”) and argued that intellectual capital efficiency can be measured with data from financial statements alone.
In 2004, Pulic developed his method further and proposed a simple formula for Value Added Intellectual Coefficient (VAICTM). According to Pulic, the two main parameters of VAICTM are Capital Employed Efficiency (CEE) and Intellectual Capital Efficiency (ICE).
Figure 1 VAICTM Model Breakdown 1
While CEE represents the performance of financial and physical capital usage; according Pulic, measuring the performance of non-physical and employee-related inputs, ICE, has two sub-components; i) Structural Capital Efficiency (SCE) and ii) Human Capital Efficiency (HCE).
Figure 2 VAICTM Model Breakdown 2
In Pulic’s model, value added (VA) is used as the key performance factor and it is either a numerator or denominator in all the three variables above. Pulic’s model identifies VA as a comparable indicator (similar to EBITDA4 in a sense), as
illustrated in Figure 1, VA is composed of: i) Net Operating Profit After Tax, ii) Human Capital (HC) and Depreciation and Amortisation (DA).
Figure 3 Value Added in Ante Pulic’s VAICTM Model - 1
NOPAT for financial institutions differ from corporates in several ways. For example while interest expense typically is not an operational expense for corporates, it is the main operational cost item for financial institutions most of the time.
Hence in this study, the below formula for financial institutions NOPAT calculation
(Fraker, 2006) is utilized, which adds-back net charge-offs to net income.
Furthermore, net charge-off consists of provisional expense and income.
Similar to other studies, Pulic also states that employee expenses are different from other expenses (i.e. electricity or rent) and they ought to be treated as an investment by nature representing the HC. According to the model, HC is corresponding to sum of the salary and other employee related expenses (i.e. trainings, awards).
The VAICTM model interprets the difference between VA and HC as the Structural Capital (SC), which corresponds to non-physical assets that are not related to employees (i.e. institutional culture, working environment/systems).
Figure 4 Value Added in Ante Pulic’s VAICTM Model - 2
In his model, Pulic further breaks down the equation in Figure 2 to the components of as following:
Figure 5 VAICTM Model Breakdown 3
Overall, Ante Pulic’s model has three components all of which are linked to VA. While the majority of the criticism that the model has faced has been about its claimed ability to measure IC (Ståhle, Aho, & Ståhle, 2011), the Model has also been contended for failing to provide meaningful data in cases where VA is negative
(Mehralian, Rasekh, Akhavan, & Sadeh, 2012).
Furthermore, a more recent study points out the interrelation between SC and HC (please see Figure 4 above). The fact that SC is a dependent variable of another component of the model has been considered a significant problem (Vishnu, 2015). Nonetheless, evidenced by the large number of articles reviewed, VAICTM still remains a valuable tool to measure IC objectively as it depends only on financial statements. Despite some valid criticisms and ongoing works to improve the model, for the purposes of comparing IFIs the model is considered efficient as is.
CHAPTER III
3.1. DATA AND CALCULATIONS
All of the selected IFIs, as part of their mandates, support transparency and publish their audited financial statements on their websites. The majority of them have not published the 2019 audit reports while this study was being conducted, a few of them did not even publish the 2018 audited results. Hence, the data used here is based on the latest available audit reports on respective websites. For each IFI, financial statements of three consecutive years have been analysed.
Table 2 – Years of Data Used
Group A
Full name of the institution Year 1 Year 2 Year 3
1 Central American Bank for Economic Integration 2017 2018 2019
2 East African Development Bank 2015 2016 2017
3 International Investment Bank 2017 2018 2019
4 Nordic Investment Bank 2017 2018 2019
5 Arab Bank for Economic Development in Africa 2016 2017 2018
6 OPEC Fund for International Development 2016 2017 2018
7 Black Sea Trade and Development Bank 2016 2017 2018
8 Eurasian Development Bank 2017 2018 2019
9 New Development Bank 2016 2017 2018
Group B
Full name of the institution Year 1 Year 2 Year 3
1 Council of Europe Development Bank 2016 2017 2018
2 European Investment Bank 2016 2017 2018
3 Inter-American Development Bank 2017 2018 2019
4 Development Bank of Latin America 2016 2017 2018
3 Caribbean Development Bank 2016 2017 2018
4 West African Development Bank 2015 2016 2017
Group C
Full name of the institution Year 1 Year 2 Year 3
1 International Bank for Reconstruction and Development 2016 2017 2018
2 International Finance Corporation 2016 2017 2018
3 African Development Bank 2016 2017 2018
4 Asian Development Bank 2016 2017 2018
5 Islamic Development Bank 2016 2017 2018
6 International Fund for Agricultural Development 2016 2017 2018 7 European Bank for Reconstruction and Development 2016 2017 2018
As VAICTM does not consider currency, calculation was based on data in reported currencies. While the majority of the IFIs report in hard currency, West African Development Bank reports in West African Franc (XOF), Islamic Development Bank uses Islamic Dinar (ID) and African Development Bank reports in a virtual currency Unit of Account (UA).
From the financial statements, the following figures were used for calculating VA and the other components of the model (figures presented in Table 3):
i) Net Income (NI), ii) Provisions,
iii) Employee costs (EC),
iv) Depreciation and amortization (DA), v) Capital employed (CE).
Table 3 – Data Used for Year 1 (millions)
Group A
Full name of the institution Cur. NI Provision EC DA CE
1 Central American Bank for Economic Integration USD 83.8 (97.4) 28.2 3.4 2,830.6 2 East African Development Bank USD 6.7 1.0 4.2 0.7 239.0 3 International Investment Bank EUR 1.0 12.1 18.9 1.0 395.7 4 Nordic Investment Bank EUR 211.0 5.4 43.2 1.7 3,456.3 5 Arab Bank for Economic Development in Africa USD 79.1 1.6 12.2 0.5 4,427.8 6 OPEC Fund for International Development USD 170.0 43.4 43.6 2.2 7,002.5 7 Black Sea Trade and Development Bank EUR 1.8 5.9 14.3 0.6 752.7 8 Eurasian Development Bank USD 41.7 26.7 24.1 1.2 1,709.6 9 New Development Bank USD 227.7 - 11.3 0.0 9,605.4 Group B
Full name of the institution Cur. NI Provision EC DA CE
1 Council of Europe Development Bank EUR 104.9 (0.1) 45.7 2.9 2,811.9 2 European Investment Bank EUR (278.8) (26.0) 908.3 35.0 62,467.8 3 Inter-American Development Bank USD 615.0 (27.0) 819.0 33.7 32,247.0 4 Development Bank of Latin America USD 122.7 38.3 141.0 5.7 10,473.6 5 Caribbean Development Bank USD (12.8) - 9.3 1.3 896.5 6 West African Development Bank XOF 8,839.0 5,873.0 11,226.0 1,187.0 734,149.0 Group C
Full name of the institution Cur. NI Provision EC DA CE
1 International Bank for Reconstruction and Development USD 495.0 57.0 1,822.0 668.0 37,063.0 2 International Finance Corporation USD (0.0) 359.0 933.0 17.0 22,766.0 3 African Development Bank UA 25.1 67.8 130.1 10.0 6,605.7 4 Asian Development Bank USD 7.0 11.0 390.0 47.0 17,214.0 5 Islamic Development Bank ISL 307.1 61.9 150.2 8.5 8,329.6 6 International Fund for Agricultural Development USD (423.1) 25.9 83.8 2.6 6,638.8 7 European Bank for Reconstruction and Development EUR 992.0 57.0 445.0 22.0 15,558.0 8 Asian Infrastructure Investment Bank USD 167.4 0.3 30.7 - 17,789.8
In order to enhance comparability of the model, one-off income and expenses were adjusted by adding back or deducting from the net income of the period (i.e. Asian Development Bank reported USD 30.7 billion income from assets transfer in 2017). As HC in the model encompasses all employee related costs, the salary expenses and overhead costs reported under General and Administrative Expenses were used. This approach is in line with the preceding research.
Although the capital employed is formulated as shown in Figure 7 for corporates, total equity (Shareholders’ Equity) itself is used for financial institutions as capital employed (Sledzik, 2013).
Figure 7 Capital Employed Formulation for Corporates
Last of all, some of the selected IFIs have subsidiaries, which brings up the question of consolidation in terms of their financial statements. While some of them disclose their consolidated financial reports in addition to their standalone figures, some of the audit reports are only on a consolidated basis. Hence, for the sake of consistency, consolidated statements were utilized for all IFIs that have at least one subsidiary.
3.1.1. VAICTM Calculations
As the first step, NOPAT is calculated by adding back the provision expenses to the net income of the year eliminating each IFI’s debt collection ability in order to reach a comparable indicator. That is being said, NOPAT is a numeric figure and it is in reporting currency of the respective IFI.
Table 4 – Calculated NOPAT (millions)
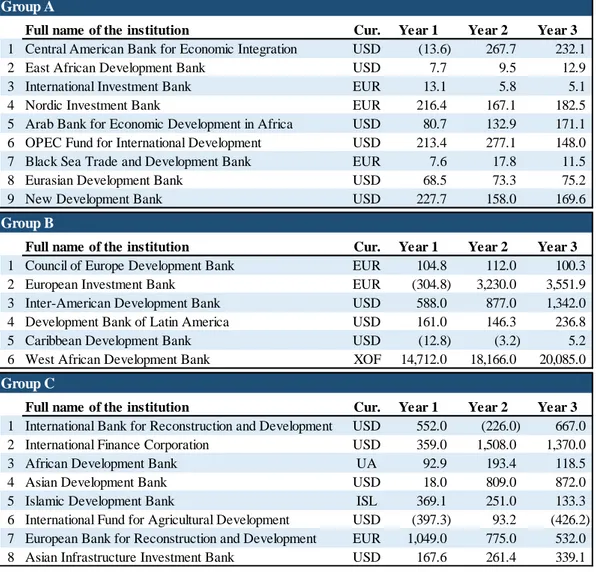
Next, VA calculation was conducted based on the above-mentioned assumption that human capital is equal to salary and other overhead employee expenses (Table 5). For the International Fund for Agricultural Development in Year 1 and Year 3 and for the Caribbean Development Bank in Year 1, VA calculation results were in negative territory. Although the model is criticised for not producing meaningful results when VA is negative – as mentioned under Section 2.1.2. –, this study disregards those criticisms and keeps both of the IFIs in the data group.
Group A
Full name of the institution Cur. Year 1 Year 2 Year 3
1 Central American Bank for Economic Integration USD (13.6) 267.7 232.1 2 East African Development Bank USD 7.7 9.5 12.9 3 International Investment Bank EUR 13.1 5.8 5.1 4 Nordic Investment Bank EUR 216.4 167.1 182.5 5 Arab Bank for Economic Development in Africa USD 80.7 132.9 171.1 6 OPEC Fund for International Development USD 213.4 277.1 148.0 7 Black Sea Trade and Development Bank EUR 7.6 17.8 11.5 8 Eurasian Development Bank USD 68.5 73.3 75.2 9 New Development Bank USD 227.7 158.0 169.6 Group B
Full name of the institution Cur. Year 1 Year 2 Year 3
1 Council of Europe Development Bank EUR 104.8 112.0 100.3 2 European Investment Bank EUR (304.8) 3,230.0 3,551.9 3 Inter-American Development Bank USD 588.0 877.0 1,342.0 4 Development Bank of Latin America USD 161.0 146.3 236.8 5 Caribbean Development Bank USD (12.8) (3.2) 5.2 6 West African Development Bank XOF 14,712.0 18,166.0 20,085.0 Group C
Full name of the institution Cur. Year 1 Year 2 Year 3
1 International Bank for Reconstruction and Development USD 552.0 (226.0) 667.0 2 International Finance Corporation USD 359.0 1,508.0 1,370.0 3 African Development Bank UA 92.9 193.4 118.5 4 Asian Development Bank USD 18.0 809.0 872.0 5 Islamic Development Bank ISL 369.1 251.0 133.3 6 International Fund for Agricultural Development USD (397.3) 93.2 (426.2) 7 European Bank for Reconstruction and Development EUR 1,049.0 775.0 532.0 8 Asian Infrastructure Investment Bank USD 167.6 261.4 339.1
Similar to NOPAT, unless converted into the same currency VA is not comparable and nominal. As VAICTM is a model consisting of ratios not nominal values, neither NOPAT nor VA is converted into selected currencies.
Table 5 – Calculated VA (millions)
Once VA is calculated, the three main components of VAICTM, namely Capital Employed Efficiency (CEE), Human Capital Efficiency (HCE) and Structural Capital Efficiency (SCE), (see Figure 2) can be determined.
This study uses shareholders’ equity for capital employed in the CEE formulation, in which it is the denominator to VA. CEE illustrates the efficiency of the use of
Group A
Full name of the institution Cur. Year 1 Year 2 Year 3
1 Central American Bank for Economic Integration USD 18.0 302.1 269.4 2 East African Development Bank USD 12.6 14.3 17.3 3 International Investment Bank EUR 33.0 27.3 28.0 4 Nordic Investment Bank EUR 261.2 210.3 233.7 5 Arab Bank for Economic Development in Africa USD 93.4 145.0 184.4 6 OPEC Fund for International Development USD 259.2 323.8 199.8 7 Black Sea Trade and Development Bank EUR 22.5 33.0 27.9 8 Eurasian Development Bank USD 93.7 96.5 107.8 9 New Development Bank USD 239.0 177.0 195.2 Group B
Full name of the institution Cur. Year 1 Year 2 Year 3
1 Council of Europe Development Bank EUR 153.4 160.5 151.2 2 European Investment Bank EUR 638.5 4,345.2 4,786.1 3 Inter-American Development Bank USD 1,440.7 1,759.5 2,217.5 4 Development Bank of Latin America USD 307.6 302.2 401.1 5 Caribbean Development Bank USD (2.2) 11.5 17.2 6 West African Development Bank XOF 27,125.0 30,453.0 35,272.0 Group C
Full name of the institution Cur. Year 1 Year 2 Year 3
1 International Bank for Reconstruction and Development USD 3,042.0 2,185.0 3,247.0 2 International Finance Corporation USD 1,309.0 2,487.0 2,450.0 3 African Development Bank UA 233.0 356.4 302.2 4 Asian Development Bank USD 455.0 1,462.0 1,543.0 5 Islamic Development Bank ISL 527.7 405.9 293.6 6 International Fund for Agricultural Development USD (310.8) 188.7 (326.4) 7 European Bank for Reconstruction and Development EUR 1,516.0 1,196.0 952.0 8 Asian Infrastructure Investment Bank USD 198.3 317.7 424.9
capital in terms of creating value. Hence, higher CEE translates into higher efficiency. International Finance Corporation (IFC) has the highest CEE over the analysed period with 0.099 in Year 2 (2017), whereas – excluding negative results due to negative VA – European Investment Bank (EIB) has the lowest CEE with 0.010 in Year 1 (2016).
Table 6 – Capital Employed Efficiency (CEE)
Overall, (across groups and years) a total of 60 CEE observations were made with a mean of 0.045 and a variance of 0.001 indicating that the observed ratios are not much distant from each other.
Group A
Full name of the institution Cur. Year 1 Year 2 Year 3
1 Central American Bank for Economic Integration USD 0.006 0.094 0.078 2 East African Development Bank USD 0.053 0.057 0.066 3 International Investment Bank EUR 0.084 0.072 0.069 4 Nordic Investment Bank EUR 0.076 0.059 0.063 5 Arab Bank for Economic Development in Africa USD 0.021 0.030 0.038 6 OPEC Fund for International Development USD 0.037 0.045 0.028 7 Black Sea Trade and Development Bank EUR 0.030 0.044 0.035 8 Eurasian Development Bank USD 0.055 0.056 0.058 9 New Development Bank USD 0.025 0.018 0.020 Group B
Full name of the institution Cur. Year 1 Year 2 Year 3
1 Council of Europe Development Bank EUR 0.055 0.054 0.050 2 European Investment Bank EUR 0.010 0.066 0.069 3 Inter-American Development Bank USD 0.045 0.053 0.065 4 Development Bank of Latin America USD 0.029 0.027 0.034 5 Caribbean Development Bank USD (0.002) 0.013 0.019 6 West African Development Bank XOF 0.037 0.042 0.049 Group C
Full name of the institution Cur. Year 1 Year 2 Year 3
1 International Bank for Reconstruction and Development USD 0.082 0.055 0.078 2 International Finance Corporation USD 0.057 0.099 0.094 3 African Development Bank UA 0.035 0.050 0.042 4 Asian Development Bank USD 0.026 0.029 0.030 5 Islamic Development Bank ISL 0.063 0.048 0.034 6 International Fund for Agricultural Development USD (0.047) 0.027 (0.046) 7 European Bank for Reconstruction and Development EUR 0.097 0.074 0.058 8 Asian Infrastructure Investment Bank USD 0.011 0.017 0.022
Table 7 – Observed CEE Statistics
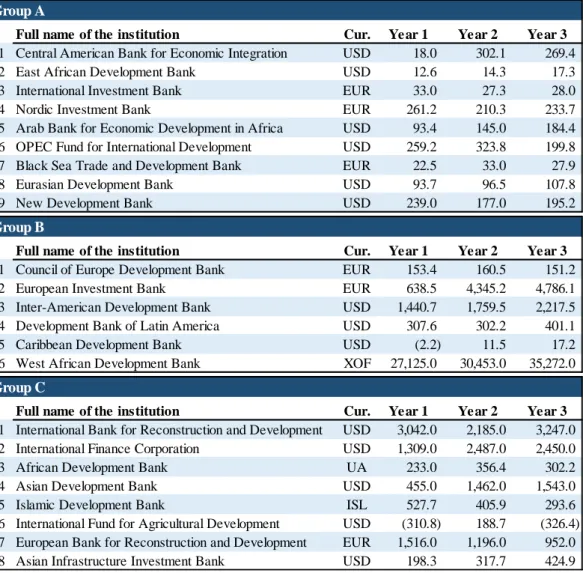
For this study human capital was assumed to be consisting of employee costs. For the calculation of Human Capital Efficiency (HCE) (see Figure 5), VA was numerator and employee costs was the denominator. Due to formulation structure of the model, HC is a component of VA; hence, HCE is a ratio greater than 0 by definition (except for the cases in which VA is negative).
Table 8 – Human Capital Efficiency (HCE)
# of Observations Mean Median St. Deviation Variance
69 0.044 0.045 0.028 0.001
Group A
Full name of the institution Cur. Year 1 Year 2 Year 3
1 Central American Bank for Economic Integration USD 0.638 9.831 8.122 2 East African Development Bank USD 3.013 3.525 4.813 3 International Investment Bank EUR 1.751 1.333 1.254 4 Nordic Investment Bank EUR 6.047 5.093 5.268 5 Arab Bank for Economic Development in Africa USD 7.664 12.728 14.821 6 OPEC Fund for International Development USD 5.945 7.260 4.078 7 Black Sea Trade and Development Bank EUR 1.573 2.235 1.747 8 Eurasian Development Bank USD 3.894 4.377 3.435 9 New Development Bank USD 21.225 9.401 7.711 Group B
Full name of the institution Cur. Year 1 Year 2 Year 3
1 Council of Europe Development Bank EUR 3.358 3.555 3.210 2 European Investment Bank EUR 0.703 4.038 4.017 3 Inter-American Development Bank USD 1.759 2.085 2.659 4 Development Bank of Latin America USD 2.182 2.013 2.534 5 Caribbean Development Bank USD (0.238) 0.871 1.687 6 West African Development Bank XOF 2.416 2.747 2.525 Group C
Full name of the institution Cur. Year 1 Year 2 Year 3
1 International Bank for Reconstruction and Development USD 1.670 1.248 1.827 2 International Finance Corporation USD 1.403 2.585 2.381 3 African Development Bank UA 1.791 2.412 1.823 4 Asian Development Bank USD 1.167 2.529 2.611 5 Islamic Development Bank ISL 3.514 2.766 1.931 6 International Fund for Agricultural Development USD (3.708) 2.038 (3.381) 7 European Bank for Reconstruction and Development EUR 3.407 3.028 2.435 8 Asian Infrastructure Investment Bank USD 6.468 5.663 5.014
The highest HCE observation of 21.225 is based on New Development Bank’s (NDB) Year 1 (2016) figures, whereas the lowest – excluding negative results – is 0.703 of EIB in Year 1 (2016). Although an increase in HCE suggests an improvement in employee productivity that translates into augmenting value, the outliers (such as NDB) and the reason(s) behind their performances require further examination and acknowledgement.
Overall (across groups and years), the 60 HCE observations has a mean value of 3.217 and a variance of 10.218 suggesting a wide spread.
Table 9 – Observed HCE Statistics
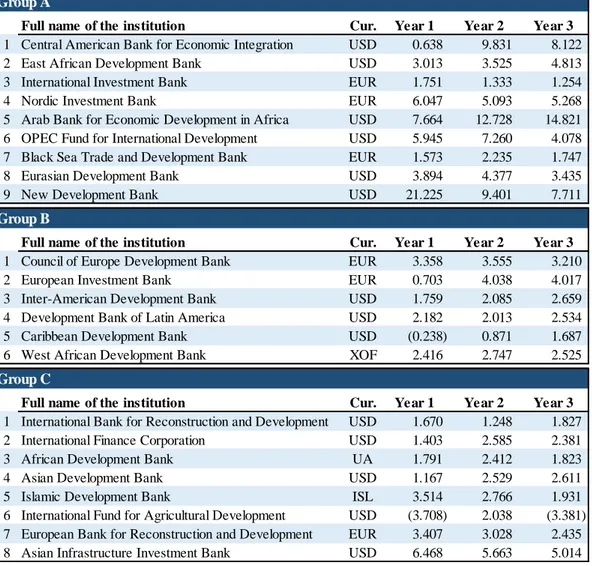
The last component of the VAICTM model is Structural Capital Efficiency (SCE), which is calculated by dividing Structural Capital (SC) with VA. Often defined as a combination of competitive intelligence, patents, information systems etc. SC is the intellectual assets, which remains with the institution regardless of employees’ presence.
# of Observations Mean Median St. Deviation Variance
Table 10 – Structural Capital Efficiency (SCE)
In the model SC is a residual of VA and HC, both of which are actual values obtained from financial statements. However, SC in Pulic’s work is not an actual value but the return of it (Andriessen, 2004).
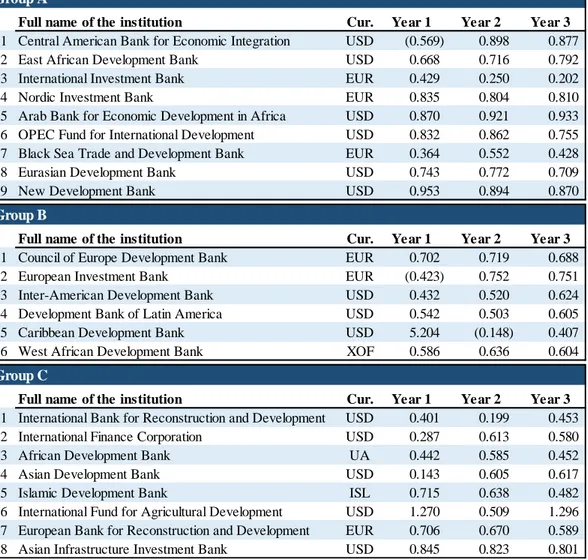
Among the calculated SCEs, the Caribbean Development Bank (CDB) has the highest SCE of 5.204 in Year 1 (2016) figures, while – excluding negative results – Asian Development Bank (ADB) has the lowest with 0.143 also in Year 1 (2016). The mean of 60 SCE observations is 0.637 and the variance is 0.422.
Group A
Full name of the institution Cur. Year 1 Year 2 Year 3
1 Central American Bank for Economic Integration USD (0.569) 0.898 0.877 2 East African Development Bank USD 0.668 0.716 0.792 3 International Investment Bank EUR 0.429 0.250 0.202 4 Nordic Investment Bank EUR 0.835 0.804 0.810 5 Arab Bank for Economic Development in Africa USD 0.870 0.921 0.933 6 OPEC Fund for International Development USD 0.832 0.862 0.755 7 Black Sea Trade and Development Bank EUR 0.364 0.552 0.428 8 Eurasian Development Bank USD 0.743 0.772 0.709 9 New Development Bank USD 0.953 0.894 0.870 Group B
Full name of the institution Cur. Year 1 Year 2 Year 3
1 Council of Europe Development Bank EUR 0.702 0.719 0.688 2 European Investment Bank EUR (0.423) 0.752 0.751 3 Inter-American Development Bank USD 0.432 0.520 0.624 4 Development Bank of Latin America USD 0.542 0.503 0.605 5 Caribbean Development Bank USD 5.204 (0.148) 0.407 6 West African Development Bank XOF 0.586 0.636 0.604 Group C
Full name of the institution Cur. Year 1 Year 2 Year 3
1 International Bank for Reconstruction and Development USD 0.401 0.199 0.453 2 International Finance Corporation USD 0.287 0.613 0.580 3 African Development Bank UA 0.442 0.585 0.452 4 Asian Development Bank USD 0.143 0.605 0.617 5 Islamic Development Bank ISL 0.715 0.638 0.482 6 International Fund for Agricultural Development USD 1.270 0.509 1.296 7 European Bank for Reconstruction and Development EUR 0.706 0.670 0.589 8 Asian Infrastructure Investment Bank USD 0.845 0.823 0.801