FACTORS INFLUENCING DIFFERENTIATION OF PINTO BEAN SEED DISCOLORATION
by
Muharrem Ergun
A THESIS
Presented to the Faculty of
The Graduate College at the University of Nebraska In Partial Fulfillment of Requirements
For the Degree of Master of Science
Major: Horticulture
Under the Supervision of Professor Ellen T. Paparozzi
Lincoln, Nebraska
Factors Influencing Differentiation of Pinto Bean Seed Testa Discoloration
Muharrem Ergun, M.S. University of Nebraska, 1998
Advisor: Ellen T. Paparozzi
Pinto breeding line NE 94-4 (Phaseolus vulgaris L.) showed seed coat yellowing in on-farm-field trials in Nebraska in 1996 and 1997. After reviewing field and weather data of the on-farm-trial sites, hail, high temperature and sprinkler irrigation appeared to be involved with the increase in seed coat yellowing. The goal of this research was to determine the cause(s) of testa yellowing. Moisture was the factor chosen for further exploration.
Two greenhouse experiments (misting and injection) and one lab experiment (moistened filter paper) were conducted. The experimental design was a split-plot in the misting experiment, and a randomized complete block design in the injection and moistened filter paper experiments. In all experiments, breeding line NE 94-4 and Pinto bean variety UI 114 (control) were used. At the end of each experiment, yellowing was recorded visually. Data from all three experiments were analyzed using the mixed model procedure of SAS.
In the misting experiment, only variety/line, and the interaction between variety/line and pod were significant. In the injection and moistened filter paper
experiments, the treatment effects were significant with NE 94-4 showing more yellowing than UI 114.
Thin layer paper chromatography (TLC) was used to identify the pigments in the Pinto bean seed testa. Some flavonoids and carotenes were identified. Sulpheritin (aurones, flavonoids) was found only in the seed coat of yellowed NE 94-4. On the other hand, daidzein and genistein (isoflavonoids) were identified only in the seed coat of UI 114.
ACKNOWLEDGEMENTS
I would like to thank my major advisor Dr. Ellen Paparozzi and committee members Dr. Dermot Coyne and Dr. Durward Smith for their encouragement and interest in this research.
I thank David Nuland for identifying the problem, helping by providing field data and seeds from various sites.
I also would like to thank others who have made a significant contribution to this project: Stacy Adams, Jim Reiser, Liz Conley and Dr. Stephen Kachman.
LIST OF CONTENTS
Page
INTRODUCTION………..1
LITERATURE REVIEW………..3
Flavonoids………...4
1. Distribution of flavonoids in common beans………..4
2. Function of flavonoids in plants………..5
3. Pharmacological and clinical application of the flavonoids………6
4. Factors affecting flavonoid biosynthesis……….7
Carotenoids………..8
1. Distribution of carotenoids in common beans……….9
2. Function of carotenoids in plants………9
3. Role of carotenoids in human nutrition and medicinal application…….9
4. Factors affecting carotenoid biosynthesis……….10
Inheritance of seed coat color of Pinto beans………12
Nutritional value of Pinto beans………13
MATERIALS AND METHODS………..15
Misting experiment….…...………15
Injection experiment………..….……….………..16
Moistened filter paper experiment…….………..………..17
Measurement of seed coat yellowing………18
Page
RESULT AND DISCUSSION………20
Misting experiment….…...……….….20
Injection experiment………..….……….………20
Moistened filter paper experiment…….…..…..………...21
Pigments in the seed coat of Pinto bean………..………...….22
CONCLUSIONS……….24
LITERATURE CITED……….………..….25
LIST OF FIGURES
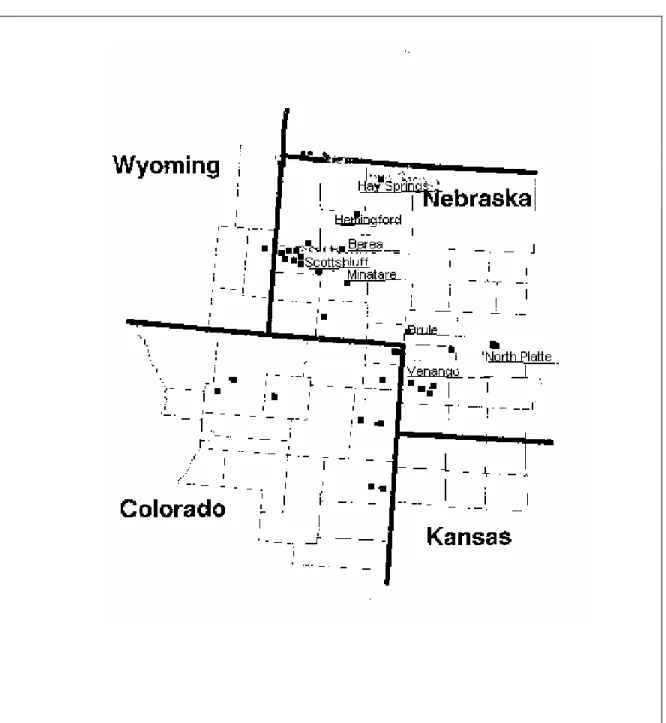
Figure Page Figure 1. Map of on-farm field trial sites………..…………36 Figure 2. Percentage of seed coat yellowing of 8 field-grown Pinto bean
varieties/lines……….37 Figure 3. Percentage of seed coat yellowing of seed coat of two bean entries under
different treatments in the misting experiment………..38 Figure 4. Percentage of seed coat yellowing of seed coat of bean entries under different treatments in the injection experiment………..…39 Figure 5. Percentage of seed coat yellowing of seed coat of two bean entries under
different treatments in the moistened filter paper experiment………..….…40 Figure 6. Pinto UI 114 and NE 94-4 from the moistened filter paper experiment……....41
LIST OF TABLES
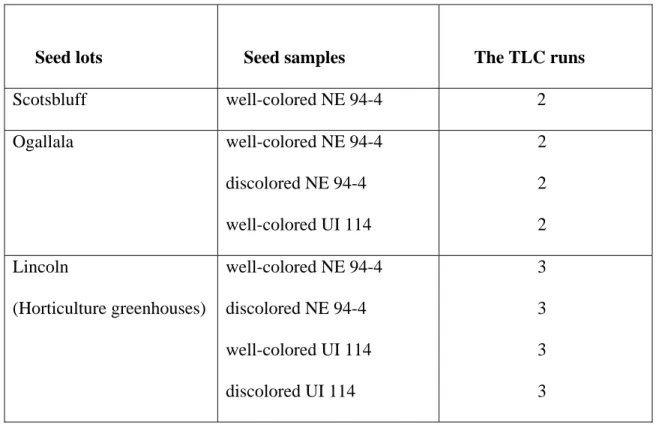
Table Page Table 1. Seed samples, their origin lots and number of times thin layer paper chromatography (TLC) was run for identification of the plant pigments (flavonoids,
carotenes and xanthophylls) in the seed coat of Pinto beans……….……29
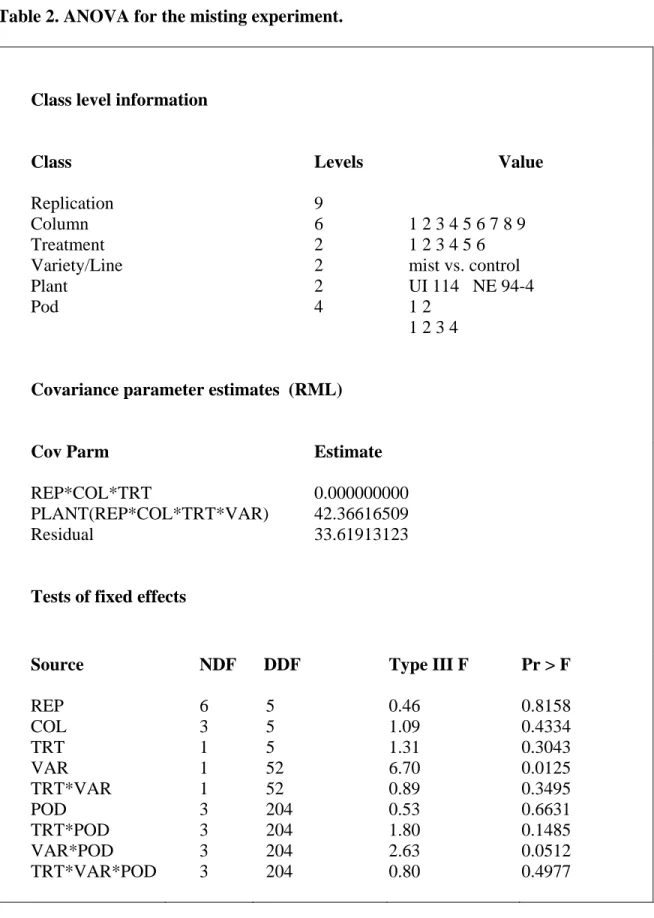
Table 2. ANOVA for the misting experiment………...………30
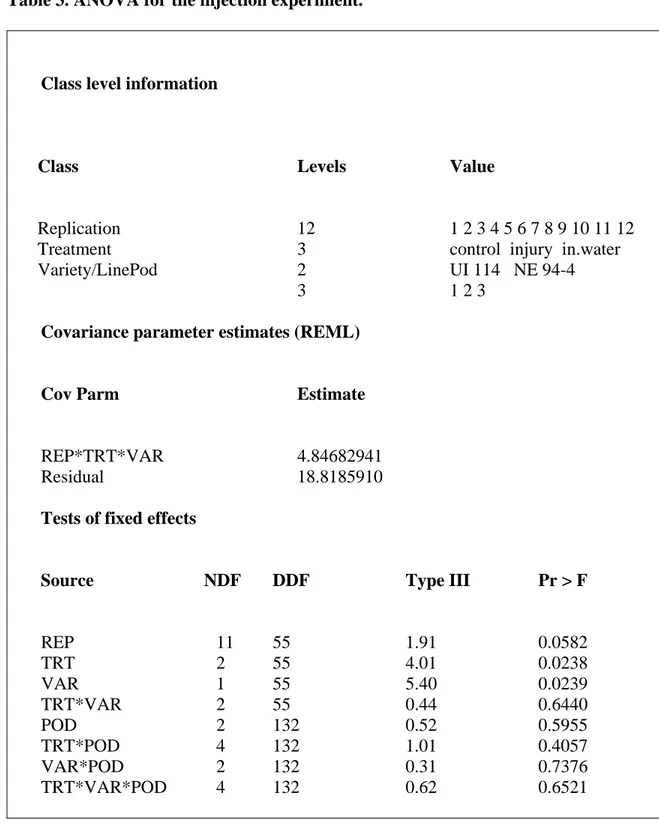
Table 3. ANOVA for the injection experiment………...…………..31
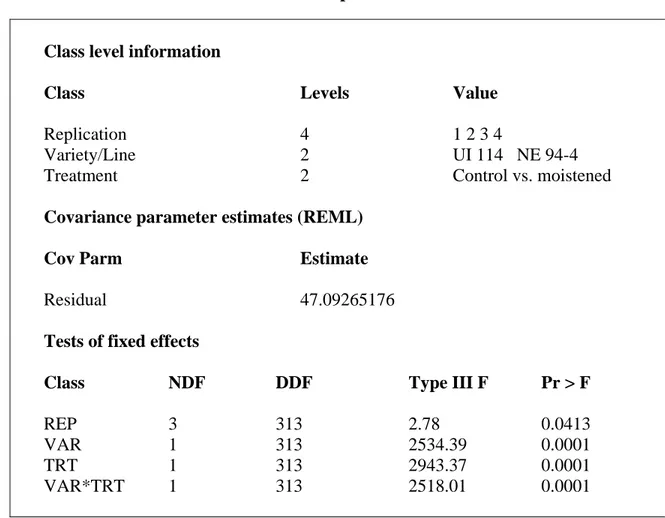
Table 4. ANOVA for the moistened filter paper experiment………...…….32
Table 5. Yellow pigments identified in well-colored NE 94-4 bean seed coat testa (field-grown) in winter 1998………...……33
Table 6. Yellow pigments identified in well-colored NE 94-4 bean seed coat testa (greenhouse-grown) in summer 1998………33
Table 7. Yellow pigments identified in discolored NE 94-4 bean seed coat testa (greenhouse-grown) in summer 1998………...…….34
Table 8. Yellow pigments identified in UI 114 bean seed coat testa (greenhouse-grown) in summer 1998………...…………..35
INTRODUCTION
Legumes are grown and consumed in nearly all parts of the world. In many developing countries, 20% of the available protein is provided by legumes. Legumes are also an integral part of dietary protein for approximate 50% of the world’s population (Deshpande et al., 1983). Of the twenty leguminous species commonly used for food, dry beans, Phaseoulus vulgaris L., are consumed in the largest quantities in the U.S. as well the world (Deshpande et al., 1983).
‘Pinto’, ‘Great Northern’, and ‘Light Red Kidney’ beans are the main bean varieties produced in the central high plains states of Colorado, Nebraska and Wyoming. Among the three ‘most-consumed’ dry bean varieties (Schwartz et al., 1996), Pinto beans have become the most popular variety. Thus, the combined popularity and global economic worth of Pinto beans makes them an important crop to study.
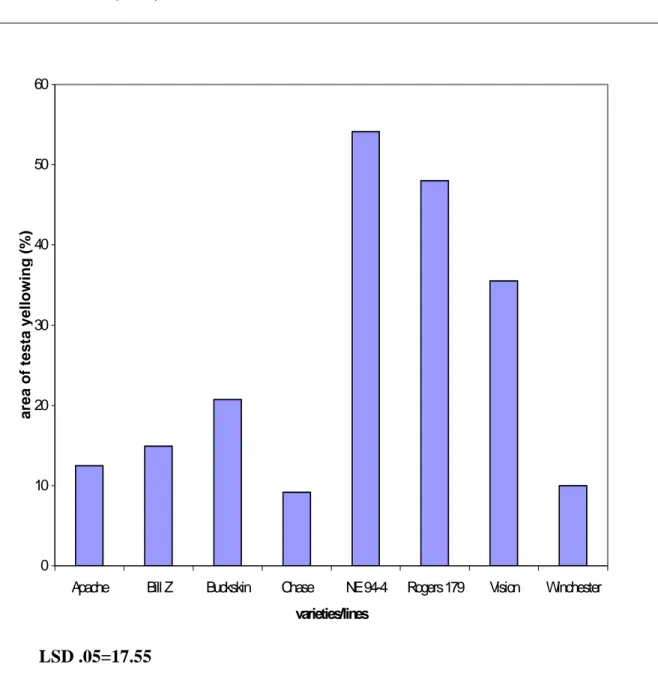
Color is very important for most fruits and vegetables including Pinto beans. The shining mottled color of Pinto beans attracts consumers’ attention. This mottled coloration is primarily determined by genotype (Prakken, 1974). However, environmental factors and diseases can cause discoloration (yellowing) of the testa. Discolored Pinto bean seeds are not purchased by consumers. Thus, growing varieties where even a small percentage of the beans are discolored is to be avoided. In 1996 and 1997, breeding line Pinto NE 94-4 showed seed coat discoloration in on-farm field trials in Nebraska (Figure 1). While other varieties also showed some discoloration (Figure 2), Pinto NE 94-4 was scheduled to be released due to its other excellent characteristics such as high yield. Due to the yellowing, breeding line Pinto NE 94-4 was not released and the question arose as
to how this yellowing occurred as all previous selections in NE 94-4’s parentage were made against yellowing and toward quality seed coat color.
After reviewing weather and field data from the on-farm field trials, it was determined that hail, high temperature and sprinkler irrigation could be involved with the increase in seed coat yellowing. Irrigation (moisture) was chosen as the factor for further exploration. Additionally, investigation of the pigments in the Pinto dry bean testa was undertaken to determine what pigments(s) may be involved in the yellowing of the seed coat.
LITERATURE REVIEW
Although the color of the dry bean seed coat is determined by genotype, environmental factors and diseases can affect the coloration of seed coats. Temperature (Hughes and Sandsted, 1975), humidity (Hughes and Sandsted, 1975; Morris and Wood, 1955) and light (Hughes and Sandsted, 1975) appear to be most important external factors for seed coat coloration. Morris and Wood (1955) indicated that moisture content had more influence on the color changes of pinto beans than of other varieties. They also reported that at a lower moisture content (below 10.4%), the color changed less. Hughes and Sandsted (1975) observed that the seed coat of ‘California Light Red Kidney’ beans had further darkened when exposed to high temperature (24°C) and relative humidity (80%) than lower temperature (12°C and 1°C) and humidity (30%) after 6 months of storage. They also observed that white fluorescent and ultraviolet sources rapidly darkened California Red Kidney beans, with the ultraviolet light darkening the beans more than the fluorescent light after 2 months of storage. The high temperature and humidity caused a dull dark brown color while both light types (cool-white and ultraviolet) produced a bright glassy dark brown color. Hughes and Sandsted (1975) suggested that darkening due to light might involve a pigment change only in the seed coat. While darkening caused by high temperature and relative humidity probably involved changes in constituents throughout the seed.
The term color is based on the human perception of light and refers to a narrow band of the electromagnetic spectrum, specifically the visible spectrum (Hendry, 1993). Acceptability of the pinto bean seed coat color is determined by background color and
patterns (Ghaderi et al., 1984). Average values of different color components can be measured by a Hunter colorimeter, however, selection for the specific type of pinto pattern is based upon visual judgments (Ghaderi et al., 1984). The post-harvest color of dry pinto bean seed coats are due to the carotenoids (Gross, 1991) and the flavonoids (Pietta, 1998), which are the chief classes of plant pigments in nature. Because most beans are not consumed fresh, the color of dry bean seed testa is a very important qualitative characteristic. These pigments, carotenoids and flavonoids, in the bean seed coat are not only crucial for an appealing coloration but important for nutrition as well.
Flavonoids.
The flavonoids are one of the most numerous and widespread groups of natural constituents. They are universally distributed among vascular plants. Except for catechins and proanthocyanidins, they mainly consist of glycosides of flavones, flavonols, flavanons and anthocyanins. The other classes of flavonoids, isoflavonoids, chalkones and aurones, occur less frequently (Pietta, 1998). The most colorful flavonoids are the anthocyanins. Flavonoid color varies from pale yellow, yellow, orange, and blue to red. Of the non-anthocyanin flavonoids, most are colorless or at least pale yellow, largely found in vascular plants and particularly angiosperms (Hendry, 1993). They are present in flowers, fruits, stems, leaves and roots. Frequently, they are located in the epidermal cells.
1. Distribution of flavonoids in common beans.
The seed, seed coat (testa), and hypocotyl of common beans were studied for the presence of flavonoids. The compounds Pg, Cy and Dp 3-glucosides, Pg and Cy
3,5-diglucosides (anthocyanins) in Bush bean seed coat; (Timberlake, 1975); Dp 3-glucoside in the Adzuki bean seed coat (Timberlake, 1975); Dp, pt and Mv 3-glucosides, Mv 5-diglucoside in Adzuki bean (Timberlake, 1975) were identified. And also, 3-xylosylglucoside as the flavonol (Kaempferol) found in Phaseolus vulgaris seed (Timberlake, 1975). Kievetone, licoricidin and its analogue phaseolin were identified in virus or fungal-infected French bean seed as isoflavones (Wong, 1975). In Adzuki bean hypocotyl, Mv 3,5-diglucoside (Timberlake, 1975), in Phaseolus vulgaris, flavonols and aurones were extracted (Donnelly, 1975).
2. Functions of Flavonoid in plants.
The role of flavonoids in the plant kingdom mainly corresponds to participation in the light phase of photosynthesis as catalysts of electron transport and/or as regulators of iron channels involved in photophosphorylation (Morel et al., 1998). Since flavonoids are astringent, they can represent a defense system against insects and the other organisms, which are harmful to plant (Morel et al., 1998). Astringency causes the precipitation of proteins (enzymes) through the formation of water-insoluble molecular complexes (Jovanovic et al., 1998). Catechins and other flavonols possess astringent characteristics.
Isoflavones are important plant-protective phytoalexins (Jovanovic et al., 1998). Phytoalexins are antimicrobial metabolites that are absent or present in low amounts in healthy plants and that accumulate in high concentrations in or around damaged cells (McClure, 1975). Because of their antioxidant characteristics, several flavonoids serve as antioxidants for ascorbic acid by chelating metals from the reaction mixture (McClure, 1975). Flavonoids are also responsible for plant part coloration as described by their composition products, such as anthocyanins, which would give red colors. However, the
coloration varies according to co-pigmentation and to chelation with metals (Morel et al., 1998). Another function of flavonoids in plants is the attraction of birds, bees and insects that carry pollen from one plant to another, thus aiding pollination (Salisbury and Ross, 1991). The attraction of fruits is also another function of flavonoids. Plants insure wide dissemination of seeds by having attractive colored fruits which will be eaten by animals and birds. McClure (1976) cited that flavonoids can also screen plants from damage due to ultraviolet radiation.
3. Pharmacological and clinical application of the flavonoids.
It is likely that many flavonoids, either from medicinal plants or from diet, play an antioxidant role mainly in the digestive system by inhibiting the enzyme-catalyzed formation of reactive oxygen species and/or by scavenging them (Briviba et al., 1998).
Briviba et al (1998) reported that individuals that consumed soybean have a lower cancer rate. Researchers confirmed that genistein and daidzein (isoflavonoids) found in soybeans may be responsible for the reduced cancer risk. Additionally, cancer occurrence and severity was decreased when newborn animals were treated with only three single doses of genistein (Briviba et al., 1998).
Quercetin (flavonol) also reduces the number of tumors in certain animal models, but not in human models (Hertog et al., 1998). However, Hertog et al (1998) reported that quercetin found in onion could lower the risk of stomach cancer as individuals consumed onion consumers have lower rate.
Some studies have also shown that the flavonoids, especially quercetin, could prevent cardiovascular diseases (Hertog et al, 1998). Moreover, flavonoids may protect
against some coronary heart diseases, such as arteriolosclerosis and thrombotic tendencies (Samman et al., 1998).
4. Factors affecting flavonoid biosynthesis.
Light. Many workers have considered flavanoids to have a function in screening plants from ultraviolet radiation since they all have absorblity in the 200 to 380 nm region of the visible spectrum (McClure, 1975). It is also clear that in many cases these same wavelengths are very effective for inducing higher levels of flavonoids (McClure, 1975). Most studies were done on the anthocyanins, and indicated that blue and indigo (deep reddish blue) lights were effective. Red light was slightly effective. Green light was not effective in promoting anthocyanin accumulation (McClure, 1975).
Temperature. Most observations showed that foliar anthocyanins increase with the onset of cold weather (McClure, 1975). In fruits, on the other hand, anthocyanin levels increased as the levels of other flavonoids, especially leucoanthocyanin decreased. In most cases, lower and sustained lower temperature causes an increase in PAL (phenylalanine ammonia lyase), which is an enzyme involved in flavonoid synthesis (McClure, 1975).
Mineral nutrients. As mineral nutrition controls the metabolism of the total plant, it is not surprising that an imbalance of minerals would change the balance of flavonoids. Several researchers have determined flavonoid levels in response to fertilization using the macronutrients nitrogen, phosphorus and potassium (McClure, 19575). The effect of N, P, and K+ on isoflavones in Trifolium pratense was studied and found that phosphorus deficiency markedly increased isoflavones while the other elements had no specific effect (McClure, 1975). Another study conducted on the same plant indicated that nitrogen,
phosphorus and sulfur deficiency almost doubled the levels of flavonoids (McClure, 1975).
Mechanical damage and pathogen attack. Pathogen attack may also alter the flavonoid composition either by wounding or by processes that depend upon the presence of a pathogenic metabolite to change the flavonoid accumulation (McClure, 1975). This was validated by the following experiment. This experiment showed that the PAC (phenylalanine ammonia lyase, an enzyme responsible for flavonoid synthesis) level of immature pods from Phaseoulus vulgaris and Pisum sativum increased within 8 hours of inoculation with several pathogenic and nonpathogenic microorganisms (Gross, 1991). Plant growth substances. The effects of plant growth regulators (PGR) on flavonoids are as diverse as their effects on growth. Increase or decrease in flavonoid levels in response to growth regulators depends on the concentration and manner of PGR application as well as the developmental stage of tissue and the genetic composition of the plants (McClure, 1975). In Phaseolus aureus, IAA, NAA and kinetin induced an increase in the flavonoid concentration (McClure, 1975).
Carotenoids.
Carotenoids are brightly-colored pigments occurring in practically all families of
plants and animals (Zollinger, 1985). These are the yellow, orange or red pigments that exist in various kinds of colored plastids in roots, stems, leaves, flowers and fruits of different plants. Carotenoids derive their name from the main representative of their group, β-carotene (Gross, 1991). Carotenoids can be divided into two groups: (1)
carotenes that are hydrocarbons and their oxygenated derivatives (2) xanthopylls (Gross, 1991).
1. Distribution of carotenoids in common beans.
Gross (1991) indicated that the pods of the green beans (French or snap bean) have β-carotene. In the raw bean seed, the following carotenoids and xanthophylls are found: neoxanthin, violoxanthin, lutein 3-5 epoxide, lutein cis+trans, α-carotene and β-carotene. The carotenoids of etiolated French bean seedlings were analyzed, carotenoids and xanthophylls (chrysanthemaxanthin and auroxanthin) were found (Gross, 1991). The true leaves of the French bean had mostly β-carotene, lutein and neoxanthin (Gross, 1991). However, violaxanthin was absent in leaves (Gross, 1991; Kantha and Erdman, 1987). 2. Function of carotenoids in plants.
Two functions of carotenoids in photosynthesis are well established. The first, both carotene and xanthophyll have the ability to transfer absorbed energy to chlorophyll (Gross, 1991). Secondly, they prevent photoxidation of chlorophyll (Gross, 1991; Salisbury and Ross, 1991). Another important function of carotenoids involves the fact that most yellow flowers contain carotenoids that serve as attractors to pollinators (Salisbury and Ross, 1991).
3. Role of carotenoids in human nutrition and medicinal application.
The sources of the human nutrient vitamin A are provided by diet. Animal sources provide half of the total vitamin A as preformed vitamin A, and plant sources provide the other half as provitamin A carotenoids (Gross, 1991). Carotenoids universal function appear to be in protecting the living system from the combined lethal effect of light and oxygen (Davies, 1975). Carotenoids protect cells and tissues against the potentially
harmful effects of visible light, because they are very efficient deactivators of singlet oxygen (Zollinger, 1987). Gross (1991) reported that because carotenoid pigments protect green plants against photosensitization, these pigments could be used in the treatment of photosensitive diseases, such as erytropoietic protophorphyria. Because of this, carotenoids are being considered as a potential cancer preventation agent. In animal models, β-carotene and canthaxanthin can prevent or slow down the growth of skin tumors induced by UV–B (290nm-320nm) radiation (Gross, 1991). Human studies showed β-carotene protects against cancer of the lung and other organs (Gross, 1991).
4. Factors affecting carotenoid biosynthesis.
Plant growth substances. Plant carotenoids are influenced reversibly by various endogenous and exogenous plant growth regulators. Studies showed that the application of GA3 on the shoots of carrot increased the carotene content in the shoot, whereas it decreased in the root (Gross, 1991). Application of abscisic acid to detached ‘Rutgers’ tomatoes decreased the carotene content by about 50% (Grosss, 1991). Ethephon, endogenous ethylene, and ethylene also increased the carotene content in some tomatoes cultivars (Gross, 1991). Young bean leaves responded to benzyladenine by decreasing the carotenoid content temporarily (Gross, 1991).
Light. Light is not essential for carotenoid synthesis. However, studies have shown that light increased carotenoid synthesis (Gross, 1991). Gross (1991) further proposed that far-red light may the decrease the carotene synthesis.
Temperature. Generally, the optimal temperature for carotenoid synthesis is relatively low, and the optimal temperature sensitivity varies from plant to plant. The optimal temperature for lycopene formation in tomatoes is 16°C to 21°C. Above 30°C, it
is not formed (Gross, 1991). Gross also reported that β-carotene is not affected by temperature. For carrots, the optimal temperature for carotenoid formation was found from 15°C to 21°C (Gross, 1991).
Fertilizers. An experiment showed that high levels of nitrogen caused an increase in the carotene content in sweet potatoes and carrots (Gross, 1991). Potassium deficiency in spinach leaves increased the carotene content while an increase of K raised the total carotenoid and lycopene content in tomatoes. However, this also lowered the β-carotene content (Gross, 1991).
Pesticides. In most cases, the pesticides such as chlorcholine chloride containing nitrogen increased the carotene content in carrots (Gross, 1991). One experiment indicated that in summer carrots grown where the soil pretreated with a series of insecticides and herbicides, the carotene content was higher (up to 21%) than in the control. An exception was recorded with the herbicide Dosanex™, which decreased the total carotene content (Gross, 1991). In lettuce grown in soil, the total carotene content was higher in plants treated with herbicides, but was unaffected in plants treated with fungicide treatment (Gross, 1991).
Soil. The influence of the type of soil on the carotene content of carrots was studied and found that carotene levels were higher in carrots grown on sandy soil, moor, muck and brown soil (Gross, 1991). For carrots in general, the more acidic soil types increased the carotene content (Gross, 1991).
Cultural methods. Different cultural methods, such as growing in a plastic greenhouse or field situation as well as the position of the fruit on the plant, affected the carotenoid content of tomatoes (Gross, 1991). The highest carotenoid content was found
in vine-grown tomatoes (Gross, 1991). Direct plastic covering, using perforated polyethylene sheeting applied for a certain time, produced a threefold increase in the carotene content, while in uncovered uncultured conditions, the increase was only twofold (Gross, 1991). In lettuce, the effect was opposite (Gross, 1991).
Inheritance of seed coat color of pinto beans.
The seed coat color of Phaseoulus vulgaris L. depends on the integration of the so-called “yellow-black’ colors and the ‘red-black’ colors (Prakken, 1974). Nine main loci groups categorized I, II, III-a, III-b appeared to be responsible for seed coat color (Prakken, 1974). Prakken (1974) classified nine loci groups as the following:
I. Basic gene or groundfactors.
1. P, the basic gene or ‘groundfactor’ for seed coat color. 2. T, the gene necessary for a completely colored seed coat. II. Three dominant color genes or chromogenous factors.
3. C, a ‘locus’ having numerous ‘alleles’, indicated as the ‘complex locus for ever-segregating and constant mottling’.
4 D, the hilumring factor. 5. J , the shine factor.
II-a. Three dominant modifying genes or intensifying factors. 6. G, the yellow-brown factor.
7. B, the gray- greenish brown factor. 8. V, the violet factor.
9. Rk, the locus for recessive genes (Prakken, 1974).
A number of seed coat color variants were found in beans. Most of the variations can be explained by assuming interactions of three genes, M, Rk and Br, which are all present in the dominant form in normal Pinto beans (Prakken, 1974). M, for mottling, has two alleles: Mst for striped distribution of mottling and m for self-colored beans (Prakken, 1974). Br is a color modifier of the mottling. In the presence of m , the Br gene has no effect, in beans of the constitution M Br the mottling is brown, while in M br the mottling is green or pink in color. Rk is a color gene, affecting the ground color of mottled beans or the seed coat color of self-colored beans. Rk produces buff color, while the recessive rk produces pink color. Beans of the constitution M Rk Br are brown/buff; m rk Br, green/buff; M rk Br brown/pink, and M rk br pink/pink (Prakken, 1974).
Nutritional value of pinto beans.
Dry legume seeds are important foods in the diets of peoples throughout the world, especially those living in technologically underdeveloped tropical and subtropical areas. Despite relatively low digestibility, dry beans are important source of protein for countries having short supplies of animal protein.
Koehler et al., (1987) reported that pinto beans had the greatest protein quality among the bean cultivars of: White, Navy, Great Northern, Red Kidney, Pink, Red Mexican, and Black Turtle. Koehler et al., (1987) found that UI 114 contained 21.2% protein, and protein quality was 81 RNV (relative nutritive value is defined as the growth of Tetrahymena organism supported by the bean protein as compared to growth supported by casein). Beans are good sources of thiamine, zinc, iron and potassium, Pinto
bean variety UI 114 contains 6.55mg/100g Fe, 2.8mg/100g Zn, 162mg/100g Ca, 161mg/100g Mg, 1379mg/100g P, 063mg/100g thiamin and .188mg/100g riboflavin (Koehler et al., 1987). The vitamin content of variety UI 114 in mg acid/g protein wet basis are: histidine, 33; iso-leucine, 45; leucine, 79; lysine, 71; total methionine cystine, 21; total aromatic, 96; threonine, 43; and valine, 55. Thus, the nutritional contribution of dry beans has recently become a serious consideration in food science as well as in bean genetics.
MATERIALS AND METHODS
Two preliminary experiments were run during fall '97 and winter '97 to practice growing bean plants and perfecting the water injection method. The fall '97 and winter '97 experiments provided information for use in the winter '98 and spring '98 experiments. The following two experiments, the misting and injection experiments, were conducted during winter '98 and spring '98. Later an experiment involving the effect of moistened filter paper on seed discoloration was conducted in the lab.
1. Misting experiment.
Beans were planted on January 22, 1998 in the Horticulture Research Greenhouses. After three weeks, half of the seedling plants were moved to another greenhouse and placed where the mist equipment was available. Plants were fertilized with 300 ppm of 20N-8.8P-16.6K three times per week until pods formed. After the pods formed, the frequency of the nutritional applications was decreased to once per week. The greenhouse temperature was set at 26°C day / 20°C night. The humidity was not controlled. The soil medium was 27 % vermiculate, 36 % peat, 10 % soil and 27 % sand. The pesticide Marathon™ was applied to all bean seedlings.
The mist treatment was applied daily from March 24 to May 07, 1998. The treatment design was a split-plot. The mist treatment was used as main plot and arranged in rows and columns with 9 replications. The breeding line Pinto NE 94-4, and variety Pinto UI 114 (control) were arranged as the split-plot. The experimental unit consisted of 4 plants in each with 9 replications for a total of 72 plants.
The treatments were applied two weeks before physiological maturity. One of two plots (4 plants) was removed from each replication to the misting area where the plants were misted for 60 minutes per day over a period of 14 days. Thus, half of the experiment, 36 plants, were treated with mist in a special area which was divided with plastic shields so that the moisture could not affect the rest of plants. A total of 302.8 liters of water were applied to the plants during the 60 minutes misting time. After every misting, plants were moved back to their original places. Each pot treated with mist was covered with a plastic bag so that water would not leak into the soil medium. Two days after the completion of treatments the % yellowing of the seed was recorded. Six seeds from 4 pods, taken from the base to the apex, were examined from each plant for a total of 24 seeds.
Mixed model procedure (SAS, 1995) was used to obtain appropriate estimates and to test statistics. To get more reliable information, the mean of 1 to 6 seeds per pod was used.
2. Injection experiment.
For this experiment the plants were grown at the same time and under the same conditions as the misting experiment.
The three treatments were injury (injection only), injection with water and control. Treatments, injury (injection only), injection with water, were applied on March 27, 1998. The treatment design was a randomized complete block design with 12 replications. Pinto UI 114 and breeding line Pinto NE 94-4 were used as blocks. A total of 72 plants were grown in this experiment. Fifteen days before physiological maturity,
the treatments were applied to the pods. Three pods were selected from the base, middle and apex of each plant for each treatment. For the injury treatment (injection only), a hypodermic syringe was used. The hypodermic syringe was inserted into each pod near the pedicel. For injection with water treatment, a hypodermic syringe was used and 5 ml of water was injected into the pod at the pod suture near the pedicel. Fifteen days later % yellowing of seeds were recorded from three pods per plant.
The mixed model analysis procedure (SAS, 1995) was used to obtain appropriate estimates and test statistics. To get more reliable information, the mean of 1 to 6 seeds per pod was used.
3. Moistened filter paper experiment.
This experiment was conducted in the lab (70 °F) from April 14 to 21 1998. The treatment design was a randomized complete block design with 4 replications. Pinto UI 114 and breeding line Pinto NE 94-4 were the blocks. There were two treatments, moistened filter paper vs. dry filter paper (control). Pods were randomly selected from control plants in the injection experiment. Each pod was opened in the dark, and immediately placed in petri dishes. Twenty seeds were placed on either moist or dry filter paper in a petri dish. Petri dishes were sealed with tape to prevent air exchange, and kept in the dark during the experiment. Seeds were examined daily for % yellowing. Data was taken at day 7. The experiment was terminated when the seeds placed on the moist filter paper started to germinate.
A mixed model procedure was used to obtain statistical values, and the mean of 1 to 20 seeds per petri dish was taken to reduce the complexity of analysis (SAS, 1995).
Measurement of seed coat yellowing.
For all of the above experiments, yellowing was recorded visually by determining the percentage of the yellow area on a bean seed in each experiment. The scale was: 0,10,20, ….., 90,100 % with 10 % intervals.
Identification of the plant pigments on the seed coat of pinto beans.
Twenty-five g seed of well-colored Pinto NE 94-4, discolored (yellowed) Pinto NE 94-4 and Pinto UI 114 (Table 1), were each mixed separately with 50 ml 80 % methanol. The mixture was heated until yellow pigments were extracted from the bean testa. After extraction, the mixture was filtered with Whatman filter paper (No.4). Methanol in the solvent was removed by nitrogen, and the solvent was filtered once more. Finally, the solution was ready for the thin layer paper chromatography. The stationary phase was Whatman chromatography paper (No.1). For flavonoids, the mobile phases were: butanol-acetic acid-water 6:1:2; 15 % aqueous acetic acid, and water (Swain, 1976). For xanthophylls, the mobile phases were: benzene; benzene-ethyl acetate-methanol, 75:20:5; and dicholoromethane-ethyl acetate, 4:1 (Davies, 1976). For carotenes, the mobile phases were: benzene-light petroleum, 90:10; benzene-light petroleum, 50:50; and benzene-light petroleum, 10:90 (Davies, 1976).
The stationary phase, with a concentrated spot of the solution on it, was dipped into each mobile phase. As the mobile phases ascended the chromatography paper it carried each of the pigments with it differently. In this way, the pigments were separated from one another and could be identified by their different colors and position by the Rf
value (the relative distance traveled by the various pigments). For color determination ultraviolet wavelength light was used.
RESULT AND DISCUSSION
Misting experiment.
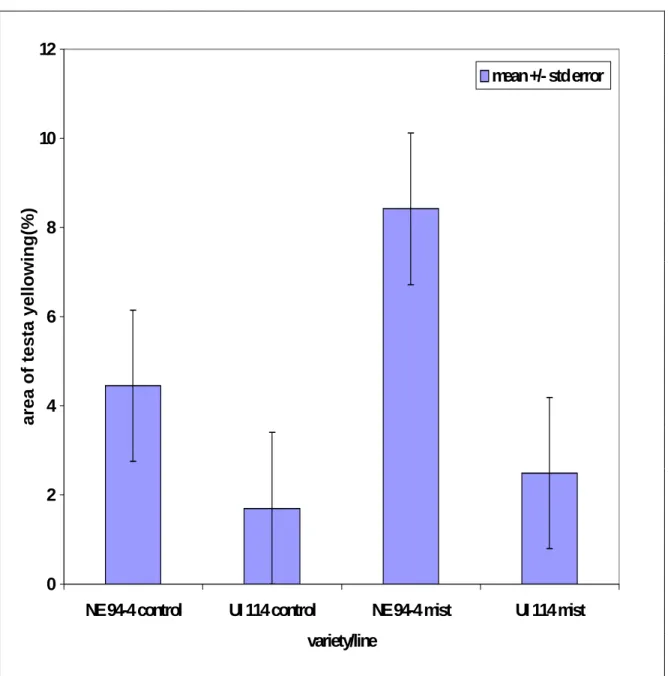
The treatments, mist vs. control, were designed to simulate different conditions rain and/or sprinkler irrigation that often occur in the field during the last two weeks of the harvest season. No significant differences between the two treatments were observed (Table 2). This could be due to a number of reasons. Either the rain or sprinkler irrigation alone did not affect bean discoloration (yellowing). Therefore, some special conditions were needed to affect bean discoloration. Beans lying down on the ground in the field could have discoloration, particularly if their pods touched the wet ground. A similar condition was observed in an on-farm field trial in Scottsbluff in 1997 where during harvesting of bean plants only half of trial was cut and harvested. The other cut plants were left on the ground in the field and were rained upon. Seeds from the pods of the plants which touched the ground showed more yellowing than seeds from cut plants that were left upright. The variety/line effect and the interaction between variety/line and pod were significant, as expected because breeding line NE 94-4 is susceptible to discoloration (yellowing) and variety UI 114 (Figure 3) is not (Coyne et al., 1994). Pod effects were not significant, and moreover, the interactions of TRT*VAR, TRT*POD, TRT*VAR*POD were not also significant.
Injection experiment.
The injury with a hypodermic syringe, the injection of water with a hypodermic syringe, and control were the treatments in the injection experiment. The injury with the
hypodermic syringe was applied to pods to simulate physical damage such as hail damage, as well as a control for the water injection treatment. The injection of water could simulate the water inside pods after possible physical damage or water into seeds lying on the ground. Treatment effects were significant (Table 3). The injection of water treatment was associated with more testa yellowing and differed form (Figure 4) in that more testa yellowing occurred. The water injected inside pods probably caused this yellowing and may be related to links with Red Kidney bean seed. Hughes and Sansted (1975) reported that ‘California Light Red Kidney’ bean seed stored at the highest level of relative humidity had further darkening of the seed coat that at lower levels of relative humidity.
Breeding line Pinto NE 94-4 again showed more yellowing than variety Pinto UI 114, as expected. (Figure 4). Pod effects, the interactions of TRT*POD, TRT*VAR, POD*VAR, and TRT*POD*VAR were not statiscally significant.
Moistened filter paper experiment.
The wet filter paper simulated pods lying on the wet ground and possibly a storage unit with high level of relative humidity. The beans placed directly on the wet filter papers started discoloration at day 1 (Figure 7). By three days, discoloration was extensive. The difference between treatments was significant (Table 4) with breeding line NE 94-4 showing more yellowing than variety UI 114 (Figure 5). Both entries, breeding line NE 94-4 and variety UI 114, showed discoloration (yellowing). This could be caused by the high level of moisture content around and/or inside seeds (Morris and Wood,
1955). Bean seeds could be more severely discolored (yellowed) than bean seeds present in pods.
Pigments in the seed coat of Pinto bean seed coat.
Thin layer chromatography (TLC) was used to identify the color pigments on the bean seed testa of variety UI 114 and breeding line NE 94-4. For identification of color pigments (possibly, carotenoids and flavonoids), TLC method was chosen because different mobile phases can be used at the same time, and TLC permits rapid and sharp separation on a small scale (Gross, 1991; Markham, 1975). This screening experiment was done for well-colored NE 94-4 pinto bean seed coat, supplied from an on-farm field trial in Scottsbluff, in winter 1998. Some flavonoids and carotenoids including xanthopylls were identified on well-colored NE 94-4 bean seed coat, as expected. These are listed in Table 5. Smartt (1988) and Timberlake (1975) reported some flavonoids were found on the bean seed coat. Moreover, Gross (1991) indicated that some carotenoids were classified in raw green bean seed.
During the summer of 1998, another experiment was performed for the identification of yellow pigments. This time, well-colored and yellowed NE 94-4, and UI 114 bean seed coats were used. The beans were supplied from the three previous experiments. In this experiment, well-colored and yellowed NE 94-4 had some of the same flavonoids, which are flavonols and flavanones (Table 6 and table 7). The different flavonids identified in this experiment were: apigenin on the seed coat of well-colored NE 94-4, sulphuretin on the seed coat of yellowed NE 94-4. This could be explained by some changes in constituents throughout the seed (Hughes and Sansted, 1975). Sulphuretin is one of aurones, called ‘anthoclar’ pigments (Bohm, 1975). Anthoclar
means a group of yellow pigments which turn red in the presence of alkali (Bohm, 1975). Bohm (1975) reported aurones color to be a yellow-golden color. This yellow-golden aurone could explain the yellowing. Both of the entries showed the same carotenes as listed in tables 5 and 6. None of them showed xanthophylls. The following flavonoids were identified: flavones, flavonols, flavanons and isoflavones on the seed coat of variety Pinto UI 114 (Table 8). The same carotenes identified on the seed coat of well-colored and yellowed NE 94-4 were also found on the seed coat of UI 114, but no xanthophylls were classified. The main difference for the flavonoids between variety UI 114 seed coat and breeding line NE 94-4 including well-colored and yellowed types was that variety UI 114 seed testa carries some innocuous isoflavonoids (isoflavones) daidzein and genistein (Table 8). In contrast, the other flavonoids, isoflavonoids have estrogenic, insecticidial, piscicidal and anti-fungal properties (Wong, 1975). This could be why variety UI 114 is always used for the control bean among pinto bean varieties and breeding lines. The seed color pattern of UI 114 is highly desired by consumers and processors because it maintains brighter color pattern over a wide range of environmental conditions due to its chemical constituents.
CONCLUSIONS
The moisture content either around the seed or inside the seed is probably the biggest factor responsible for discoloration when the seed completes its physiological development. The moistened filter paper experiment supports this idea. On the other hand, the pod could protect the seed against discoloration (yellowing) as long as the seed and pod are physiologically connected to each other. This idea is supported by the injection of water treatment in the injection experiment. Therefore, additional moisture studies are needed on dry bean seeds to verify this (Morris and Wood, 1955; Hughes and Sansted, 1975).
The relative humidity (moisture content) probably involves some changes in constituents throughout the seed (Hughes and Sansted, 1975). This idea was supported by the presence of sulphuretin found only on the seed coat of yellowed NE 94-4. Most likely, the aurones could be causing the bean yellowing.
The seed coat of Pinto UI 114 showed less discoloration than breeding line Pinto NE 94-4. This is possibly due to the presence of innocuous genistein and daidzein. The isoflavonoids in UI 114 could have innocuous estrogenic, insecticidial, piscicidal, anti-fungal properties (Wong, 1975). On the other hand, Pinto 94-4 was bred for resistance to pests, fungal diseases, white mold, root rot and the bacterial disease common blight.
LITERATURE CITED
Bohm, A.B. 1975. Chalcones, aurones and dihydrochalcones, p. 442-505. In: J.B.
Harbone, T.J. Marry, and H Mabry. (eds.). The flavonoids, Part 1. Academic Press. New York, NY.
Briviba, K., H. Sies, S. Sepulveda-Boza, and F.W. Zilliken. 1998. Isoflavonoids as inhibitors of lipid peroxidation and quenches of singlet oxygen, p. 295-302. In: C.A. Rice-Evans. and L. Packer (eds.). Flvanoids in health and disease. Marcel Dekler, Inc. New York, NY.
Coyne, D.T., D.S. Nuland, D.T. Lindgren, and J.R. Steadman. 1994. ‘Chase’ Pinto dry bean. Hortscience 29 (1): 44-45.
Davies, B.H. 1975. Carotenoids—aspects of biosynthesis and enzymology, p. 7-25. In: F.C. Czygan, (ed.). Pigments in plants. Botanisches Institüt mit Botanischem Garten Lehrstuhl für Pharmazeutiche Biologie Würzburg, Stuttgart, Germany. Davies, B.H. 1976. Carotenoids, p. 38-165. In. T.W. Goodwin (ed.). Chemistry and
biochemistry of plant pigments. Academic Press. England.
Deshpande, S., S.K. Sathe, and D.K. Salunkhe. 1984. Interrelationships between certain physical and chemical properties of dry bean. Qual. Plant. Foods Hum. Nutr. 34: 53-65.
Donnelly, D.M.X. 1975. Neoflavonoids, p. 801-865. In: J.B. Harbone, T.J Marby, and H Mabry. (eds.). The Flavonoids, Part 2. Academic Press. New York, NY.
Ghaderi, A., G.L. Hosfield, M.W. Adams, and M.A. Uebersax. 1984. Variability in culinary quality, component interrelationships, and breeding implications in Navy and Pinto beans. Journal of the American Society for Horticulture Science 109(1): 85-90.
Gross, J. 1991. Pigments in vegetables chlorophylls and carotenoids. Published by Van Mostrand Reinhold. New York, NY.
Hendry, G.A.F. 1993. Plant pigments, p. 181-196. In: D.J. Lea and R.C. Leegood (eds.). Plant biochemistry and molecular biology. John Wiley & Sons Ltd. UK.
Hertog, M.G.L. and M.B. Kata. 1998. Quercetin in foods, cardiovascular disease and cancer, p. –447-467. In: C.A. Rice-Evans. and L. Packer (eds.). Flavonoids in health and disease. Marcel Dekler, Inc. New York, NY.
Hughes, P.A., and R.F. Sandsted. 1975. Effect of temperature, relative humidity, and light on the color of ‘California Light Red Kidney ‘ bean seed during storage.
Hortscince 10(4): 421-423.
Jovanovic, S.V., S. Steenken, M.G. Simic, and Y. Hara. 1998. Antioxidant properties of flavonoids: reduction potentials and electron transfer reactions of flavonoid redicals, p. 137-177. In: C.A. Rice-Evans. and L. Packer (eds.). Flavonoids in health and disease. Marcel Dekler, Inc. New York, NY.
Kantha, S.S., and J.W. Erdman. 1987. Legume carotenoids. CRC Critical Reviews in Food Science and Nutrition 26, Issue 2: 137-155.
Koehler, H.H., C-H. Chang, G. Scheier, and D.W. Burke. 1987. Nutrient composition, protein quality, and sensory properties of thirty-six cultivars of dry beans (Phaseolus vulgaris L.). Journal of Food Science 52, No. 5: 1335-1340.
Markham, K.R. 1975. Isolation techniques for flavonoids, p. 1-45. In: J.B. Harbone, T.J Marby, and H Mabry. (eds.). The flavonoids, Part 1. Academic Press. New York, NY.
McClure, W.J. 1975. Physiology and functions of flavonoids, p. 970-1055. In: : J.B. Harbone, T.J Marby, and H Mabry. (eds.). The flavonoids, Part 1. Academic Press. New York, NY.
Morel, L, P. Cillary, and J. Cillard. 1998. Flavonoid-metal interactions in biological system, p. 163-197. In: C.A. Rice-Evans. and L. Packer (eds.). Flavonoids in health and disease. Marcel Dekler, Inc. New York, NY.
Morris, H.J. and E.R. Wood. 1955. Influence of moisture content on keeping quality of dry beans. Food Technology (May): 225-229.
Pietta, P. 1998. Flavonoids in medicinal plants, p. 61-110. In: C.A. Rice-Evans. and L. Packer (eds.). Flavonoids in health and disease. Marcel Dekler, Inc. New York, NY.
Prakken, R. 1974. Inheritance of colors in Phaseolus vulgaris L. IV Recombination within the ‘complex locus C’. Medelingen Landbouhogescholl. Wageningen, Nederland. Salisbury, B.F. and C.W. Ross. 1991. Plant physiology. 4th ed. Wadsworth Publishing
Company. Belmont, California.
Samman, S., P.M.L. Wall, and N.C. Cook 1998. Flavonoids and coronary heart diseases: dietary perspectives, p. 469-481. In: C.A. Rice-Evans. and L. Packer (eds.). Flavonoids in health and disease. Marcel Dekler, Inc. New York, NY.
SAS Institute Inc. 1992. SAS™ procedures guide, Release 6.03 Edition. SAS Institute Inc., Carry, NC.
Schwartz, H. F., M.A. Brick, D.S. Nuland, and D.B. Franc.1996. Dry bean production and pest management. Coordinated by the central high plains dry bean and beet group regional bulletin 562A. Cooperative extension research center. CSU, Fort Collins. Smartt, J. 1988. Morphological, physiological and biochemical changes in phaseoulus
beans under domestication, p. 143-161. In: P. Gepts (ed.). Genetic resources of Phaseolus beans. Kluwer Academic Publishers. Dordrecht, Holland.
Swain, T. 1976. Flavonoids, p. 165-206. In. T.W. Goodwin (ed.). Chemistry and biochemistry of plant pigments. Academic Press. England.
Timberlake, C.F. and P. Bride. 1975. The anthocyanins, p. 214-266. In: J.B. Harbone, T.J Marby, and H Mabry. (eds.). The flavonoids, Part 1. Academic Press. New York, NY.
Wong, E. 1975. The isoflavonoids, p. 743-800. In: D.J. Lea and R.C. Leegood (eds.). Plant biochemistry and molecular biology. John Wiley and Sons Ltd.
Table 1. Seed samples, their lots and number of times thin layer paper chromatography (TLC) was run for identification of the plant pigments (flavonoids, carotenes and xanthophylls) in the seed coat of Pinto beans.
Seed lots Seed samples The TLC runs
Scotsbluff well-colored NE 94-4 2 Ogallala well-colored NE 94-4 discolored NE 94-4 well-colored UI 114 2 2 2 Lincoln (Horticulture greenhouses) well-colored NE 94-4 discolored NE 94-4 well-colored UI 114 discolored UI 114 3 3 3 3
Table 2. ANOVA for the misting experiment.
Class level information
Class Replication Column Treatment Variety/Line Plant Pod Levels 9 6 2 2 2 4 Value 1 2 3 4 5 6 7 8 9 1 2 3 4 5 6 mist vs. control UI 114 NE 94-4 1 2 1 2 3 4
Covariance parameter estimates (RML)
Cov Parm REP*COL*TRT PLANT(REP*COL*TRT*VAR) Residual Estimate 0.000000000 42.36616509 33.61913123
Tests of fixed effects
Source REP COL TRT VAR TRT*VAR POD TRT*POD VAR*POD TRT*VAR*POD NDF 6 3 1 1 1 3 3 3 3 DDF 5 5 5 52 52 204 204 204 204 Type III F 0.46 1.09 1.31 6.70 0.89 0.53 1.80 2.63 0.80 Pr > F 0.8158 0.4334 0.3043 0.0125 0.3495 0.6631 0.1485 0.0512 0.4977
Table 3. ANOVA for the injection experiment.
Class level information
Class Replication Treatment Variety/LinePod Levels 12 3 2 3 Value 1 2 3 4 5 6 7 8 9 10 11 12 control injury in.water UI 114 NE 94-4 1 2 3
Covariance parameter estimates (REML)
Cov Parm REP*TRT*VAR Residual Estimate 4.84682941 18.8185910
Tests of fixed effects
Source REP TRT VAR TRT*VAR POD TRT*POD VAR*POD TRT*VAR*POD NDF 11 2 1 2 2 4 2 4 DDF 55 55 55 55 132 132 132 132 Type III 1.91 4.01 5.40 0.44 0.52 1.01 0.31 0.62 Pr > F 0.0582 0.0238 0.0239 0.6440 0.5955 0.4057 0.7376 0.6521
Table 4. ANOVA for the moistened seed experiment.
Class level information Class Replication Variety/Line Treatment Levels 4 2 2 Value 1 2 3 4 UI 114 NE 94-4 Control vs. moistened
Covariance parameter estimates (REML) Cov Parm
Residual
Estimate
47.09265176
Tests of fixed effects Class REP VAR TRT VAR*TRT NDF 3 1 1 1 DDF 313 313 313 313 Type III F 2.78 2534.39 2943.37 2518.01 Pr > F 0.0413 0.0001 0.0001 0.0001
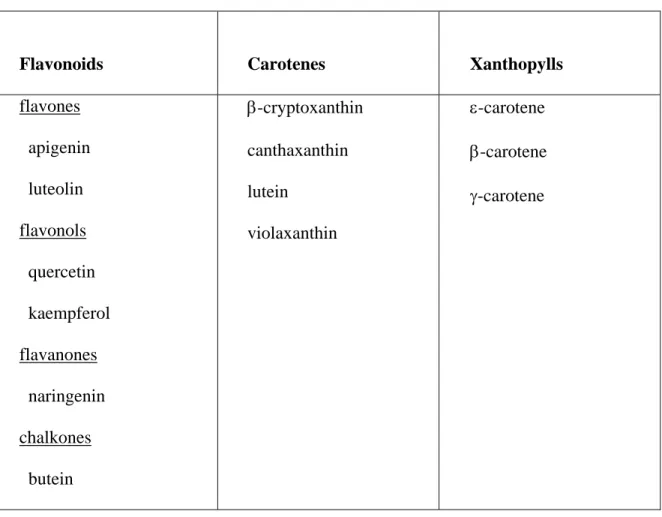
Table 5. Yellow pigments identified in well-colored NE 94-4 bean seed coat testa (greenhouse-grown) in winter 1998.
Flavonoids Carotenes Xanthopylls
flavones apigenin luteolin flavonols quercetin kaempferol flavanones naringenin chalkones butein β-cryptoxanthin canthaxanthin lutein violaxanthin ε-carotene β-carotene γ-carotene
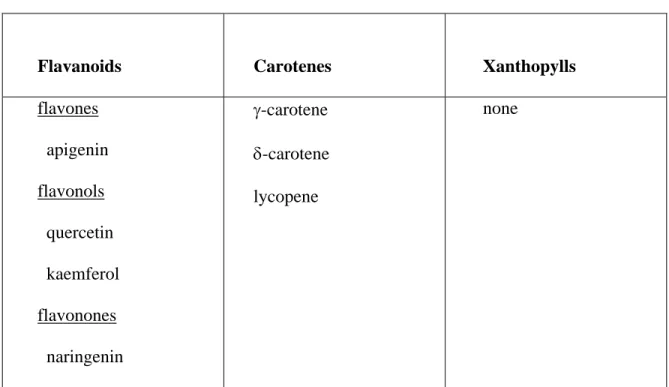
Table 6. Yellow pigments identified in well-colored NE 94-4 bean seed coat testa (greenhouse-grown) in summer 1998.
Flavanoids Carotenes Xanthopylls
flavones apigenin flavonols quercetin kaemferol flavonones naringenin γ-carotene δ-carotene lycopene none
Table 7. Yellow pigments identified in yellowed NE 94-4 bean seed coat testa (greenhouse-grown) in summer 1998.
Flavanols Carotenes Xanthophylls
flavonols quercetin kaemferol flavonones naringenin aurones sulphuretin γ-carotene δ-carotene lycopene none
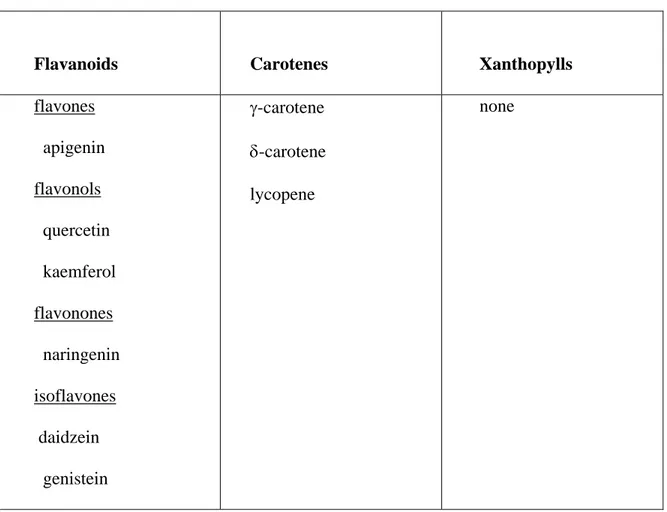
Table 8. Yellow pigments identified in UI 114 bean seed coat testa (greenhouse-grown) in summer 1998.
Flavanoids Carotenes Xanthopylls
flavones apigenin flavonols quercetin kaemferol flavonones naringenin isoflavones daidzein genistein γ-carotene δ-carotene lycopene none
Figure 2. Percentage of seed coat yellowing of 8 field-grown pinto bean varieties/lines (1997). LSD .05=17.55 0 10 20 30 40 50 60
Apache Bill Z Buckskin Chase NE 94-4 Rogers 179 Vision Winchester
varieties/lines area of testa y ellowin g ( % )
Figure 3. Percentage of seed yellowing of seed coat of two bean entries under different treatments in the misting experiment.
0 2 4 6 8 10 12
NE 94-4 control UI 114 control NE 94-4 mist UI 114 mist
variety/line area of testa y ellowin g( % ) mean +/- std error
Figure 4. Percentage of seed yellowing of seed coat of bean entries under different treatments in the injection experiment.
-1 0 1 2 3 4 5 6 7 NE 94-4 control
UI 114 control NE 94-4 injury UI 114 injury NE 94-4 in. of water
UI 114 in. of water
variety/line
area of testa yellowing (%)
Figure 5. Percentage of seed yellowing of seed coat of two bean entries under different treatments in the moistened filter paper experiment.
-10 0 10 20 30 40 50 60 70 80 90
NE 94-4 control UI 114 control NE 94-4 moistened UI 114 moistened
variety/line
area of testa yellowing (%)
Appendix 1. The mixed procedure of SAS™, least squares means, frequency tables and analysis for the misting experiment.
The MIXED Procedure
Class Level Information Class Levels Values
REP 9 1 2 3 4 5 6 7 8 9 COL 6 1 2 3 4 5 6 TRT 2 CONTROL MIST VAR 2 94-4 UI-114 PLANT 2 1 2 POD 4 1 2 3 4
REML Estimation Iteration History
Iteration Evaluations Objective Criterion 0 1 1453.3916474
1 2 1362.1466914 0.00000000 Convergence criteria met.
Covariance Parameter Estimates (REML) Cov Parm Estimate REP*COL*TRT 0.00000000 PLA(REP*COL*TRT*VAR) 42.36616509 Residual 33.61913123 Model Fitting Information for YELLOW Description Value Observations 288.0000 Res Log Likelihood -920.916 Akaike's Information Criterion -923.916 Schwarz's Bayesian Criterion -929.263 -2 Res Log Likelihood 1841.833 Tests of Fixed Effects
Source NDF DDF Type III F Pr > F REP 6 5 0.46 0.8158
Tests of Fixed Effects
Source NDF DDF Type III F Pr > F COL 3 5 1.09 0.433
TRT 1 5 1.31 0.3043 VAR 1 52 6.70 0.0125 TRT*VAR 1 52 0.89 0.3495 POD 3 204 0.53 0.6631 TRT*POD 3 204 1.80 0.1485 VAR*POD 3 204 2.63 0.0512 TRT*VAR*POD 3 204 0.80 0.4977 Least Squares Means
Effect TRT VAR POD LSMEAN Std Error DF t TRT*POD CONTROL 1 1.62557870 1.48285086 204 1.10 TRT*POD CONTROL 2 3.76446759 1.48285086 204 2.54 TRT*POD CONTROL 3 4.63946759 1.48285086 204 3.13 TRT*POD CONTROL 4 2.96817130 1.48285086 204 2.00 TRT*POD MIST 1 6.28182870 1.48285086 204 4.24 TRT*POD MIST 2 5.30497685 1.48285086 204 3.58 TRT*POD MIST 3 5.01331019 1.48285086 204 3.38 TRT*POD MIST 4 4.55034722 1.48285086 204 3.07 VAR*POD 94-4 1 6.81944444 1.45282576 204 4.69 VAR*POD 94-4 2 5.22685185 1.45282576 204 3.60 VAR*POD 94-4 3 7.98611111 1.45282576 204 5.50 VAR*POD 94-4 4 5.73611111 1.45282576 204 3.95 VAR*POD UI-114 1 1.08796296 1.45282576 204 0.75 VAR*POD UI-114 2 3.84259259 1.45282576 204 2.64 VAR*POD UI-114 3 1.66666667 1.45282576 204 1.15 VAR*POD UI-114 4 1.78240741 1.45282576 204 1.23 Least Squares Means
Pr > |t| 0.2743 0.0119 0.0020 0.0466 0.0001 0.0004 0.0009 0.0024 0.0001
Least Squares Means Pr > |t| 0.0004 0.0001 0.0001 0.4548 0.0088 0.2526 0.2213
Differences of Least Squares Means
TRT*POD CONTROL 1 CONTROL 2 -2.13888889 TRT*POD CONTROL 1 CONTROL 3 -3.01388889 TRT*POD CONTROL 1 CONTROL 4 -1.34259259 TRT*POD CONTROL 1 MIST 1 -4.65625000 TRT*POD CONTROL 1 MIST 2 -3.67939815 TRT*POD CONTROL 1 MIST 3 -3.38773148 TRT*POD CONTROL 1 MIST 4 -2.92476852 TRT*POD CONTROL 2 CONTROL 3 -0.87500000 TRT*POD CONTROL 2 CONTROL 4 0.79629630 TRT*POD CONTROL 2 MIST 1 -2.51736111 TRT*POD CONTROL 2 MIST 2 -1.54050926 TRT*POD CONTROL 2 MIST 3 -1.24884259 TRT*POD CONTROL 2 MIST 4 -0.78587963 TRT*POD CONTROL 3 CONTROL 4 1.67129630 TRT*POD CONTROL 3 MIST 1 -1.64236111 TRT*POD CONTROL 3 MIST 2 -0.66550926 TRT*POD CONTROL 3 MIST 3 -0.37384259 TRT*POD CONTROL 3 MIST 4 0.08912037 TRT*POD CONTROL 4 MIST 1 -3.31365741 TRT*POD CONTROL 4 MIST 2 -2.33680556 TRT*POD CONTROL 4 MIST 3 -2.04513889 TRT*POD CONTROL 4 MIST 4 -1.58217593 TRT*POD MIST 1 MIST 2 0.97685185 TRT*POD MIST 1 MIST 3 1.26851852 TRT*POD MIST 1 MIST 4 1.73148148 TRT*POD MIST 2 MIST 3 0.29166667 TRT*POD MIST 2 MIST 4 0.75462963 TRT*POD MIST 3 MIST 4 0.46296296 VAR*POD 94-4 1 94-4 2 1.59259259 VAR*POD 94-4 1 94-4 3 -1.16666667 VAR*POD 94-4 1 94-4 4 1.08333333 VAR*POD 94-4 1 UI-114 1 5.73148148
Differences of Least Squares Means
Effect TRT VAR POD _TRT _VAR _POD Difference VAR*POD 94-4 1 UI-114 2 2.97685185 VAR*POD 94-4 1 UI-114 3 5.15277778 VAR*POD 94-4 1 UI-114 4 5.03703704 VAR*POD 94-4 2 94-4 3 -2.75925926 VAR*POD 94-4 2 94-4 4 -0.50925926 VAR*POD 94-4 2 UI-114 1 4.13888889 VAR*POD 94-4 2 UI-114 2 1.38425926 VAR*POD 94-4 2 UI-114 3 3.56018519 VAR*POD 94-4 2 UI-114 4 3.44444444 VAR*POD 94-4 3 94-4 4 2.25000000 VAR*POD 94-4 3 UI-114 1 6.89814815 VAR*POD 94-4 3 UI-114 2 4.14351852 VAR*POD 94-4 3 UI-114 3 6.31944444 VAR*POD 94-4 3 UI-114 4 6.20370370 VAR*POD 94-4 4 UI-114 1 4.64814815 VAR*POD 94-4 4 UI-114 2 1.89351852 VAR*POD 94-4 4 UI-114 3 4.06944444
VAR*POD 94-4 4 UI-114 4 3.95370370 VAR*POD UI-114 1 UI-114 2 -2.75462963 VAR*POD UI-114 1 UI-114 3 -0.57870370 VAR*POD UI-114 1 UI-114 4 -0.69444444 VAR*POD UI-114 2 UI-114 3 2.17592593 VAR*POD UI-114 2 UI-114 4 2.06018519 VAR*POD UI-114 3 UI-114 4 -0.11574074
Differences of Least Squares Means Std Error DF t Pr > |t| 1.36664901 204 -1.57 0.1191 1.36664901 204 -2.21 0.0285 1.36664901 204 -0.98 0.3271 2.13868683 204 -2.18 0.0306 2.13868683 204 -1.72 0.0869 2.13868683 204 -1.58 0.1147 2.13868683 204 -1.37 0.1730 1.36664901 204 -0.64 0.5227 1.36664901 204 0.58 0.5608 2.13868683 204 -1.18 0.2405 2.13868683 204 -0.72 0.4722 2.13868683 204 -0.58 0.5599 2.13868683 204 -0.37 0.7137 1.36664901 204 1.22 0.2228 2.13868683 204 -0.77 0.4434
Differences of Least Squares Means Std Error DF t Pr > |t| 2.13868683 204 -0.31 0.7560 2.13868683 204 -0.17 0.8614 2.13868683 204 0.04 0.9668 2.13868683 204 -1.55 0.1228 2.13868683 204 -1.09 0.2758 2.13868683 204 -0.96 0.3401 2.13868683 204 -0.74 0.4603 1.36664901 204 0.71 0.4756 1.36664901 204 0.93 0.3544 1.36664901 204 1.27 0.2066 1.36664901 204 0.21 0.8312 1.36664901 204 0.55 0.5814 1.36664901 204 0.34 0.7351 1.36664901 204 1.17 0.2452 1.36664901 204 -0.85 0.3943 1.36664901 204 0.79 0.4289 2.05460589 204 2.79 0.0058 2.05460589 204 1.45 0.1489 2.05460589 204 2.51 0.0129 2.05460589 204 2.45 0.0151 1.36664901 204 -2.02 0.0448
1.36664901 204 -0.37 0.7098 2.05460589 204 2.01 0.0453 2.05460589 204 0.67 0.5012 2.05460589 204 1.73 0.0846 2.05460589 204 1.68 0.0952 1.36664901 204 1.65 0.1012 2.05460589 204 3.36 0.0009 2.05460589 204 2.02 0.0450 2.05460589 204 3.08 0.0024 2.05460589 204 3.02 0.0029 2.05460589 204 2.26 0.0247 2.05460589 204 0.92 0.3578 2.05460589 204 1.98 0.0490 2.05460589 204 1.92 0.0557 1.36664901 204 -2.02 0.0452 1.36664901 204 -0.42 0.6724 1.36664901 204 -0.51 0.6119 1.36664901 204 1.59 0.1129 1.36664901 204 1.51 0.1332 1.36664901 204 -0.08 0.9326 --- TRT=CONTROL --- Frequency 60 ˆ ** ‚ ** ‚ ** ‚ ** ‚ ** 50 ˆ ** ‚ ** ‚ ** ‚ ** ‚ ** 40 ˆ ** ‚ ** ‚ ** ‚ ** ** ‚ ** ** 30 ˆ ** ** ‚ ** ** ‚ ** ** ‚ ** ** ‚ ** ** ** 20 ˆ ** ** ** ‚ ** ** ** ‚ ** ** ** ‚ ** ** ** ‚ ** ** ** ** 10 ˆ ** ** ** ** ‚ ** ** ** ** ** ‚ ** ** ** ** ** ‚ ** ** ** ** ** ** ** ‚ ** ** ** ** ** ** ** ** ** ** ** Šƒƒƒƒƒƒƒƒƒƒƒƒƒƒƒƒƒƒƒƒƒƒƒƒƒƒƒƒƒƒƒƒƒƒƒƒƒƒƒƒƒƒƒƒƒƒƒƒƒƒƒƒƒƒƒƒƒƒƒƒƒƒƒƒƒƒ
0 5 10 15 20 25 30 35 0 5 10 15 20 25 30 35 YELLOW Midpoint ‚ƒƒƒƒƒƒƒƒ 94-4 ƒƒƒƒƒƒƒ‚ ‚ƒƒƒƒƒƒƒ UI-114 ƒƒƒƒƒƒ‚ VAR --- TRT=MIST --- Frequency ‚ ** ‚ ** ‚ ** 60 ˆ ** ** ‚ ** ** ‚ ** ** ‚ ** ** ‚ ** ** 50 ˆ ** ** ‚ ** ** ‚ ** ** ‚ ** ** ‚ ** ** 40 ˆ ** ** ‚ ** ** ‚ ** ** ‚ ** ** ‚ ** ** 30 ˆ ** ** ‚ ** ** ‚ ** ** ‚ ** ** ‚ ** ** 20 ˆ ** ** ‚ ** ** ‚ ** ** ‚ ** ** ‚ ** ** 10 ˆ ** ** ** ‚ ** ** ** ** ‚ ** ** ** ** ‚ ** ** ** ** ‚ ** ** ** ** ** ** ** ** Šƒƒƒƒƒƒƒƒƒƒƒƒƒƒƒƒƒƒƒƒƒƒƒƒƒƒƒƒƒƒƒƒƒƒƒƒƒƒƒƒƒƒƒƒƒƒƒƒƒƒƒƒƒƒƒƒƒƒƒƒƒƒƒƒƒƒ 6 18 30 42 54 66 78 90 6 18 30 42 54 66 78 90 YELLOW Midpoint ‚ƒƒƒƒƒƒƒƒ 94-4 ƒƒƒƒƒƒƒ‚ ‚ƒƒƒƒƒƒƒ UI-114 ƒƒƒƒƒƒ‚ VAR
Analysis Variable : YELLOW
--- TRT=CONTROL VAR=94-4 ---
--- 72 4.4629630 6.0546689 36.6590158 ---
--- TRT=CONTROL VAR=UI-114 ---
N Mean Std Dev Variance --- 72 1.7013889 4.6438862 21.5656788 ---
--- TRT=MIST VAR=94-4 ---
N Mean Std Dev Variance --- 72 8.4212963 14.4517700 208.8536559 ---
--- TRT=MIST VAR=UI-114 ---
N Mean Std Dev Variance --- 72 2.4884259 4.7295666 22.3688000 ---
Appendix 2. The mixed procedure of SAS™, least squares means, frequency tables and analysis for the injection experiment.
The MIXED Procedure Class Level Information Class Levels Values
REP 12 1 10 11 12 2 3 4 5 6 7 8 9 TRT 3 CONTROL INONLY INWATER VAR 2 94-4 UI-114
POD 3 1 2 3
REML Estimation Iteration History
Iteration Evaluations Objective Criterion 0 1 848.14738265
1 1 841.34022594 0.00000000 Convergence criteria met.
Covariance Parameter Estimates (REML) Cov Parm Estimate
REP*TRT*VAR 4.84682941 Residual 18.81859100
Model Fitting Information for YELLOW Description Value Observations 216.0000 Res Log Likelihood -592.512 Akaike's Information Criterion -594.512 Schwarz's Bayesian Criterion -597.743 -2 Res Log Likelihood 1185.023
Tests of Fixed Effects
Source NDF DDF Type III F Pr > F REP 11 55 1.91 0.0582 TRT 2 55 4.01 0.0238
VAR 1 55 5.40 0.0239 TRT*VAR 2 55 0.44 0.6440 POD 2 132 0.52 0.5955 TRT*POD 4 132 1.01 0.4057
Tests of Fixed Effects
Source NDF DDF Type III F Pr > F VAR*POD 2 132 0.31 0.7376 TRT*VAR*POD 4 132 0.62 0.6521
Least Squares Means
Effect TRT VAR POD LSMEAN Std Error DF t TRT*POD CONTROL 1 1.61111111 0.99300513 132 1.62 TRT*POD CONTROL 2 2.66666667 0.99300513 132 2.69 TRT*POD CONTROL 3 1.49305556 0.99300513 132 1.50 TRT*POD INONLY 1 1.43055556 0.99300513 132 1.44 TRT*POD INONLY 2 1.05555556 0.99300513 132 1.06 TRT*POD INONLY 3 0.20833333 0.99300513 132 0.21 TRT*POD INWATER 1 4.59027778 0.99300513 132 4.62 TRT*POD INWATER 2 2.43750000 0.99300513 132 2.45 TRT*POD INWATER 3 3.76388889 0.99300513 132 3.79 VAR*POD 94-4 1 3.20833333 0.81078529 132 3.96 VAR*POD 94-4 2 2.90740741 0.81078529 132 3.59 VAR*POD 94-4 3 3.04166667 0.81078529 132 3.75 VAR*POD UI-114 1 1.87962963 0.81078529 132 2.32 VAR*POD UI-114 2 1.19907407 0.81078529 132 1.48 VAR*POD UI-114 3 0.60185185 0.81078529 132 0.74
Least Squares Means Pr > |t| 0.1071 0.0082 0.1351 0.1521 0.2897 0.8341 0.0001 0.0154 0.0002 0.0001 0.0005 0.0003 0.0220 0.1415 0.4592