» « i «iM-iW' S ^ é it ti штіт ^ ^ . ' - y 0 > i i Ч ^ w«' T y p ^ i O L f
T P V fP P /;'УПі ГЧі17У||нр SMfışn^'fOV
. - / . J /-»' .ίϊ^ - ^ ^ U i s m ä U í r J \ L / ü - ^ ¿ a í i • - . , ,. · ^ 'j J J ,;^,-’'J c ; ; · гѵ-^л=;. "fr,. . ~··· iEFFECTS OF THE CUSTOMS UNION ON TURKISH TEXTILE AND CLOTHING INDUSTRY
A THESIS
SUBMITTED TO THE DEPARTMENT OF MANAGEMENT AND GRADUATE SCHOOL OF BUSINESS ADMINISTRATION
OF BiLKENT UNIVERSITY
IN PARTIAL FULFILLMENT OF THE REQUIREMENTS FOR THE DEGREE OF
MASTER OF BUSINESS ADMINISTRATION
By
UĞUR TOZŞEKERLÎ
I certify that I have read this thesis and that in my opinion it is fully adequate, in scope and in quality, as a thesis for the degree of Master of Business Administration.
I certify that I have read this thesis and that in my opinion it is fully adequate, in scope and in quality, as a thesis for the degree of Master of Business Administration.
Assist. Prof. Gülnur Muradoglu
I certify that I have read this thesis and that in my opinion it is fully adequate, in scope and in quality, as a thesis for the degree of Master of Business Administration.
Approved by Dean of the Graduate School of Business Administration.
v/ /
ABSTRACT
EFFECTS OF THE CUSTOMS UNION ON TURKISH TEXTILE AND CLOTHING INDUSTRIES
Uğur Tozşekeri!
M.B.A.
Supervisor: Assoc. Prof. Gökhan Çapoğlu
June 1994
Turkish textile and clothing industries are expected to be affected by the Customs Union from several aspects. In this study, both positive and negative possible consequences of the Union have been evaluated. Besides, some necessary precautions, which can be taken in order to increase the competitiveness of the Turkish textile and clothing industries in the international markets, have been proposed.
ÖZET
GÜMRÜK BİRLİĞİNİN TÜRK TEKSTİL VE KONFEKSİYON SEKTÖRLERİNE ETKİLERİ
Danışman; Doç.Dr. Gökhan Çapoğlu
Türk tekstil ve konfeksiyon sektörleri Gümrük Birliğinden bir çok biçimde etkileneceklerdir. Bu çalışmada Birliğin getireceği olası olumlu ve olumsuz sonuçlar incelenmiş, ayrıca, bu sektörlerinin uluslararası pazarlardaki rekabet edebilme gücünün arttırmak için alınabilecek olan önlemler sunulmuştur.
ACKNOWLEDGMENT
I would like to thank my thesis supervisor Assoc. Prof. Gökhan Çapoğlu for his guidance and patience throughout this study.
I also would like to thank to Gonca Işık Yılmaz for her valuable comments and for the time she spent for editing.
ABSTRACT...i
ÖZET...ii
ACKNOWLEDGMENT... iii
I. INTRODUCTION... 3
I. l DEFINITION OF TEXTILE AND CLOTHING INDUSTRIES...4
II. WORLD CLOTHING INDUSTRY...5
II. I WORLD CLOTHING TRADE... 5
11.2 TRENDS IN THE IMPORTS OF THE DEVELOPED COUNTRIES... 7
11.2.1 The Main Exporters... 7
11.2.2 The Main Importers... 8
III. TURKISH CLOTHING INDUSTRY... ... 9
III. I PRODUCTION... 10
111.2 CAPACITY UTILIZATION RATIOS (CUR)... 15
111.3 EMPLOYMENT...17
111.3.1 Cost of Labor in the Textile Industry... 19
111.3.2 Cost of Labor in the Clothing Industry... 23
111.4 TRENDS IN FOREIGN TRADE... 25
m.4.1 Export... 25
111.4.1.1 Distribution of Exports Among the Countries... 27
111.4.1.2 Turkey’s Position in the EC Market... 31
111.4.2 Distribution of Imports Among the Countries... 35
IV. FACTORS AFFECTING EXPORT OF TURKEY...37
IV. 1 THE CONCEPT OF GLOBALIZATION IN TEXTILE MARKETS...37
IV.2 EC TEXTILE POLICIES... 40
IV.2.1 EC’s Textile Policy Toward the Eastern European Countries... 40
IV.2.2 Effects of the EC Policies and the Globalization...43
IV.2.2.1 Short and Medium Range Effects... 43
IV.2.2.2 Long Term Effects...43
IV. 3 THIRD WORLD COUNTRIES AND EUROPEAN MARKET... 44
V. EFFECTS OF CUSTOMS UNION... 45
V. 1 REMOVAL OF PROTECTION AGAINST EC GOODS... 45
V.2 COMMON EXTERNAL TARIFFS...46
V.3 QUOTA FOR THE THIRD PARTIES...48
V.4 IMPOSING OF ANTIDUMPING TA X ...49
V.5 REMOVAL OF IMPORT INCENTIVES...50
V.6 USA QUOTAS... 51
V. 7 REMOVAL OF QUOTAS... 51
VI. MEASURES AND NEW STRATEGIES... 53
VI. 1 FUNCTIONAL MEASURES... 53
VI. 1.1 Industrial Policy Toward EC... 53
VI. 1.2 Marketing Policies...53
VI.1.3 Finance Policies... 54
VI.2.1 Education Institutions... 55 VI.2.2 Research and Development Institutions...55 VII. CONCLUSION...56
I. INTRODUCTION
The objective of this study is to investigate the macro effects of the Customs Union, between Turkey and EC, on the Turkish textile and clothing industry. Being the driving power of the Turkish manufacturing industry, textile and clothing have been expected to be affected by this union from several aspects. Since these effects may lead to positive or negative consequences, along this study both scenarios have been examined in order to name the necessary measures to be taken.
This study consists of five sections. The first section provides general information about the structure of the world clothing industry. In the second section, the place of the textile and clothing industry in the Turkish economy is explained depending on the related information and data. The third section examines the relationship between the export of Turkey and trends in globalization in the European markets. In addition, the effects of the recent developments in the European textile and clothing markets, and EC textile policy are further detailed. The fourth section deals with the effects of the 1995 Turkey- EC customs union on the Turkish textile and clothing industry. Finally, in the fifth section, possible alternative actions that can be taken are discussed.
The sub-sectors of both the textile and the clothing industries can be classified as I.l DEFINITION OF TEXTILE AND CLOTHING INDUSTRIES
follows;
A. TEXTILE
I. Man-made fibers
II. Threads (Yarns)
• Wool • Cotton • Silk • Synthetic • Jute III. Woven • Wool • Cotton
• Silk and Synthetic
• Carpets and Kilims
IV. Knitting
B. CLOTHING
I. ICnitted or Crocheted
• Fabrics
The clothing industry has historically played a significant role in the industrial development of many developing countries. Especially, the early industrialization efforts of the NICs are accepted to have benefited substantially from the dynamic export- oriented expansion of their clothing industry, which has encouraged other developing countries to follow the same path.
These developments have long been one of the key sources of tension in the North-South trading relations due to the increasing unemployment in the developed countries. Trade barriers have by no means totally removed the threat of low wage imports, since for most countries, these barriers have been permeable rather than absolute. Manufacturers and capital goods suppliers have become increasingly preoccupied with the search for cost reduction via technological change.
Given the low wages in the developing countries, it is easy to see that the source of the tension lies in the degree of labor intensiveness in the assembly stage of clothing production, which accounts for more than 35% of total costs. The importance stems from the fact that the developing country exporters face only slightly lower material costs and use the technology that is essentially the same. Matters of quality and flexibility, although important as the source of competitive strength in export markets, are outweighed by the labor costs effect on competitiveness for most product categories in most price ranges.
II. WORLD CLOTHING INDUSTRY
II. 1 WORLD CLOTHING TRADE
In 1963, the volume of international trade in clothing was about $ 2.2 billion, 80% of this trade originated in developing countries. In the 1970s, the picture had changed
remarkably and by 1978 the international trade in clothing had grown swiftly to $ 28.3 billion, whereas the share of developed countries in total exports had declined to 51%. By 1989, the international trade had risen to $ 98 billion, and the share of the developed countries fell to 39 %. Until 1984, the intra-trade among the developed countries constituted the largest portion of the total trade. However, the increase in the exports of the developing countries had caused an impressive reversal in this trend ( Table 1).
In 1989 shares of the world trade by main areas, where the developed countries are the main markets for the exports of clothing, and the developing countries are the main suppliers, can be traced from Table 2.
Table 1
Distribution o f World Trade in Clothing (bn. $ 1989)
ORIGIN DESTINATION
DEVELOPED DEVELOPING WORLD
WORLD 82.3 10.00 97.25
DEVELOPED COUNTRIES 34.2 3.75 38.45
DEVELOPING COUNTRIES 39.7 2.50 43.70
Source: Duruiz, L. and Yenturk, N. (1992), Facing the Challenge (taken from GATT, 1991)
Table 2
The Shares of Imports of Clothing o f Developed Countries %
II.2 TRENDS IN THE IMPORTS OF THE DEVELOPED COUNTRIES
Table 3 displays the growth trend in imports of the developed countries from 1985 to 1990. Although the composition did not show a great deal of change, both developed and developing countries lost a little of their shares to the Eastern Trade Areas during this period. However, the composition in 1990 might be an indication for increase in the competitiveness of the developed countries under new conditions.
II.2.1 The Main Exporters
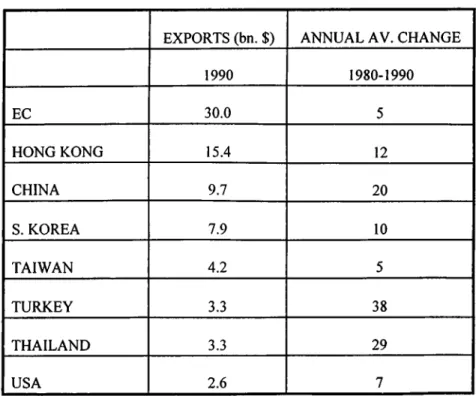
During 1980-1990, clothing exports from the developing countries ( excluding NICs ) showed a remarkable rise ( Table 3 ). In 1990, the EC ( mainly Italy, Germany, France, UK, and Portugal) with $ 30 billion of clothing exports, took the first place. The EC exports of clothing in value rose moderately during 1980-1990.
Table 3 Leading Exporters o f Clothing and Annual Rates o f Change
EXPORTS (bn. $) ANNUAL AV. CHANGE
1990 1980-1990 EC 30.0 5 HONG KONG 15.4 12 CHINA 9.7 20 S. KOREA 7.9 10 TAIWAN 4.2 5 TURKEY 3.3 38 THAILAND 3.3 29 USA 2.6 7
Hong Kong continued to be the second largest exporter with about 13% of the world clothing trade in 1990. It is significant that between 1980 and 1990 Turkey moved from twentieth to ninth position among the leading exporters of clothing with an annual average of 38%. In 1989, export growth regained its momentum and recovery came with a 22% annual increase in 1990. New market conditions and government policies designed to move Turkey towards external markets have started to influence competitiveness of the country. Today, Turkey ranks fifth among the developing countries after Hong Kong, China, South Korea, and Taiwan.
11.2.2 The Main Importers
The clothing trade has been highly concentrated in certain areas. Eight countries have accounted for more than 80% of clothing imports ( Table 4 ). The EC has, by far, dominated the world clothing imports, taking more than one third of total.
Table 4
Leading Importers o f Clothing ( bn. $) WORLD 113.0 EC 38.0 USA 27.0 JAPAN 8.7 HONG KONG 6.9 SWITZERLAND 3.4
Introduction of the textile industry to Turkey goes back to 1835. During the reign of Ottoman Empire, a small woolen mill named "Feshane" was first founded to produce "fezes" to the army. In 1839, this mill ( now belonging to Sumerbank, with the name of "Defterdar") was expanded by importing spinning, weaving and finishing machinery from Europe, and was recognized by the use of steam-power in 1843. This was followed by the establishment of the "Hereke Factory" in order to supply goods to the army and satisfying the needs of the Imperial Palace, such as silk upholstery, curtain fabrics, carpets, and other woven materials.
The Chinese textile machinery entered the Turkish industry first and Russian machinery was installed in Gaziantep afterwards. Machinery from Europe and USA has followed these.
After the foundation of Turkish Republic, the measures, related to the development of textile sector, were taken in the First Economic Congress in Izmir. The organizational responsibilities of the factories as Feshane, Bakirkoy and Hereke were given to the "Bank of Industry and Mines". With the help of this bank all the small plants scattered around the country had been brought under a central planning. The control mechanism was transferred to Sumerbank when it was founded in 1933. Main breakthrough in this industry had been achieved by Sumerbank Merinos Mills. The personnel sent abroad for textile education had been the founders of the industries.
III. TURKISH CLOTHING INDUSTRY
The private sector before 1950s was dominant with small scale firms. However, it developed a lot by the help of the incentives after 1950, and was more established after 1971. The export-orientation affected the structure of the textile firms. Today, in clothing sector, there are four main categories of firms. One of them is the clothing
producers and exporters. The second one is the subcontracting firms which work for domestic and foreign companies. The third one is the export-capital firms which do not produce but only deals with exporting of the goods of small firms. There are also homeworkers which are organized by individual traders.
Turkish textile and clothing industry is the steam engine of the Turkish economy. It is possible to find the relevant data to support this argument. However, along this study, in order to determine the importance of Turkish textile and clothing industry in the Turkish economy, production, capacity utilization ratio, employment and foreign trade data will be used.
III.l PRODUCTION
Eventhough it is very difficult to find any information on production in Turkey, there are several valuable studies conducted by State Statistics Institution (SSI). The production information submitted by SSI forms a base for annual government programs. Therefore, there is no doubt about validity of this information.
The production figures of Turkish T&C industries between 1984 and 1993 are given in Table 5. Graph 1, on the other hand, helps us visualize the values in Table 5 in the graphical form.
The production of Turkish textile industry in 1984, based on 1988 fixed prices, was TL 4.2 trillion . The total T&C production had increased along the years and reached TL 5.6 trillion , at the end of 1992 with an annual average of 3.8 %.
Table 5
Textile and Clothing Production (1988 Prices)
T E X T I L E C L O T H I N G T O T A L Y E A R S V a lu e (m n T L ) % C h a n g e V a lu e (m n T L ) % C h a n g e V a lu e (m n T L ) % C h a n g e 1 9 8 4 4 ,1 6 6 ,7 6 1 2 ,0 4 1 ,5 6 0 6 ,2 0 8 ,3 2 1 1 9 8 5 4 ,5 7 3 ,6 1 2 9 .7 6 2 ,2 0 7 ,1 3 0 8 .1 1 6 ,7 8 0 ,7 4 2 9 .2 2 1 9 8 6 4 ,5 6 2 ,8 3 9 - 0 .2 4 2 ,5 1 3 ,1 7 6 1 3 .8 7 7 ,0 7 6 ,0 1 5 4 .3 5 1 9 8 7 4 ,6 8 2 ,6 3 8 2 .6 3 3 ,1 4 5 ,9 2 8 2 5 .1 8 7 ,8 2 8 ,5 6 6 1 0 .6 4 1 9 8 8 5 ,1 2 3 ,6 3 8 9 .4 2 3 ,6 1 7 ,2 4 8 1 4 .9 8 8 ,7 4 0 ,8 8 6 1 1 .6 5 1 9 8 9 5 ,2 4 2 ,1 7 7 2 .3 1 4 ,4 6 0 ,6 5 1 2 3 .3 2 9 ,7 0 2 ,8 2 8 11.01 1 9 9 0 5 ,1 6 9 ,2 0 0 - 1 .3 9 4 ,4 3 1 ,7 6 4 -0 .6 5 9 ,6 0 0 ,9 6 4 -1 .0 5 1991 5 ,2 3 8 ,5 0 0 1 .3 4 4 ,9 1 1 ,2 0 0 1 0 .8 2 1 0 ,1 4 9 ,7 0 0 5 .7 2 1 9 9 2 5 ,6 2 8 ,5 0 0 7 .4 4 5 ,3 6 8 ,6 0 0 9 .3 1 1 0 ,9 9 7 ,1 0 0 8 .3 5 1 9 9 3 ^ 5 ,8 7 8 ,6 0 0 4 .4 4 5 ,9 4 1 ,4 0 0 1 0 .6 7 1 1 ,8 2 0 ,0 0 0 7 .4 8
Source : SSI (taken from the department o f Public Relations)
Developments in the clothing industry, on the other hand, have been more remarkable compared to the developments in the textile industry. Turkish clothing production increased from TL 2 trillion in 1984, to TL 5.4 trillion with an aimual average of 12.8 %.
The collective production of the textile and clothing industries had grown swiftly from 6.2 trillion to TL 11 trillion with an annual average of 7.5 %, which was higher than the growth rate of the Turkish economy during the same period.
12,000,000 10,000,000 8,000,000 6,000,000 4.000. 000 2.000. 000
TEXTILE AND CLOTHING PRODUCTION
____________________ Graph I_____________________________
T&C industry is one of the largest industries which constitute Turkish industry production. Total physical production figure for TL Turkey in 1992 was 134 trillion based on 1988 fixed prices*. Manufacturing industry had the greatest portion of this production ( TL 98.4 trillion ). Production in the manufacturing industry is classified as consumption goods, investment goods and intermediate goods. T&C industry is considered under the consumption goods category. The production of consumption goods in Turkey in 1992 was TL 35.5 trillion. On the other hand, the production value of T&C industry in 1992 was above TL 11 trillion. According to the given data, T&C industry occupied 31.8 % of consumption goods production, 11.5 % of manufacturing industry production and 8.4 % of the total production in Turkey. These values are sufficient to emphasize the size and importance of T&C industry production in the Turkish economy. The share of the T&C industry in the total Turkish production in 1992 is shown in Graph 2.
Graph 2
The S hare of
T&c
industry
27% 8% 18% 47% H O l h e r M a n u & d u r i n g I n d u s t r y I I 0 t h e r e o n s u m p t i o n C o o d s H T e x t i l e a n d C l o t t i n g H O t i e r T u r i < i s h P r o d u e f o n
The importance of the T&C industry in the Turkish economy, from the production point of view, is clear considering the aforementioned values. Another source of data which will support these figures is the production indices of several industries in the Turkish economy. Table 6 shows the changes in the Turkish T&C industry production index between 1981 and 1993 on the basis of annual production index averages and annual production index of manufacturing industry. In addition. Graph 3 shows the annual production index of Turkish T&C industry together with the advances in the production index of Turkish manufacturing industry.
According to the Production Index data which are based on 1986, the production index of T&C industry in 1981 has equaled to 71 points. This index has steadily increased and reached 116 points in 1990. However, during the 3 years following 1990, unfortunately, the production index level of 1990 could not be achieved. Although there were increases in the production index of the T&C industry in 1991, 1992 and 1993, these increases were not sufficient to surpass the decrease in 1991.
Table 6
Turkish T&C Industry Production Index (1986= 100)
T&C MANUFACTURING A/B
YEARS (A) (B) (%) 1981 71.40 65.00 109.85 1982 70.60 70.70 99.86 1983 77.70 77.70 100.00 1984 84.20 86.40 97.45 1985 89.40 90.20 99.11 1986 100.00 100.00 100.00 1987 108.40 110.70 97.92 1988 110.40 111.80 98.75 1989 113.90 114.20 99.74 1990 116.50 125.10 93.13 1991 106.50 127.40 83.59 1992 109.50 132.80 82.45 1993 110.10 134.50 81.86
Source : SSI (taken from the department o f Public Relations)
Graph 3
noducfton indices
T&C
While facing these developments in the production index of Turkish T&C industry, there has been a different tendency in the production index of Turkish manufacturing industry. Turkish manufacturing industry production index has been continuously increasing since 1981. The manufacturing industry production index, which increased 65 points in 1981, went up every year and reached 134 points in 1993.
The advances in T&C industry and manufacturing industry production indices showed similarities until 1989. As can be seen in Graph 3, it is very difficult to distinguish the advances in these sectors till 1989. However, after 1990 T&C industry production index has remained below the manufacturing industry production index. Thus, while the difference between these two indices in 1990 was 7 %, it reached 18 % in 1993. According to these data, it is easily observed that production index of T&C industry remained significantly below the production index of the manufacturing industry. This situation may be a sign of change in effectiveness of the T&C industry in total production of Turkey.
III.2 CAPACITY UTILIZATION RATIOS (CUR)
Another data base, that is constructed by SSI according to pool results, is the capacity utilization ratios of various industries.
The capacities of the Turkish fiber production and woven industries have been among the top 10 in the world^. For example, at the end of 1992, 2.4% of the world’s short fiber thread production (closed-end) capacity and 2% of the world’s open-end thread production capacity is held by Turkey^. Similarly, 2.5% of world’s “mekikli tezgah” capacity and 1.4% of world’s “mekiksiz tezgah” capacity have been established in Turkey. In addition,'^ Turkey accelerated the procedures for developing the quality of
machines used by means of the investments made in the recent years. To illustrate, Turkey is the third largest country in investing on open-end system in the world^.
This volume of capacity explains the importance of Turkey in world textile industry. Eventhough there is no robust data about the capacity of clothing industry, it is possible to claim that Turkish clothing capacity is also among the largest capacities in the world.
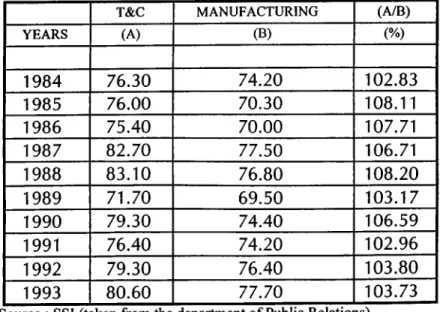
Although Turkish T&C industry has an important portion in the total established capacity, the capacity utilization ratio will determine the effectiveness of this sector. Table 7 shows the capacity utilization ratios of Turkish T&C industry and manufacturing industry. Besides, Graph 4 displays the advances in these two CURs along the years.
Table 7
Turkish T&C Industries Capacity Utilization Ratios
T&C MANUFACTURING (A/B)
YEARS (A) (B) (%) 1984 76.30 74.20 102.83 1985 76.00 70.30 108.11 1986 75.40 70.00 107.71 1987 82.70 77.50 106.71 1988 83.10 76.80 108.20 1989 71.70 69.50 103.17 1990 79.30 74.40 106.59 1991 76.40 74.20 102.96 1992 79.30 76.40 103.80 1993 80.60 77.70 103.73
Source : SSI (taken from the department o f Public Relations)
The CUR of Turkish T&C industry in 1984 was 76.3%. This rate remained above 75 % until 1993. The highest CUR of Turkish T&C industry was 83.1 % reached in 1988. On
While CUR of Turkish T&C industry witnessed these changes, CUR of manufacturing industry showed a different trend. The latter in 1984 was 74.4 %. Along the following years, it proved a highly fluctuating trend, reached its peak in 1987 by 77.5 %, its lowest in 1989 by 69.5%.
Graph 4
C apacity U tilization R atios
T&C
M AN UFA CTUR IN G
When a comparison is made between CURs of Turkish T&C industry and manufacturing industry, it is observed that former is always above the latter There is an average difference of 4 % between these two CURs. This result, once again, proves the driving power of T&C industry in Turkish manufacturing industry.
III.3 EMPLOYMENT
T&C industries have been highly labor intensive in all around the world. Eventhough the recent technological advances have caused textile industry to become capital intensive, clothing industry still keeps its labor intensive characteristic.
In the light of these determinations, the importance of the cost and the quality of the labor seems obvious in the T&C industry. According to various arguments, employment in Turkish T&C industry occupies almost 20% of the total employment in Turkish manufacturing industry. However, no legal data to support these claims is available. Eventhough it is possible to estimate the total number of employees accommodated in the textile industry approximately, it is impossible to make such an estimation for the clothing industry, where there is a tendency of hiring uninsured workers and there is a high rate of sub-contract production. It is suggested that the Turkish T&C industry has employed 2 million people.
The only solid data base about the volume of employment in T&C industry is the one constructed by Ministry of Working and Social Insurance, called as “Working Life
Statistics” Basically, these data, which are used to determine whether the unions have
a right to present an industry or not, are not reliable due to the tendency of unions’ double counting of their members to gain more power.
According to the mentioned data base, there were 3,596,459 workers employed in the manufacturing industry at the beginning of 1993'^. All of these workers were insured and registered. 351,427 of these 3.5 million workers were employed in the textile industry. According to the same data 9.8 % of the Turkish manufacturing industry was accommodated in the textile industry. If the value is doubled considering the clothing industry as well, it is observed that Turkish T&C industry has a share of 20% in total employment as suggested. This employment share constitutes an important degree for the Turkish economy and business life.
III.3.1 Cost of Labor in the Textile Industry
The cost of labor is as important as the size of employment in an industry. Table 8 examines the cost of labor of the workers who are insured and who are members of a union in various sectors in Turkey by 1st of July, 1993. However, all the data presented in this table belong to textile industry.
Table 8
Cost o f Labor in Various Sectors in Turkey
Industry Gross Wage (Av.) Labor Cost (Av.) Labor Cost Index
(TL/Year) (TL/Ycar) Textile 3,560,642 91,900,000 43.64 Wood 3,675,750 78,600,000 37.32 Glass 8,325,000 199,800,000 94.87 Cement 8,550,833 203,600,000 96.68 Leather 5,250,000 128,100,000 60.83 Food 6,718,800 145,200,000 68.95 Construction 4,905,625 149,800,000 71.13 Paper 7,308,845 175,600,000 83.38 Chemistry 8,202,469 210,600,000 100.00 Metal 5,914,350 161,500,000 76.69 Soil 4,630,000 164,300,000 78.02 Sugar 6,948,847 171,912,000 81.63 Average 6,165,930 156,742,667 74.43
Source : Confederation o f Turkish Labor Unions
As the data indicated, the monthly cost of labor in textile industry on 1.7.1993 was TL 91.9 million annually. On the same date, the lowest cost of labor in Turkey was in the wood industry with TL 78.6 million and highest cost of labor was in the chemistry industry with TL 210.6 million. The index, which assigns 100 points to the highest cost of labor for the chemistry industry, shows the cost of labor in the textile industry as 43.6. According to the index, the average cost of labor in Turkey is 74 points. Thus, the cost of labor in textile industry is only 58.6% of the cost of labor of the average in Turkey. In
other words, a worker in textile industry earns only 59% of the average wage of a worker in manufacturing industry.
Having compared the labor cost of the textile industry with that of manufacturing industry, the international dimension of this cost have been investigated in order to clarify the questions about the competitive strength of the Turkish textile industry.
A consulting firm, Werner International Inc., publishes annual reports containing spinning and weaving labor costs of many countries in the world. The last study, which investigated the cost positions in 52 countries, was conducted in 1991 and published in
1992*. The results can be summarized as follows;
• the country which had the highest cost was Sweden with $ 19.48 per hour,
• Turkey ranked 27^^ with a cost of $ 3.12 per hour,
• Western European countries placed in the top 10 with their high costs,
• the countries which had the lowest costs such as Indonesia, China, Pakistan, Sri
Lanka, Egypt, and India had increased their textile and/or clothing exports to the EC.
Analysis of the changes in the export, together with the changes in the labor costs, of the main fifteen textile product suppliers may convey valuable information for understanding the competitive strength of Turkey in European markets. Therefore, the Table 9-listing the countries, which had the highest export to EC, and their labor costs in spinning and weaving industries- has been formed.
Table 9
Main Textile Producers and Exporters o f EC and their Labor Costs
EXPORT LABOR COST
Value; 000 ecu Change $/hour Change
COUNTRY 1989 1992 92/89 1985 1991 91/85 TURKEY 795,467 571,883 -28.11 1.05 3.12 197.14 SWITZERLAND 1,322,030 1,233,661 -6.68 10.84 19.23 77.40 USA 1,227,248 1,128,011 -8.09 8.67 10.33 19.15 AUSTRIA 1,049,538 1,002,163 -4.51 8.71 15.51 78.07 AUSTRALIA 1,417,668 946,424 -33.24 7.03 11.27 60.31 INDIA 599,931 743,252 23.89 0.61 0.55 -9.84 CHINA 1,060,115 730,456 -31.10 0.21 0.34 61.90 JAPAN 720,017 686,808 -4.61 8.21 16.37 99.39 INDONESIA 193,582 425,603 119.86 0.23 0.28 21.74 PAKISTAN 419,565 421,227 0.40 0.31 0.38 22.58 S. KOREA 331,438 312,894 -5.60 1.57 3.61 129.94 TAIWAN 328,829 236,897 -27.96 1.61 5.01 211.18 EGYPT 263,793 192,070 -27.19 0.79 0.43 -45.57 THAILAND 167,185 185,122 10.73 0.53 0.87 64.15 BRAZIL 245,744 159,300 -35.18 1.43 1.53 6.99 TOTAL 10,142,150 8,975,771 -11.50 3.45 5.92 71.49
Source: Werner International, Eurostat
As it is seen from the table, Indonesia ranked first with 119 % export increase to the EC between 1989 and 1992. India, Thailand, and Pakistan followed Indonesia with 23 %, 10 %, and 1 % respectively. Other eleven countries, presented in the table, confronted contraction in their exports during the same period. The countries which faced dramatic declines in their textile export to the community, were Brazil, Australia, China, Taiwan, and Egypt with the decreases of 35 %, 33 %, 31 %, 28 %, and 27 % respectively. On the other hand, Turkey had to cope with the problem of 28 % decline in the textile export in the mentioned period.
When the labor cost is involved in the analysis, following interesting results come out;
• labor costs of all countries, except India and Egypt, had increased with an average of
71 percent,
• labor cost in the four countries, which increased their export to EC and were
mentioned before, either increased at a lower rate than the average or decreased.
Under the highlight of these observations, it can be concluded that if a country has relatively lower increases in the labor costs, t will accelerate its export to EC.
Nevertheless, USA, Brazil, China, and Egypt could not rise their exports, even though they had also relatively lower increases in their labor costs. At the first glance, this observation seems to create a conflict with the argument stated above. However, the following plausible explanations may be put forward in order to debunk the situation;
• The labor cost in USA in 1985 was $ 8.65 per hour, which was very high compared
to the other countries. Therefore, with the 19% increase (52% lower than the average) USA had 10.33 $/hr labor cost in 1992 which was still higher.
• A remarkable decrease (35 percent) in the exports of Brazil may be due to imposing
a definitive antidumping duty on imports of cotton yarn originating in Brazil by EC^
• Other two countries , China and Egypt, mostly consumed their textile products as
raw materials for their clothing industries. Besides, they expanded their clothing exports to EC.
On the other hand, 28 percent contraction in the textile export of Turkey may be due to 197 % increase in the labor costs together with the antidumping duty imposed by the EC, as in the case of Brazil.
II1.3.2 Cost of Labor in the Clothing Industry
A study - called "Hourly Labor Cost in the Apparel Industry" and conducted by Werner International Inc. in 1992- can highlight the competitive position of Turkish clothing industry from the point of labor costs
Therefore, some of the results of this study has been presented as follows;
• the country which had the highest cost was Sweden with 18.52 dollar per hour,
• Germany, Italy, France, Japan, and USA, which are the main producers and
exporters, had the costs of $ 14.81, $ 13.51, $ 12.41, $ 7.44, and $ 6.77 respectively,
• Turkey was the 28^^ highest cost country with $ 2.31 per hour,
• the lowest cost country was Indonesia, as in the textile industry, with the cost of $ 0.18 per hour,
• China ( $/hr 0.24), Pakistan ( $/hr 0.24), and India ( $/hr 0.25) were other lowest cost
countries.
In order to understand the relationship between export and labor cost in the clothing industry and to have some information about the competitive power of Turkey in the European markets, export and cost values of Turkey and other countries, which are the main suppliers of EC, have been investigated in the Table 10.
Table 10
Main Clothing Producers and Exporters o f EC and their Labor Costs
EXPORT LABOR
COST
Value; 000 ecu Change $/hour
COUNTRY 1989 1990 1991 1992 92/89 TURKEY 1,686,770 2,005,076 2,361,269 2,723,976 61.49 2.31 CHINA 1,485,583 2,130,308 3,467,869 3,491,507 135.03 0.24 HONG KONG 2,475,120 2,377,540 2,694,318 2,500,019 1.01 3.39 MOROCCO 773,047 1,022,562 1,141,649 1,256,373 62.52 0.99 TUNISIA 717,310 962,784 1,070,006 1,248,283 74.02 1.46 INDIA 816,184 987,874 1,018,072 1,126,618 38.03 0.25 POLAND 347,852 529,094 793,811 1,018,202 192.71 0.54 INDONESIA 327,969 456,803 770,087 946,390 188.56 0.18 AUSTRIA 676,726 737,870 844,260 890,484 31.59 9.84 S. KOREA 992,319 788,844 1,005,088 765,607 -22.85 2.75 THAILAND 535,853 587,723 768,862 727,051 35.68 0.59 USA 288,681 439,519 542,439 592,770 105.34 6.77 HUNGARY 308,364 373,266 469,767 579,304 87.86 1.19 PAKISTAN 316,928 405,811 551,644 557,671 75.96 0.24 TAIWAN 498,032 428,941 619,279 506,836 1.77 3.74 ROMANIA 391,815 343,292 347,159 464,272 18.49 0.27 SRI LANKA 152,150 162,005 251,584 306,639 101.54 0.39 TOTAL 12,790,703 14,739,312 18,717,163 19,702,002 54.03
Source: Werner International, Eurostat
As the table displays, the countries under the examination had increased their exports by 52 % from 12.8 billion to 19.8 billion ECU during 1989 and 1992. Turkey ranked second, following China, in terms of value of export and had 61 percent increase in her export to EC. This was a satisfactory result for Turkey. However, Poland, Indonesia, China, USA, and Sri Lanka were more successful in increasing their exports in the
The six of the sixteen countries (China, India, Pakistan, Sri Lanka, Romania, and Indonesia) had realized remarkable expansions in their export to EC due to their relatively lower cost positions.
All of these observations indicate that, there exist a negative correlation between labor cost and marketing capability. In other words, the countries which have higher costs face either a decline or a very little rise in their exports.
III.4 TRENDS IN FOREIGN TRADE III.4.1 Export
The new foreign policy which started in 1980 in Turkey allowed the T&C industry to benefit from it the most. The reasons such as the cheap labor, abundance and high quality of the raw materials, proximity to the export markets and commercial partnership with EC made T&C industry be the star of Turkish exports. Table 11 shows the import and export values for Turkish T&C industry during 1989 and 1992.
There has been a trend for recession in the Turkish textile exports after 1989. The reason for this immobility is the anti-dumping taxes applied by EC to Turkish textile products and the lack of competitive power of Turkish products with low added-value.
While the Turkish textile exports remain constant, there is a considerable increase in imports. Turkish textile imports were $ 624 million in 1989, and increased by 90 % in
1992 reaching $ 1.2 billion.
If the investigation is shifted from the textile industry to the clothing industry, a totally different situation is faced. While the Turkish clothing exports were $2.4 billion in
1989, they increased in the following 3 years by 67% and exceeded $4 billion. This success is well above the economy average. Thus the clothing exports carried their share in total Turkish exports up to 27.2%.
Table 11
Foreign Trade o f T&C Industries (Including Fiber)
TEXTILE % Change 1989 1990 1991 1992 90/89 91/90 92/91 ($1,000) ($1,000) ($1,000) ($1,000) Export 1,427,301 1,424,248 1,374,356 1,369,322 -0.21 -3.50 -0.37 Import 624,280 1,049,012 872,912 1,189,310 68.04 -16.79 36.25 CLOTHING Export 2,401,495 2,898,349 3,219,350 4,009,615 20.69 11.08 24.55 Import 6,617 17,984 26,516 35,066 171.78 47.44 32.24
TEXTILE AND CLOTHING
Export 3,828,796 4,322,597 4,593,706 5,378,937 12.90 6.27 17.09
Import 630,897 1,066,996 899,428 1,224,376 69.12 -15.70 36.13
TOTAL FOREIGN TRADE
Export 11,624,700 12,959,300 13,593,500 14,714,700 11.48 4.89 8.25
Import 15,792,100 22,302,100 21,047,700 22,870,900 41.22 -5.62 8.66
SHARE OF T&C IN THE FOREIGN TRADE
Export 32.94 33.36 33.79 36.55
Import 4.00 4.78 4.27 5.35
Source: Treasury and External Trade Undersecretary
If the import figures in clothing industry are examined, increases are observed in significant proportions. While the imports for the Turkish clothing industry were $ 6.6 million in 1989, they increased by 430 % in the following 3 years and reached $ 35 million. However, the low import figures for the clothing industry, resulted in having no
The evaluation of the textile and the clothing industry indicates that, while Turkish T&C industry exports were $3.83 billion in 1989, they reached $5.38 billion at the end of 1992. According to these results, the share of the T&C industry in total exports has been increasing.(Graph 8). This share increased slightly in 1990 and in 1991. In 1990, the share of the T&C industry in total export revenues reached 33.4% and in 1991 33.8%. One year later, in 1992, since there became a big difference in the total Turkish export increase rate and the T&C exports increase rate (total export increase rate: 8.2%), the share of the T&C industry in total export revenues increased to 36.6%. It can easily be stated that an industry which has a share of more than 1/3 of a country’s export revenues is the leader and the star of the economy.
Graph 8
Share of T&C in Turkish Foreign Trade
■ E xport(Texlile) H E xpor^C lolhing) I I Total E x p o r to fT u rk e y
III.4.1.1 Distribution of Exports Among the Countries
It is beneficial to know the markets that the T&C industry is targeting, besides providing information on the size and the development of the industry. As a result of defining these markets, the effects of 1995 Turkey-EC Customs Union can be better understood.
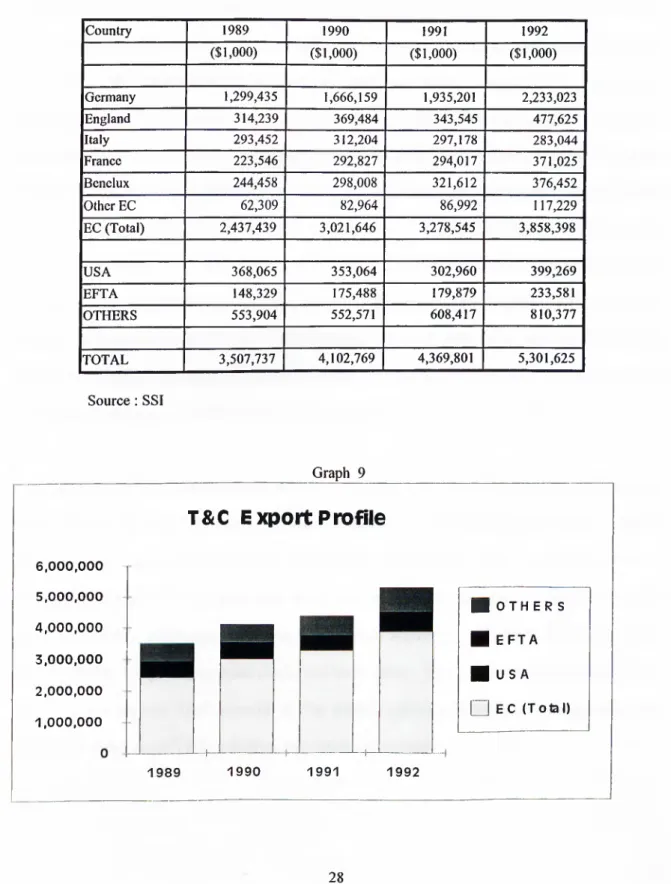
Table 12 and Graph 9 aim to examine the markets which are targeted by Turkish T&C industry, show the distribution among the countries.
Table 12
Distribution o f Exports among Countries (Excluding Fiber)
Country 1989 1990 1991 1992 ($1,000) ($1,000) ($1,000) ($1,000) Germany 1,299,435 1,666,159 1,935,201 2,233,023 England 314,239 369,484 343,545 477,625 Italy 293,452 312,204 297,178 283,044 France 223,546 292,827 294,017 371,025 Benelux 244,458 298,008 321,612 376,452 Other EC 62,309 82,964 86,992 117,229 EC (Total) 2,437,439 3,021,646 3,278,545 3,858,398 USA 368,065 353,064 302,960 399,269 EFTA 148,329 175,488 179,879 233,581 OTHERS 553,904 552,571 608,417 810,377 TOTAL 3,507,737 4,102,769 4,369,801 5,301,625 Source : SSI Graph 9 6,000 ,0 0 0 5
.
0 0 0.
000 4.
0 0 0.
000 3.
0 0 0.
000 2 .0 0 0 . 000 1 0 0 0 ,0 0 0T&C Export Profile
■ o t h e r s
■ E F T A ■ U S A □ E C (Total)
The largest market for all Turkish T&C industry in monetary terms is the EC. The community purchased 69.5% of the Turkish T&C exports in 1989, increased this amount in the following years and in 1992, the figure reached 72.8%. The largest share among the EC countries belongs to Germany, since, the share of Germany in total Turkish T&C exports exceeded 42% in 1992. Following Germany, the next largest stakeholder is England. England has 9% of the Turkish T&C exports. The other important purchasers of Turkish T&C exports in EC are Benelux and France with a share of 7 %. The market shares of these 4 countries showed an increase between 1989 and 1992. Among the main purchasers in EC, only the share of Italy in total Turkish T&C exports decreased between 1989 and 1992. Since Italy, which is a clothing giant, purchases a lot of textile but no clothing products Turkish T&C exports to EC countries shrank between 1989 and 1992. Eventhough, Italy is one of the main purchasers of the cotton thread in the EC, following the anti-dumping tax, there occurs a decrease in the amount of cotton thread purchased by Italy from Turkey. Turkey achieves to sell very few T&C products to the other EC countries (Denmark, Spain, Portugal, Ireland, and Greece). The total share of all of these countries in total Turkish T&C exports was only 2.2% in 1992.
Following EC, the second largest market is USA. Turkey sold T&C products worth of $400 million to USA in 1992, which constituted 7.5% of the total T&C exports. However, this share is well below the 10.5% achieved in 1989. The sales of T&C products reached $368 million and then, due to several reasons’*, dropped to $303 million in 1991. Although there was a period of recovery in Turkish T&C exports to USA in 1992, the previous peak could not be reached. Turkey’s loss of power in USA, which is the largest T&C market in the world, brings out serious doubts about the competitive power of Turkey in the international markets.
The third largest T&C market of Turkey is EFTA countries. Turkey will, by signing a free trade agreement in 1991'2, have the right to sell T&C products to EFTA countries without any customs tax in 1996.
From this point of view, it is expected for the Turkish products to have a bigger market share in EFTA countries. However, the possibility of some EFTA countries’ becoming EC members prevents making reliable predictions.
Turkey sold T&C products worth of $148 million to EFTA countries in 1989. This value increased in the following years and reached $234 million in 1992. This means that there was an increase by 57.5% between 1989 and 1992 for the T&C exports channeled to EFTA countries by Turkey. An increase by 57.5% is above the average rate of increase. As a result of this trend, the share of EFTA countries in Turkish T&C exports reached 4.4%.
There was a slight decrease in the T&C products sold to the countries other than the three categories mentioned. While the share of these countries classified as others was 15.8% in 1989, it dropped to 15.5% in 1992. The two countries that attracted attention in 1992 were Poland and Saudi Arabia. The T&C exports to Poland amounted to $115 million, and to Saudi Arabia $113 million, in 1992. In addition, there is a tendency for an increase in the exports to these two countries.
When the geographical proximity of Turkey to Europe, the number of Turkish people living in Europe, the partnership between Turkey and EC as a partner member, Turkey’s
customs tax for the Turkish T&C products sold to EC since 1971 due to Turkey’s being a partner member of EC. This superiority creates a difference of 6-7% in prices for Turkish products. Moreover, since Turkey is a member of EC which has certain exemptions, a eertain generosity has been shown in setting the quota sizes. The Turkish T&C industry, utilizing this generosity, has increased its market share by penetrating such a well protected market relatively easily.
III.4.1.2 Turkey’s Position in the EC Market
It gives out interesting results to examine the importance of Turkey in terms of these markets following the investigation made for the importance of various markets for the Turkish T&C industry. Table 13 aiming to explain this importance, shows the market share of Turkish T&C industry in the EC market. Since the EC import data were obtained from EC sourees (Eurostat) and Turkish export data were obtained from Turkish sources (Treasury and External Trade Underseeretary), if the numbers given in this figure are converted to dollars, the values may not coincide with the data presented in the previous figures.
Table 13 divides the EC imports into two parts as Intra-EC and Extra-EC, while investigating the T&C industry trade of EC. Intra-EC import means the purchases made by an EC member eountry from one of the other 11 EC member countries. On the other hand, Extra-EC import means the purehases made by an EC member eountry from a non-EC member eountry. The concept described as world means the total of Extra-EC and Intra-EC imports. As for Turkey, EC imports will be considered in the context of Extra-EC imports.
Table 13
Share of Turkey in EC Textile and Clothing Import
TEXTILE % Change 1989 1990 1991 1992 90/89 91/90 92/91 World 37,700,155 38,141,290 37,548,249 36,808,357 1.17 -1.55 -1.97 Intra-EC 23,170,730 24,048,480 23,808,495 23,858,312 3.79 -1.00 0.21 Extra-EC 14,377,648 13,946,254 13,571,566 12,829,061 -3.00 -2.69 -5.47 Turkey 795,467 692,709 696,809 571,833 -12.92 0.59 -17.94 Share 5.53 4.97 5.13 4.46 -10.22 3.37 -13.19 CLOTHING World 36,152,110 41,721,448 49,612,469 51,592,243 15.41 18.91 3.99 Intra-EC 18,421,514 21,335,660 23,999,938 24,955,414 15.82 12.49 3.98 Extra-EC 17,706,877 20,359,143 25,593,222 26,629,339 14.98 25.71 4.05 Turkey 1,686,770 2,005,076 2,361,269 2,723,976 18.87 17.76 15.36 Share 9.53 9.85 9.23 10.23 3.38 -6.32 10.87
TEXTILE AND CLOTHING
World 73,852,265 79,862,738 87,160,718 88,400,600 8.14 9.14 1.42 Intra-EC 41,592,244 45,384,140 47,808,433 48,813,726 9.12 5.34 2.10 Extra-EC 32,084,525 34,305,397 39,164,788 39,458,400 6.92 14.17 0.75 Turkey 2,482,237 2,697,785 3,058,078 3,295,809 8.68 13.36 7.77 Share 7.74 7.86 7.81 8.35 1.65 -0.71 6.97 Source: Eurostat
* * Extra-EC is considered, while share of Turkey is determined
EC which is the largest market for Turkey in TifeC products, is at the same time one of the most important importers of T&C industry in the world. Such that, the share of EC in world T&C trade is above 40.4% in 1990’s. However, when the developments in EC’s T&C trade are considered, interesting results are observed. Extra-EC imports have been steadily decreasing since 1989. In 1989, EC’s Extra-EC imports amounted to 14.4 billion ECU. This value kept decreasing and dropped to 12.8 billion ECU in 1992. In
Graph 10
Turkey's Sharein Extra-EC T&c import
45.
000.
000 40.
000.
000 35.
000.
000 30.
000.
000 25.
000.
000 20.000. 000 15.
000.
000 1 0.
0 0 0.
000 5,000,000 1989 1990 1991 1992During the same period, there was a decrease in textile exports of Turkey to the EC. Turkey achieved to sell textile products worth of 796 million ECU to EC in 1989. textile exports of the country to the community decreased by 13 % in 1990, and dropped to 693 million ECU. In 1991, they almost stopped and Turkey reached 697 million ECU in textile exports to EC. The two reasons for this decrease are the anti-dumping tax of 12.1% applied to Turkish cotton thread by EC, and Turkey’s loss of competitive power in the products with low added-value.
EC clothing imports grew rapidly between 1989 and 1992. While Extra-EC imports were 17.7 billion ECU in 1989, this amount climbed up to 26.6 billion ECU in 1992. We should not miss the point that this rapid increase in imports occurred in a period of economic recession. The only explanation of this result is EC’s beginning to nullify its clothing industry production, since, consumers decrease their consumption and try to save more in a period when there is a trend for recession. In spite of this situation, the increase in the clothing imports of the EC is a sign that the EC tries to meet its demands by increasing the import.
If the textile and clothing trade are examined together, by means of increasing clothing exports in contrast to decreasing the textile exports, the market share of Turkey in EC exports shows an increase.(Graph 10)
It is considered that Turkey was less affected from the declining trend of the total imports due to the recession in the economy. As it is stated under the previous topics of this section, the major aspect of the Turkish clothing industry is its flexibility. Turkish clothing industry starts using its flexibility in a more efficient way while there are decreases in the size of orders in an environment where recession is faced and shrinkage in the lead times are observed. Due to this, European importers try to find a way of purchase from Turkey, which can work in a more flexible fashion instead of buying from Asian countries.
As a result, eventhough there is a decrease in the Turkish textile industry exports to EC, there is a rate of increase in clothing exports which is above the average. Such that, between 1989 and 1990, there was an increase of 33% in Turkish T&C exports. With this figure, Turkey became the second largest T&C supplier in EC. This success achieved in spite of the decrease in the textile industry exports is significantly apparent. It is obvious that there will be a decrease in purchases made by EC for the textile products which are the raw materials for the clothing industry, in the following years. Since, EC engages in clothing trade rather than clothing production. Also it is clear that it is very difficult to sell clothing raw materials to a country which does not have any clothing production. Besides, it is observed that there is an increase in textile exports
III.4.2 Distribution of Imports Among the Countries
An important development observed in Turkey in the recent years is particularly the increase in textile imports. The distribution of imports among the countries for the Turkish T&C imports will gain more importance after the customs union. For this reason, the distribution of imports among the countries for the Turkish T&C imports is shown in Table 14. In addition, the distribution of imports among the countries for the Turkish T&C imports is shown in Graph 11 with the main supply channels.
The largest supplier of Turkey in T&C products is Germany as it was in exports. At the end of 1992, purchases of T&C products worth of $182 million were made from Germany. Another EC country, Italy, follows Germany. The amount of purchases made from Italy in 1992 were $127 million. Turkey purchases T&C products worth of $40 million from the other large countries including England, France, and Benelux.
As can be seen from the graph, the share of EC in Turkish T&C imports in 1992 was 37%. This figure explains the 2 point increase in 1989 with respect to. 35%
The other important supplier of Turkey in T&C products is USA. In 1992, Turkey purchased T&C products worth of 75 million from USA. However, the share of USA in Turkish T&C imports decreased significantly between 1989 and 1992. The reason for this is most probably the preferences of Turkish industry in favor of cheap raw material suppliers instead of high quality American products.
Table 14
The Profile o f Turkish T&C Import (Ineluding Fiber, $ 1000)
Country 1989 1990 1991 1992 92/89 89 Share 92 Share Germany 92,842 169,767 145,689 182,076 96.11 14.72 14.09 England 21,066 38,628 33,738 41,297 96.04 3.34 3.20 Italy 51,121 123,321 104,969 126,785 148.01 8.10 9.81 France 11,054 29,929 23,220 35,554 221.64 1.75 2.75 Benelux 17,463 30,331 25,166 39,877 128.35 2.77 3.09 Other EC 25,897 32,365 13,017 29,496 13.90 4.10 2.28 EC (Total) 219,443 424,341 345,799 455,085 107.38 34.78 35.21 USA 108,797 124,781 85,857 74,476 -31.55 17.24 5.76 Australia 22,383 38,051 28,980 39,951 78.49 3.55 3.09 China 19,236 32,702 31,166 37,582 95.37 3.05 2.91 Taiwan 19,263 32,747 26,623 30,174 56.64 3.05 2.33 India 7,805 13,259 10,734 28,916 270.48 1.24 2.24 South Korea 14,728 25,037 29,950 44,851 204.53 2.33 3.47 Pakistan 45,994 78,189 65,597 38,019 -17.34 7.29 2.94 Syria 6,127 10,416 5,785 25,770 320.60 0.97 1.99 Russia 0 0 0 68,151 - 0.00 5.27 Others 167,121 287,473 268,937 449,553 169.00 26.49 34.78 Total 630,897 1,066,996 899,428 1,292,528 104.87 100.00 100.00
Source: Treasury and External Trade Undersecretary
Graph 11
T&C I nvKHt Markets of Turkey
1400000 1200000 1000000 800000 600000 400000An important subject which should not be overlooked, when evaluating the T«feC imports made from EC and USA, is the raw materials brought to Turkey for sub-contract production. Turkey’s position as an important supplier in clothing production resulted in USA and EC bring their raw materials and start the production in Turkey. Due to this reason, the amount of T&C imports made from these countries seems high.
Among the 3rd parties, the ones which have highest sales figures to Turkey in T&C products are Russia, South Korea and Pakistan.
When the distribution of Turkish T&C industry imports among the countries is examined, we face an intensive number of countries which will be left out of the customs union. Moreover, most of these countries are the developing ones which are inexpensive suppliers. This observation will be used as an important piece of information in the section investigating the effects of customs union.
IV. FACTORS AFFECTING EXPORT OF TURKEY
IV. 1 THE CONCEPT OF GLOBALIZATION IN TEXTILE MARKETS
The political conjuncture and the globalization in international markets that are faced today, surely will affect the international textile industry and trade. In this frame, two opposite poles appear as liberalization and protection in international textile trade. While the aforementioned economical and political unions eliminate all of the barriers about textile trade within themselves, at the same time they are competing against each other in creating new limitations for third parties.
In addition to the above mentioned countries’ globalization of their economic policies for textile industry, globalization is faced in the European textile markets in terms of the following concepts:
1. Globalization trends in consumption
2. Globalization trends in production and in the markets
When textile industry is examined from the consumer point of view, in the recent years important changes are observed in the market and fashion mentalities in the European markets.
In addition to realization of the Customs Union between the EC countries, removal of barriers in movements of people and products, close relationships between countries in terms of cultural aspects, bring out the similar taste and color styles and a new mentality in clothing leads to a new way of life. Particularly for the young generations, there is an increase in the number of people who share the same interests, like same books and movies, same music, same sporting event, and same style and the process of these people effecting each other is gaining a new acceleration.
These generations create their own idols in music, cinema, art, culture, politics and sports. The mentioned situation also affects textile, clothing and fashion industries. In fact, fashion which is used as a tool to distinguish and differentiate people’s mind from the others, to emphasize their personalities, by the help of this new mentality expands rapidly. The color and fashion understanding, which used to address a limited number of
The dictating functions of the fashion centers started losing their effects against the customers who are well informed, who know to draw their line in the direction they want and who can define the relation between their mentality and their clothing clearly. Furthermore, consumer has started dictating the way that the fashion creator should follow in terms of color, style, accessories, etc. in some of the branches of clothing industry. Nowadays, fashion ceased being a concept which originates from one or two centers and expands to country in circles and dies when its widespread, instead, it lost the power of directing the crowds. Here while not denying the role of fashion in human life, it is possible to mention the fact that people influence the fashion industry but not the reverse. In the meantime, besides the richness in color, print, pattern, fabric types became more evident compared to past years.
In spite of all these mentioned means for nuance and distinguishing accessories, the life time of the fashion line has been decreasing. In other words, selling a dress which is out of fashion in France, in Germany or in Italy or selling an old fashion costume to a customer in England is not possible anymore. Namely, consumer is renovative, too. Besides the various color and accessory types, consumers want to see the alternatives for fabric, pattern, print and model. Sensitive and searching consumer mass who are also well informed about the prices, direct the market with the help of the media.
If we look at the subject from the point of production and marketing, it is possible to see the traces of the new mark left by the market thus customer. European textile producers were late in realizing this change in the consumer. The main reason for the problems that they have, is their being late in making investment to renew themselves in addition to their improper or incorrect evaluation of movements in the demand in the market. It is not possible for a textile industry whose level of creativity is low, technology is old and productivity is insufficient, and which couldn’t accomplish new marketing methods.
which is not flexible, to have a different result against a young consumer mass. Nevertheless, in spite of all protective approaches, precautions and limitations, the unavoidable collapse in the European textile industry is the best evidence. On the other hand, there has been a change in the concept. The concept of quality stepped forward in the production and total quality concept gained importance. If subject is examined from the marketing point of view, parallelism and similarities between the European countries are observed in terms of marketing techniques and institutions. The most important similar development in the market from the marketing institutions point of view, is the rising importance of concentration and internationalization in the trade in the recent years and medium and small marketing institutions’ loss of competitive power in the market. Small firms cannot compete against the mentality of bigger firms in terms of fashion, suppliers and finance, and the number of such firms has been decreasing. There has been an increase in the sales of large chain firms and firms which accomplish sales by means of catalogues.
IV.2 EC TEXTILE POLICIES
IV.2.1 EC’s Textile Policy Toward the Eastern European Countries
The relative influence of the textile industry within the whole economy varies for different groups of Eastern and Central European countries and the former Soviet Union. The first group includes Hungary, Chek. and Slovak Republics, Poland, Romania and Bulgaria where synthetic fiber-based raw material production and clothing production constitutes a significant proportion in the total industrial products. On the other hand, the countries of the former Soviet Union (with the exception of Ukraine) clothing production is basically for the domestic market. The countries in the second group