Yıldırım, Kurt & Ayas / TUSED / 8(3) 2011 44
The Effect Of The Worksheets On Students’ Achievement In
Chemical Equilibrium
Nagihan YILDIRIM1, Sevil KURT2 , Alipaşa AYAS3 1 Assist. Prof. Dr., Rize University, Faculty of Education, Rize-TURKEY
2 Dr. Res. Assist., Rize University, Faculty of Education, Rize-TURKEY 3 Prof. Dr., Bilkent University, Faculty of Education, Ankara-TURKEY
Received: 05.07.2010 Revised: 06.01.2011 Accepted: 25.01.2011
The original language of the article is English (v.8, n.3, September 2011, pp.44-58)
ABSTRACT
In the present study, it is aimed to determine effects of worksheets on students‟ achievement on the factors affecting equilibrium. The study was carried out with a quasi-experimental design. Data were collected through chemical equilibrium concept test, semi structured interviews and unstructured observations. The sample was 44 eleventh grade students enrolled in two classes from a secondary school in Trabzon in the fall term of the 2008-2009 academic years. Interview data were analysed descriptively. Data collected from chemical equilibrium concept test were analysed by using SPSS statistical programme. On the other hand data from unstructured observations were organized and then given directly. At the end of the study, it is found that experimental group students were more successful than the control group. As a result, a number of suggestions were made about development of worksheets in other difficult concepts of chemistry.
Keywords: Equilibrium; Effecting Factors of Equilibrium; Worksheets.
INTRODUCTION
Studies carried out in the field of chemistry reveal that one of the subjects where students have misconceptions is chemical equilibrium (Gussarsky & Gorodesky, 1990; Huddle & Pillay, 1996). These misconceptions and learning difficulties are on dynamic nature of equilibrium, equilibrium constant, heterogeneous equilibrium, gases equilibrium and Le Chatelier principle (Hackling & Garnett, 1985; Gorodesky & Hoz, 1985; Berguest & Heikkinen, 1990; Huddle & Pillay, 1996; Thomas & Schwenz, 1998; Voska & Heikkinen, 2000; Yıldırım, 2000; Chiu et al., 2002; Kousthana & Tsaparalis, 2002; Akkuş et al., 2003; Alkan & Benlikaya, 2004; Piquette & Heikkinen, 2005). Considering the fact that misconceptions affect subsequent learning in a negative way, it is quite important that students‟ scientific understanding of chemical equilibrium affects learning of many other subjects such as oxiditation-reduction, acid-base, reaction rate, and solubility equlibrium. Conceptual difficulties related to chemical equilibrium mainly derive from students‟ failure in
Correspondence Author email: [email protected] © ISSN:1304-6020
TÜRK FEN EĞİTİMİ DERGİSİ Yıl 8, Sayı 3, Eylül 2011
Journal of
TURKISH SCIENCE EDUCATION Volume 8, Issue 3, September 2011
Yıldırım, Kurt & Ayas / TUSED / 8(3) 2011 45
imagining events that take place at the moment of equilibrium (Wheeler & Kass, 1978; Tyson, Treagust & Bucat, 1999; Kousathana & Tsaparlıs, 2002; Sepet, Yılmaz & Morgil, 2004). Students need to be able to imagine the equilibrium at macro, micro and symbolic levels in order to conceptually understand the topic. Another reason of students not to conceptualize the chemical equilibrium concept is the teaching method used in the classroom is based only on writing or lecturing. In parallel, students solves some numerical chemical equilibrium problems by using some formulas or procedures which were thaught in science classes (Berquest & Heikkinen, 1990; Tyson, Treagust & Bucat, 1999; Yıldırım, 2000). So when students were asked why they used these formulas or procedures they could not explain the reasons or sometimes they get the right results by coming up with wrong reasons (Kousathana & Tsaparlis, 2002; Weerawardhana, 2003; Quilez, 2004). To better understand the chemical equilibrium concepts students need to imagine the events that take place at the moment of equilibrium. It is important to develope spesific teaching-learning materials which take the students‟ misconceptions into consideration and make concrete examples of the events that take place at the moment of equilibrium. There have been numerous studies that investigated the effectiviness of different teaching methods and materials to overcome students misconcetions and learning difficulties of chemical equilibrium. In these studies, conceptual change approach, computer aided instruction, group discussion, constructivist teaching method, problem based learning, analogies and students‟ worksheets were generally investigated (Hameed et al, 1993; Niaz, 1995; Chiu et al., 2002; Akkuş et al., 2003; Weerawardhana, 2003; Sandberg & Bellamy, 2004; Coştu & Ünal, 2005; Harrison & Jong, 2005; Locaylocay et al., 2006; Sarıçayır, 2007). But among these there are limited studies which reports the effect of worksheets on students‟ achivement (Coştu & Ünal, 2005). However, worksheets are found useful and practical materials for conceptual understanding if they were effectively used in learning environments (Griffiths, Thomey, Cooke & Normore, 1988; Demircioğlu et al., 2004).
Worksheets are materials by which students are given transaction steps regarding what they are supposed to learn. Also, they include activities which give the students main responsibility in their own learning (Kurt & Akdeniz, 2002). Thus worksheets are known to help students gain scientific process skills such as setting up experimental mechanism, recording data, interpreting the data, and so on so that they can conceptualize the concepts in their minds. There are several studies showing that worksheets increase students‟ interest in the lesson and affect their success in a positive way (Saka & Akdeniz, 2001; Kurt, 2002; Coştu & Ünal, 2005; Özmen & Yıldırım, 2005; Kurt & Ayas, 2010).
In the present study, it is aimed to determine the effects of worksheets on students‟ achievement on the factors affecting equilibrium.
METHODOLOGY
This study was carried out with a quasi experimental design. Data collection instruments are Chemical Equilibrium Conceptual Test (CE-CT), semi-structured interviews and observations.
a- Sample
The study was carried out with 44 twelfth grade students in two different classes attending to a secondary school in Trabzon in the fall term of the 2008-2009 academic year. The sample was separated into experimental and control groups on a random basis. The factors affecting equilibrium (concentration, temperature and pressure) were taught by the same teacher in both groups. To decide that the students in the experimental and control groups were similar in terms of socio-economic and educational backgrounds, the points of
Yıldırım, Kurt & Ayas / TUSED / 8(3) 2011 46
views of the teacher were taken. Also Mann Whitney U test results of pre test scores of the experimental and control groups showed that two groups were equivalent by means of prior-knowledge on chemical equilibrium.
b- Worksheets
The researchers developed three worksheets on factors that affect the equilibrium to be used in the experimental group. Worksheets were developed on the basis of a four step constructivist teaching strategy. Students‟ misconceptions and learning difficulties are also taken into consideration on chemical equilibrium. Before the implementation, the teacher was trained about what a worksheet is and how it is used in teaching. Also, upon the teacher‟s request, experiments on the worksheets were done by researchers and the teacher together before they used. The intervention consisted of six lessons of 45 minutes duration in the experimental group.
c- Procedure
The intervention involved the following steps:
Firstly, the students divided into six groups, (each contained four students) and the teacher gave brief information on how students should use the worksheets. Then the teacher handed the worksheets out to students. He asked the questions in first part of worksheets to explore students‟ prior knowledge and to engage them in the activity. In the following step, students were asked to perform the given directions in the second part of each of the worksheets and then discuss their ideas in their groups. In this section it was aimed to provide opportunities to students‟ own learning. In the next step, the groups presented their ideas to other groups and finally the teacher sum up the groups‟ ideas with scientific explanations. At the last part of the activity, the students were asked to answer the questions given at the end of the worksheets. In this part the aim was to help students to reinforce their new learning and transfer their new knowledge to other situations. A sample worksheet is attached in the appendix. No intervention was planned for the control group. They followed their regular way of teaching which was known as teacher centered. One of the researchers participated in each lesson and observed the interventions.
d- Instruments and data analysis
The CE-CT, comprised of 17 questions and its validity and reliability was predetermined, was applied as pre and post test to the both groups (Yıldırım, Bak & Ayas, 2007). The data collected from the CE-CT was analyzed by using SPSS software. Comparisons within the groups were realized by using Wilcoxon Signed Ranks Test, and comparisons between groups were made by using Mann Whitney U Test, and results of the analysis were given in tables. Because of number of students in each groups which was less than thirty, nonparametric tests were used (Kalaycı, 2008).
The semi-structured interviews were carried out with 6 students, 3 from each group. Four questions were asked to each student during the interviews. The interviews were tape-recorded and then transcribed verbatim. While experimental group participants in the interviewees were coded as A, B and C, those coming from the control group were coded as D, E and F. The data collected from the interviews were analysed descriptively. Students‟ Drawings and answers to the interview questions were given in tables.
On the other hand, one of the researchers who carried out observations in the two groups made notes during her observations. The data obtained from the observations were organized by the researchers and was directly used to support findings from the other instruments.
Yıldırım, Kurt & Ayas / TUSED / 8(3) 2011 47
FINDINGS
a- Findings Obtained from CE-CT
Comparisons made within and between groups in terms of pre- and post-test scores of the CE-CT applied in the experimental and control groups. Comparisons within the groups were realized by using Wilcoxon Signed Ranks Test, and comparisons between groups were made by using Mann Whitney U Test, and results of the analysis were given in tables. In Table 1, Mann Whitney U Test results of pre test scores of the groups are given.
Table 1. Mann Whitney U Test Results of Pre Test Scores of the Experimental and Control Groups
Groups n X Mean Rank Sum of
Ranks
U p
Experimental 24 13,9167 20,08 482,00
182,00 0,170
Control 20 15,6500 25,40 508,00
An examination of the results given in Table 1 indicates that there is no significant difference between pre-test scores of the control and experimental group (U=182,00; p>.05).
In Table 2, Wilcoxon Signed Ranks Test results of pre-test and post-test scores of the experimental group are given.
Table 2. Wilcoxon Signed Ranks Test Results of Pre Test and Post Test Scores of the Experimental Group
Post Test-Pre Test n Mean Rank Sum of Ranks z p
Negative ranks 0 0 0
Positive ranks 24 12,50 300 4.28* 0.00
Ties 0
*Based on negative ranks
The results given in Table 2 shows that there is a significant difference between pre- and post-test scores obtained from the experimental group (z=4.28, p<.05). Considering the sum of ranks of difference scores, this difference is in favor of the positive ranks and post-test. In Table 3, Wilcoxon Signed Ranks Test results of pre- and post-test scores of the control group are given.
Table 3. Wilcoxon Signed Ranks Test results of pre test and post test scores of the control group
Post Test-Pre Test n Mean Rank Sum of Ranks z p
Negative ranks 0 0 0
Positive ranks 20 10.50 210 3.92* 0.00
Ties 0
*Based on negative ranks
The results given in Table 3 shows that there is a significant difference between pre- and post-test scores obtained from the control group (z=3.92, p<.05). Considering the sum of ranks of difference scores, this difference is in favor of the positive ranks and post test.
In Table 4, Mann Whitney U Test results of post test scores of the experimental and control groups are given.
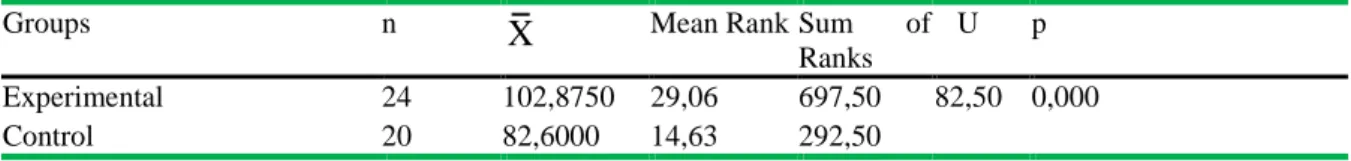
Table 4. Mann Whitney U Test results of post test scores of the experimental and control groups
Groups n X Mean Rank Sum of
Ranks
U p Experimental 24 102,8750 29,06 697,50 82,50 0,000
Yıldırım, Kurt & Ayas / TUSED / 8(3) 2011 48
The results given in Table 4 indicates a significant difference between post-test scores obtained from the control and experimental groups (U=82,50; p<.05). The difference is in favor of the experimental group. Mean score of the control group is 102,875 while it is 82,60 in the experimental group.
b- Findings from Interviews
During interviews, the students were asked regarding HEAT + N2O4(g) 2NO2(g) reaction to explain how the equilibrium and equilibrium constant is affected under following circumstances in relation with the collision theory, Le Chatelier principle and equilibrium constant law, and to draw time graphics of the concentration accordingly:
1. Adding some N2O4 gas to the medium at constant temperature and volume 2. Temperature is increased at constant volume
3. Volume is decreased at constant temperature
Finally, the students in the experimental group were asked for their opinion and recommendations about the implementation. Students‟ responses are given in tables 5, 6, 7 and 8.
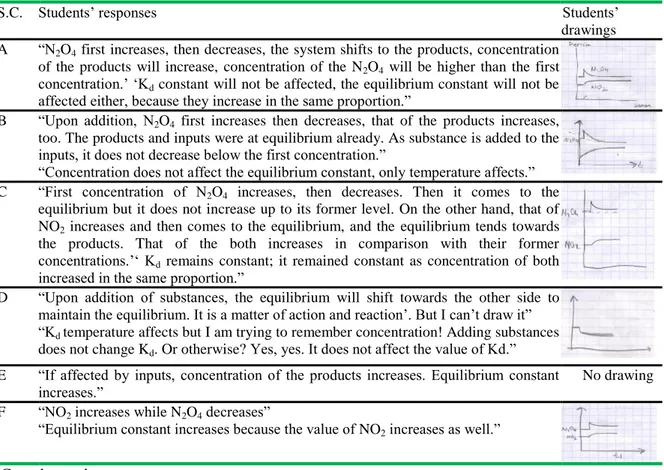
Table 5. Students’ responses regarding the first circumstance (some N2O4 gas is added to the medium
at constant temperature and volume)
S.C. Students‟ responses Students‟
drawings A “N2O4 first increases, then decreases, the system shifts to the products, concentration
of the products will increase, concentration of the N2O4 will be higher than the first concentration.‟ „Kd constant will not be affected, the equilibrium constant will not be affected either, because they increase in the same proportion.”
B “Upon addition, N2O4 first increases then decreases, that of the products increases, too. The products and inputs were at equilibrium already. As substance is added to the inputs, it does not decrease below the first concentration.”
“Concentration does not affect the equilibrium constant, only temperature affects.” C “First concentration of N2O4 increases, then decreases. Then it comes to the
equilibrium but it does not increase up to its former level. On the other hand, that of NO2 increases and then comes to the equilibrium, and the equilibrium tends towards the products. That of the both increases in comparison with their former concentrations.‟„ Kd remains constant; it remained constant as concentration of both increased in the same proportion.”
D “Upon addition of substances, the equilibrium will shift towards the other side to maintain the equilibrium. It is a matter of action and reaction‟. But I can‟t draw it” “Kd temperature affects but I am trying to remember concentration! Adding substances does not change Kd. Or otherwise? Yes, yes. It does not affect the value of Kd.” E “If affected by inputs, concentration of the products increases. Equilibrium constant
increases.”
No drawing F “NO2 increases while N2O4 decreases”
“Equilibrium constant increases because the value of NO2 increases as well.” S.C: student code
Table 5 shows that the students could answer accurately the question about changes in the equilibrium and equilibrium constant upon addition of some N2O4 to the reaction. However; student D and E in the control group could not draw the concentration-time graphic and could not make detailed explanations, either.
Yıldırım, Kurt & Ayas / TUSED / 8(3) 2011 49
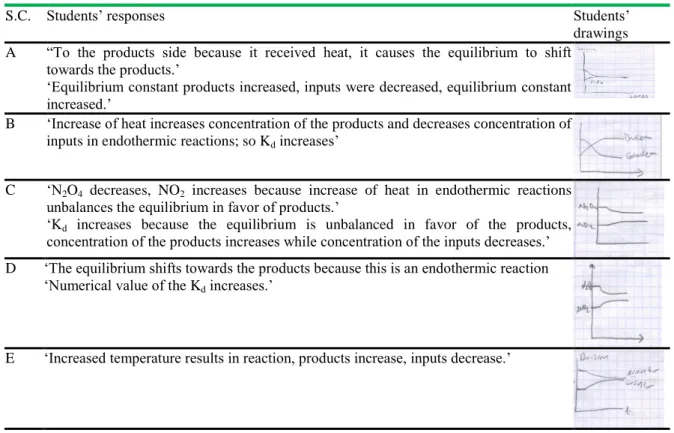
Table 6. Students’ responses regarding the first circumstance (Temperature is increased at constant volume
S.C. Students‟ responses Students‟
drawings A “To the products side because it received heat, it causes the equilibrium to shift
towards the products.‟
„Equilibrium constant products increased, inputs were decreased, equilibrium constant increased.‟
B „Increase of heat increases concentration of the products and decreases concentration of inputs in endothermic reactions; so Kd increases‟
C „N2O4 decreases, NO2 increases because increase of heat in endothermic reactions unbalances the equilibrium in favor of products.‟
„Kd increases because the equilibrium is unbalanced in favor of the products, concentration of the products increases while concentration of the inputs decreases.‟ D „The equilibrium shifts towards the products because this is an endothermic reaction
„Numerical value of the Kd increases.‟
E „Increased temperature results in reaction, products increase, inputs decrease.‟
F „The equilibrium shifts towards products, concentration of the products increases while concentration of imputes decreases. „Equilibrium constant increases.‟
No drawing S.C: student code
According to Table 6, the students in both groups could answer the questions about changes that take place in the reaction and equilibrium constant as a result of increased temperature. However student F in the control group could not draw the graphic of concentration-time.
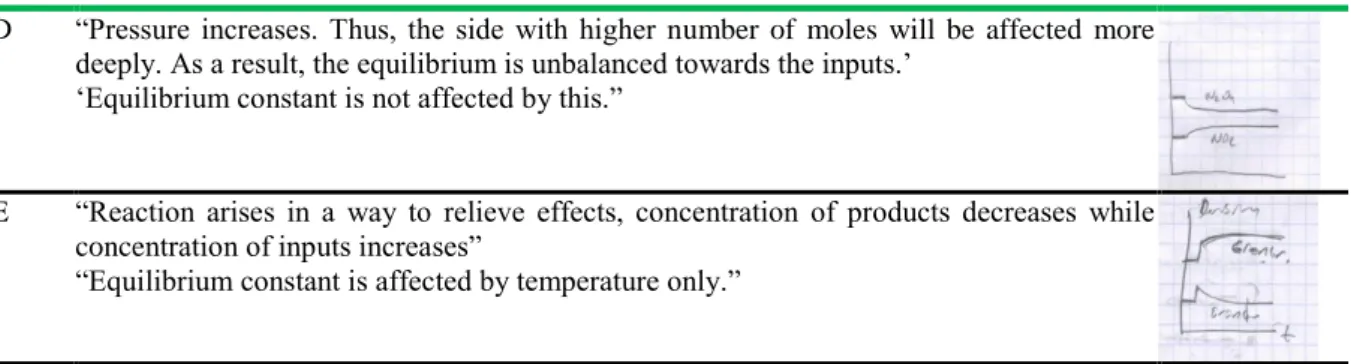
Table 7. Students’ responses regarding the first circumstance (Volume is decreased at constant temperature)
S.C. Students‟ responses Students‟
drawings A “The equilibrium shifts towards inputs because decreased volume increases pressure. The
side with higher number of moles is affected more. The system shifts towards the side with less number of moles to relieve this effect. Concentration of the inputs increases while concentration of the products decreases.”
“Equilibrium constant doesn‟t change because it changes with temperature only.”
B “The equilibrium shifts towards inputs because decreased volume increases pressure according to the Le Chatelier principle. So equilibrium shifts towards inputs to relieve this.”
“Equilibrium constant changes with temperature only.”
C “It shifts towards the side with more products, no, with higher number of moles. Since pressure increases, reaction becomes less in a bigger bowl while reaction becomes severer in a small bowl. N2O4 enters into more reaction and decreases while NO2 increases.”
Yıldırım, Kurt & Ayas / TUSED / 8(3) 2011 50
Table 7. Continued..
D “Pressure increases. Thus, the side with higher number of moles will be affected more deeply. As a result, the equilibrium is unbalanced towards the inputs.‟
„Equilibrium constant is not affected by this.”
E “Reaction arises in a way to relieve effects, concentration of products decreases while concentration of inputs increases”
“Equilibrium constant is affected by temperature only.”
F “Equilibrium shifts towards inputs because pressure increases; it unbalances the equilibrium towards inputs.”
“Equilibrium constant decreases, it decreases because concentration of the inputs will increase.”
No drawing
S.C: student code
According to Table 7, students could mostly answer accurately the question about changes seen in the equilibrium and equilibrium constant as a result of changed volume in given reaction. However student F gave wrong answer for the question about equilibrium constant and could not provide a drawing.
Table 8. Comments of the Experimental Group Students about the Application Realized
S.C. Students‟ comments
A „It was good that experiment was realized before the subject was taught. So we wondered the result. Also it was good to carry out it with group mates. But it could have been even better if we had held the experiments individually. Still, it had positive effects. We could understand what was going on. It would not have been permanent if the teacher had taught verbally only.‟
B „For me, it was funny and good. I was confused, and then came to the laboratory. Before, we used to say that equilibrium shifts towards left or right but I could not conceptualize it. Now I can see what happens as equilibrium of the system is unbalanced.‟
C It was good. The experiments reinforced the subject, also color changes were good. It was very exciting for me.‟
S.C: student code
According to Table 8, mostly students found the application funny and exciting, and it proved to be effective in conceptualizing knowledge.
DISCUSSION
In the present study, it is aimed to determine effects of worksheets on students‟ achievement on chemical equilibrium. For this, CE-CT was applied as pre-test to all of the participants in the experimental and control groups before the topic taught on factors (concentration, temperature and pressure) affecting chemical equilibrium . Mann Whitney U test results (Table 1) showed no significant difference between pre-test scores of the groups (U= 182,00; p>.05). This reveals that students in the experimental and control groups had equivalent success levels regarding affecting factors of chemical equilibrium before the study. Wilcoxon Signed Ranks Test results indicated a significant difference between pre and post test scores in each group after application in each group (Table 2 and 3). This demonstrates that students‟ achievement on concept of chemical equilibrium improved in both control and experimental groups as a consequence of the teaching process. This is regarded to learning as
Yıldırım, Kurt & Ayas / TUSED / 8(3) 2011 51
a consequence of teaching. Also, Mann Whitney U Test was applied to post test scores of the groups if there is a significant difference between them. Mann Whitney U Test showed a significant difference between the experimental and control groups in favor of the experimental group. Mean score of the control group is 14,63 while it is 29,06 in the experimental group (Table 4). This demonstrates that the worksheets proved more effective than the traditional method in teaching the concepts related to chemical equilibrium. In traditional teaching process, teachers usually lecture and students are passive learners. On the other hand, in learning environments with worksheets, students actively participate in the teaching process. In this process, students use materials-equipment, make observations, record data, analyse data and draw conclusions. Such activities undertaken by students are important for turning abstract knowledge into concrete knowledge. The experimental group participants also stated during the interviews that the application proved to be effective for permanent learning. Other studies carried out suggest that such activities help students understand the abstract concepts such as chemical equilibrium and also the worksheets assist teaching of difficult topics (Ayas, Akdeniz & Çepni, 1994; Çepni, Akdeniz & Ayas, 1995; Daunt, 1997; Serin, 2002).
During interviews held with the experimental and control groups, the participants were first asked to explain changes in equilibrium and equilibrium constant upon addition of some N2O4 gas to the HEAT + N2O4(g) 2NO2(g) reaction at constant temperature and volume, and then to draw the time graphic accordingly. Table 5 includes students‟ responses to this question. It shows that the students in the experimental group could answer accurately to the questions regarding changes in equilibrium and equilibrium constant. Students D and E in the control group could not draw concentration-time graphic, and could not make detailed explanations. This reveals that the students D and E could not figure out the increase of concentration of the substance added into a system at balance. According to Wheeler and Kass (1978), concentration-time graphics are quite effective in students‟ understanding what to take place if effect is made on a balanced system. Besides, student E stated that equilibrium constant increase if substance is added to the balanced system. One of the misconceptions noted by Bergquest and Heikkinen (1990) in their study is that students think that equilibrium constant changes upon changing of the inputs and product amount. During the interviews, the experimental and control group participants could mostly draw accurately concentration-time graphic with increased temperature in the reaction (Table 6). Student F in the control group stated that chemical equilibrium shifts towards products but could not draw the graphic. In addition, all of the students could answer accurately the question regarding change of the value of Kd in relation with temperature. Table 7 shows that the participants could mainly answer accurately the questions regarding equilibrium and equilibrium constant with change of volume in the reaction given whereas student F gave wrong answer regarding equilibrium constant and could not make drawing like under the other three questions. Moreover; student F stated that value of the equilibrium constant changes in case of change of volume. Such a misconception was also found out in other studies carried out by Yıldırım (2000) and Yıldırım et al (2007).
The students in the experimental group mixed all materials given before reading instructions on the worksheets and took various materials from cupboards in previous lessons. It might be explained with insufficient participation of students in laboratory activities before. Özmen and Yıldırım (2005) reached similar findings as well. In following lessons, students were seen to be able to undertake the activities themselves and became more practical. During interviews, student B said, in relation with the activity carried out, „I was confused, and then came to the laboratory. Before, we used to say that equilibrium shifts towards left or right but I could not conceptualize it. Now I can see what happens as equilibrium of the system is
Yıldırım, Kurt & Ayas / TUSED / 8(3) 2011 52
unbalanced.‟ (Table 8). This quotation suggests that experiments under training activities on the worksheets drew students‟ attention, and overall application helped to conceptualize the concepts. Regarding chemistry classes, the researchers in the literature state that students cannot acquire permanent knowledge unless information is transferred on the basis of experiments (Ayas, Çepni, Johnson & Turgut, 1997). Students make observations, record data, draw conclusions from the data and thus take active role in the process while they carry out experiments in the laboratory (Temel, Oral & Avanoğlu, 2000; Üce, Sarıçayır & Demirkaynak, 2003). Demircioğlu, Demircioğlu and Ayas (2004) suggest that behaviors acquired when the students take active role are more permanent and significant than those acquired by audial or visual means only.
Student B in the experimental group stated during interviews that doing experiments on an individual basis would be better. During observations, mostly the same students undertook the transactions in the first class of application. Since students work on their own in traditional classroom environments, they could have had difficulties in group work. On the other hand, students made group work and acted as a group in the following lessons. It was seen that student-student and teacher-student interactions became more common in time as well. The students started asking questions in groups. Furthermore; the teacher guided students to think by means of asking questions. Studies carried out proved that the laboratory environment increased not only activities, assistance, taking responsibility, observation and trial and error within groups but also interest in the lesson and thus achievement in chemistry (Ayas et al., 1994; Üce & Şahin, 2001; Orbay et al., 2003; Üce, Sarıçayır & Demirkaynak, 2003; Özmen & Yıldırım, 2005).
CONCLUSIONS and RECOMMENDATIONS
This study was carried out to determine effects of worksheets on students‟ achievement on factors affecting chemical equilibrium. As a consequence, it was found out that worksheets increase students‟ achievement regarding factors affecting chemical equilibrium. In this sense, worksheets can be developed at conceptual basis for other chemistry topics that are difficult to understand. Besides, participants stated that they enjoyed the activity and the application was funny. Long-term studies on the basis of worksheets in various subjects can be used to find out their effectiveness in students‟ affective behavior.
Yıldırım, Kurt & Ayas / TUSED / 8(3) 2011 53
REFERENCES
Akkuş, H., Kadayıfçı, H. & Atasoy, B. (2003). Effectiveness of instruction based on the constructivist approach on understanding chemical equilibrium concepts. Research in
Science and Technological Education, 21(2), 209-227.
Alkan, M. & Benlikaya R. (2004). Kimyasal Reaksiyon ve Denge Kavramlarının Anlaşılması
için Çarpışma Teorisi Gerekli mi?, VI. Ulusal Fen Bilimleri ve Matematik Eğitimi
Kongresi, İstanbul, Eylül.
Ayas, A., Akdeniz, A. R. & Çepni, S. (1994). Fen bilimleri eğitiminde laboratuarın yeri ve önemi-1: Tarihsel bir bakış. Çağdaş Eğitim Dergisi, 204, 21-25.
Ayas, A., Çepni, S., Johnson, D. & Turgut, M.F. (1997). Kimya Öğretimi, Öğretmen Eğitimi
Dizisi, YÖK/Dünya Bankası Milli Eğitimi Geliştirme Projesi Yayınları, Bilkent, Ankara.
Berguest, W. & Heikkinen, H. (1990). Student ideas regarding chemical equilibrium. Journal
of Chemical Education, 67, 1000-1003.
Çepni, S., Akdeniz, A. R. & Ayas, A. (1995). Fen bilimleri eğitiminde laboratuarın yeri ve önemi (III): Ülkemizde laboratuar uygulamaları ve öneriler. Çağdaş Eğitim Dergisi, 206, 24–28.
Chiu, M., Chou, C. & Liu, C. (2002). Dynamic process of conceptual change: analysis of constructing mental models of chemical equilibrium. Journal of Research in Science
Teaching, 39(6), 688-712.
Coştu, B. & Ünal, S. (2005). Le-Chatelier prensibinin çalışma yaprakları ile öğretimi.
Yüzüncü Yıl Üniversitesi Elektronik Eğitim Fakültesi Dergisi, 1, 1.
Daunt, B. (1997). Öğreticinin El Kitabı, Çev: H. Kalkandelen, Ankara: Pegem Yayıncılık. Demircioğlu, H., Demircioğlu, G. & Ayas, A. (2004). kavram yanılgılarının çalışma
yapraklarıyla giderilmesine yönelik bir çalışma. Milli Eğitim Dergisi, 163.
Gorodetsky, M. & Hoz, R.(1985). Changes in the group cognitive structure of some chemical equilibrium concepts following a university course in general chemistry. Science
Education, 69, 185–199.
Griffiths, A. K., Thomey, K., Cooke, B. & Normore, G.(1988). Remediation of student-spesific misconception relating to three science concepts. Journal of Research in Science
Teaching, 25(9), 709-719.
Gussarsky, E. & Gorodetsky, M.(1990). On the concept „chemical equilibrium‟: the associative framework. Journal of Research in Science Teaching, 27, 197-204.
Hackling, M. W. & Garnett, P.J.(1985). Misconceptions of chemical equilibrium. European
Journal of Science Education, 7, 205-214.
Hameed, H., Hackling, M.W. & Garnett, P.J.(1993). Facilitating conceptual change in chemical equilibrium using CAI strategy. International Journal of Science Education, 15(2), 221-230.
Harrison, A. G. & Jong, O.(2005). Exploring the use of multiple analogical models when teaching and learning chemical equilibrium. Journal of Research in Science Teaching, 42(10), 1135–1159.
Yıldırım, Kurt & Ayas / TUSED / 8(3) 2011 54
Huddle, P.A. & Pillay, A. E. (1996). An in-depth study of misconceptions in stoichiometry and chemical equilibrium at South African University. Journal of Research in Science
Teaching, 33, 65-77.
Kalaycı, 2008. SPSS Uygulamalı Çok Değişkenli İstatistik Teknikleri, Asil Yayın Dağıtım Ltd. Şti, 3. Baskı, Ankara.
Kousthana, M. & Tsaparlis, G. (2002). Students errors in solving numerical chemical-equilibrium problems. Chemistry Education: Research and Practice in Europe, 3(3), 5-17.
Kurt, S. & Ayas, A. (2010). Bir Öğretim Teknolojisi Olarak Çalışma Yapraklarının Kimyasal
Reaksiyonların Hızı Konusunda Öğrenci Başarısına Etkisi, International Educational
Technology Conference, İstanbul, Boğaziçi University.
Kurt, Ş. (2002). Fizik Öğretiminde Bütünleştirici Öğrenme Kuramına Uygun Çalışma
Yapraklarının Geliştirilmesi, Yüksek Lisans Tezi, K.T.Ü. Fen Bilimleri Enstitüsü,
Trabzon.
Kurt, Ş. & Akdeniz, A.R. (2002). Fizik Öğretiminde Enerji Konusunda Geliştirilen Çalışma
Yapraklarının Uygulanması, V. Ulusal Fen Bilimleri ve Matematik Eğitimi Kongresi,
Bildiriler Kitabı, Cilt I, (s:570-576), Ankara, ODTÜ.
Niaz, M. (1995). Relationship between student performance on conceptual and computational problems of chemical equilibrium. International Journal of Science Education, 17(3), 343-355.
Locaylocay, J., Berg, E. & Mango, M.(2006). Changes in college students‟ conceptions of chemical equilibrium. Research and the Quality of Science Education, 8, 459-470. Orbay, M., Özdoğan, T., Öner,F., Kara, M. & Gümüş, S. (2003). "Fen bilgisi laboratuar
uygulamaları I-II" dersinde karşılaşılan güçlükler ve çözüm önerileri. Milli Eğitim
Dergisi, 157.
Özmen, H. & Yıldırım, N. (2005). Çalışma yapraklarının öğrenci başarısı üzerine etkisi: Asitler ve bazlar örneği. Türk Fen Eğitimi Dergisi, 2(2), 125-142.
Piquette, J. S. & Heikkinen, H. W.(2005). Strategies reported used by instructors to address student alternate conceptions in chemical equilibrium. Journal of Research in Science
Teaching, 42, 1112-1134.
Quílez, J. (2004). Changes in concentration and in partial pressure in chemical equilibria: Students and Teachers‟ misunderstandings. Chemistry Education: Research and
Practice, 5(3), 281–300.
Saka, A., & Akdeniz, A.R. (2001). Biyoloji Öğretmenlerine Çalışma yaprağı Geliştirme ve
Kullanma Becerileri Kazandırmak İçin Bir Yaklaşım, Yeni Bin Yılın Başında
Türkiye‟de Fen Bilimleri Sempozyumu, İstanbul, Maltepe University.
Sandberg, M. & Bellamy, M. (2004). A Web-based applet to teach Le Chatelier's Principle.
Journal of Science Education, 5(1), 41.
Sarıçayır, H. (2007). Kimya Eğitiminde Kimyasal Tepkimelerde Denge Konusunun Bilgisayar
Destekli ve Laboratuar Temelli Öğretiminin Öğrencilerin Kimya Başarılarına ve Hatırlama Düzeylerine ve Tutumlarına Etkisi, Doktora Tezi, Marmara Üniversitesi
Yıldırım, Kurt & Ayas / TUSED / 8(3) 2011 55
Sepet, A., Yılmaz, A. & Morgil, İ. (2004). Lise ikinci sınıf öğrencilerinin Kimyasal Denge konusundaki kavramları anlama seviyeleri ve kavram yanılgıları. Hacettepe Üniversitesi
Eğitim Fakültesi Dergisi, 26, 148-154.
Serin, G. (2002). Fen Eğitiminde Laboratuar, Fen Bilimleri Eğitimi Sempozyumu, İstanbul, Maltepe University, 403-406.
Temel, H., Oral, B & Avanoğlu, Y. (2000). Kimya öğrencilerinin deneye yönelik tutumları ile titrimetri deneylerini planlama ve uygulamaya ilişkin bilgi ve becerileri arasındaki ilişkinin değerlendirilmesi. Çağdaş Eğitim Dergisi, 264, 32-38.
Thomas, P.L. & Schwenz, R.W. (1998). College physical chemistry students‟ conceptions of equilibrium and fundamental thermodynamic. Journal of Research in Science Teaching, 35, 1151-1160.
Tyson, L., Treagust, D. F. & Bucat.,R.B. (1999). The complexity of teaching and learning chemical equilibrium. Journal of Chemical Education, 76 (4), 554-558.
Üce, M, & Şahin, M. (2001). Marmara Üniversitesi Atatürk Eğitim Fakültesi Kimya Eğitimi
Anabilim Dalı Öğrencilerinin Kullandıkları Laboratuarlar Hakkındaki Görüşleri, Fen
Bilimleri Eğitimi Sempozyumu, İstanbul, Maltepe University, 398–402.
Üce, M., Sarıçayır, H. & Demirkaynak, N. (2003). Ortaöğretim kimya eğitiminde asitler ve bazlar konusunun öğretiminde klasik ve deneysel yöntemlerin başarıya ve kimya tutumuna etkisinin karşılaştırılması. M.Ü. Atatürk Eğitim Bilimleri Dergisi, 18, 93-104. Voska, K.W. & Heikkinen, H.W. (2000). Identification and analysis of student conceptions
used to solve chemical equilibrium problems. Journal of Research in Science Teaching, 37(2), 160-176.
Weerawardhana, A. (2003). Developing Conceptual Understanding of Chemical Equilibrium
Through the Use of Computer-based Visualization Software, 9th International
Conference on Sri Lanka Studies, 28-30 November, Matar, Sri Lanka.
Wheeler, A.E. & Kass, H. (1978). Student misconceptions in chemical equilibrium. Science
Education, 62, 223–232.
Yıldırım, A. (2000). Kimyasal Denge Konusundaki Kavramların Lise II Öğrencilerince
Anlaşılma Düzeyi ve Karşılaşılan Yanılgılar, Yüksek Lisans Tezi, K.T.Ü. Fen Bilimleri
Enstitüsü, Trabzon.
Yıldırım, N., Bak, Z. & Ayas, A. (2007). Kimyasal Denge Konusundaki Kavram Yanılgılarına
Yönelik Gelişimsel Bir Çalışma, 16. Ulusal Eğitim Bilimleri Kongresi, Tokat, Gazi
Yıldırım, Kurt & Ayas / TUSED / 8(3) 2011 56
Appendix: A Sample Worksheet
Effect of Temperature on Chemical Equilibrium
……… ………
Let’s observe, what’s happening when temperature of system is increased!
Equipments : 250 ml hot water, 250 ml iced water, 2 g Cu(NO3)2, 2g NaCI, 4 test tube, 2 beaker
1. Solve Cu(NO3)2 and NaCl salts into a test tube with pure water. Put the solution into two separate test tubes. The reaction equation is below.
CuCl4(aq) + H2O(l) Cu(H2O)42+ (aq) + 4Cl-(aq) + HEAT
2. Put the first test tube in a beaker with half full ice-water and observe color change. Record your observation results. What’s the reason of change, explain why?.
……… ………
3. Put the second test tube in a beaker with half full hot water and observe color change. Record your observation results. What’s the reason of change, explain why?.
……… ………
4. Put the first test tube in a beaker with hot water and put the second test tube in a beaker with ice-water and observe color change. Record your observation results. What’s the reason of change, explain why?. ……… ………
5. According your observations and Le Chatelier principle, explain that how the equilibrium situation will
affected when temperature is decreased in exothermic reactions.
……… ………
The reaction below is equilibrium situation in constant temperature and volume. How the equilibrium situation is effected when temperature of system is increased?
Yıldırım, Kurt & Ayas / TUSED / 8(3) 2011 57
Answer the questions below with your group mates.
6. Which changes will occur in forward and reverse reaction rate compared to their initial states when the temperature of equilibrium system is increased? Explain your answer using collision theory and kinetic theory.
……… ……… ………
7. How the equilibrium situation and equilibrium constant are affected when temperature of system is increased in exothermic reactions? Explain your answer with your reasons.
……… ……… ………
8. How the concentrations of reactants and products are change compared to their initial states when temperature of system is increased in endothermic reactions? Explain your answer with its reasons. ……… ……… ………
9. 2 A2(g) + B2(g) 2 A2B(g) ΔH < 0 when this reaction is on equilibrium situation in t1 time and in constant volume;
How the the concentrations of A2, A2B and B2 change when the temperature of system is increased until occurrence of a new equilibrium situation? Write the reasons of your answer on the blanks.
……… ……… ……… ……… Concentration (Mole/L) Time (sn)
Yıldırım, Kurt & Ayas / TUSED / 8(3) 2011 58
... ... ...
How the concentrations of A2, A2B and B2 change when the temperature of system is decreased until occurrence of a new equilibrium situation? Write the reasons of your answer on the blanks.
Concentration (Mole/L)