SEARCHING THE OPTIMUM SOLUTION FOR
NETWORK CONGESTION CAUSED BY
ON-GRID PV UNITS
Waleed Mohammed M. ABURAS
2021
MASTER THESIS
ELECTRICAL AND ELECTRONIC
ENGINEERING
Thesis Advisor
SEARCHING THE OPTIMUM SOLUTION FOR NETWORK CONGESTION CAUSED BY ON-GRID PV UNITS
Waleed Mohammed M. ABURAS
T.C.
Karabuk University Institute of Graduate Programs
Department of Electrical and Electronic Engineering Prepared as Master Thesis
Thesis Advisor
Assist. Prof. Dr. Mustafa GÖKDAĞ
KARABUK January 2021
I certify that in my opinion the thesis submitted by Waleed Mohammed M. ABURAS titled “SEARCHING THE OPTIMUM SOLUTION FOR NETWORK CONGESTION CAUSED BY ON-GRID PV UNITS” is fully adequate in scope and in quality as a thesis for the degree of Master of Science.
Assist. Prof. Dr. Mustafa GÖKDAĞ ... Thesis Advisor, Department of Electrical and Electronic Engineering
APPROVAL
This thesis is accepted by the examining committee with a unanimous vote in the Department of Electrical and Electronic Engineering as a Master of Science thesis. January 18, 2021
Examining Committee Members (Institutions) Signature
Chairman : Assist. Prof. Dr. Recep ÇAKMAK (GU) ...
Member : Assist. Prof. Dr. Ozan GÜLBUDAK (KBU) ...
Member : Assist. Prof. Dr. Mustafa GÖKDAĞ (KBU) ...
The degree of Master of Science by the thesis submitted is approved by the Administrative Board of the Institute of Graduate Programs, Karabuk University.
Prof. Dr. Hasan SOLMAZ ...
“I declare that all the information within this thesis has been gathered and presented in accordance with academic regulations and ethical principles and I have according to the requirements of these regulations and principles cited all those which do not originate in this work as well.”
ABSTRACT
M. Sc. Thesis
SEARCHING THE OPTIMUM SOLUTION FOR NETWORK CONGESTION CAUSED BY ON-GRID PV UNITS
Waleed Mohammed M. ABURAS
Karabük University Institute of Graduate Programs
The Department of Electrical and Electronic Engineering
Thesis Advisor:
Assist. Prof. Dr. Mustafa GÖKDAĞ January 2021, 74 pages
A growing proportion of intermittent renewables, such as Wind Energy Systems (WPS), PV systems, Heat Pumps (HPs), and Electric Vehicles (EVs), have become a great challenge for the administration and operation of modern power systems. The fundamental problem in a deregulated environment is the maintenance of a power grid’s stability and efficiency when the grid is congested. Deregulated power grids have significant issues of congestion, which occurs as transmission capacity reaches its limits. When power grid interference occurs, system disruptions can result in further interruptions to a connected system. The shortage, too, prohibits the acquisition of desired electrical power in the transmission system, requiring customers to purchase energy from other sources at higher prices. Congestion may occur due to a lack of control between production and power supplies or unforeseen eventualities such as power supply failure, unexpected increases in demand, and failure of equipment.
This may be solved with the generation and injection of plentiful renewable energies into the grid.
Congestion in grids must be immediately addressed to ensure grid reliability and to prevent further obstruction. This thesis focuses on power congestion and the excess injected into a grid. Congestion control is a solution that has made an adjuster and efficient power system without compromising network protection that will keep buyers and sellers alike. Two keys of Congestion Management (CM) techniques can be enforced. These are cost-free techniques and non-cost-free techniques. This study considers one of the cost-free approaches (removing a number of solar units from the grid), which have a low economic impact because their marginal costs are insignificant. Selection strategies for detaching solar units are suggested to minimize the required limitation. The Whale Optimization Algorithm (WOA) has been proposed to consider an optimal solution for three constraints tariff limits, power ratio, and prices/energy consumption by selecting the best according to all companies’ strategies, namely, (to reduce production costs as much as possible).
With a view to present the optimal disconnection of PV-based Distributed Generation (DG), this thesis endeavors to provide an overview of an efficient approach to the management of congestion in deregulated power grids. The aim is to increase the number of grid-connected units with a nominal tariff according to power capacity limitations. As an optimization problem, the PV surplus accumulation is exploited and resolved using different optimization techniques. The solar units will continue to power the local load until the selected units have been removed from the distributed network. This study has suggested a practical management method focusing on WOA for the management of congestion of deregulated power grids. The suggested solution maximizes the business gains and enhances local producers’ services while considering the actual balance of power and congestion constraints. The simulation results show that the PV system’s optimal disconnection will decrease tariff costs and reduce transmission congestion.
Keywords : Smart Grid, Network Congestion Problem, Optimization. Science Code : 91438
ÖZET Yüksek Lisans Tezi
ŞEBEKE BAĞLI FV ÜNİTELERİNİN NEDEN OLDUĞU AĞ TIKANIKLIĞI İÇİN OPTİMUM ÇÖZÜMÜ ARAMA
Waleed Mohammed M. ABURAS
Karabük Üniversitesi Lisansüstü Eğitim Enstitüsü
Elektrik Elektronik Mühendisliği Anabilim Dalı
Tez Danışmanı:
Dr. Öğr. Üyesi Mustafa GÖKDAĞ Ocak 2021, 74 sayfa
Rüzgar Enerjisi Sistemleri (RES), FV Sistemleri, Isı Pompaları (IP'ler) ve Elektrikli Araçlar (EA'lar) gibi kesintili yenilenebilir enerjilerin artan oranı, modern güç sistemlerinin yönetimi ve işletimi için büyük bir zorluktur. Düzensiz bir ortamda temel sorun, şebeke tıkalı olduğunda güç şebekesinin kararlılığını ve verimliliğini korumaktır. Düzensiz elektrik şebekesinin önemli bir tıkanıklık sorunu vardır. Tıkanıklık, iletim kapasitesi sınırlarına ulaştığında meydana gelmektedir. Güç şebekesi paraziti meydana geldiğinde, sistem kesintileri bağlı bir sistemde daha fazla kesintiye neden olabilmektedir. Enerji kıtlığı da da iletim sisteminde istenen elektriğin elde edilmesini engelleyerek, müşterilerin diğer kaynaklardan daha yüksek fiyatlarla enerji satın almasını gerektirmektedir. Üretim ve güç kaynakları arasındaki kontrol eksikliğinden veya güç kaynağı arızası, talepte beklenmedik artış veya ekipman arızası, bol miktarda yenilenebilir enerjinin üretilmesi ve şebekeye olasılıklar nedeniyle tıkanıklık meydana gelebilmektedir.
Şebeke güvenilirliğini sağlamak ve daha fazla tıkanmayı önlemek için şebekedeki tıkanıklık derhal ele alınmalıdır. Bu tez, güç tıkanıklığına ve şebekeye verilen enerji fazlalığına odaklanmaktadır. Tıkanıklık kontrolü, ağ korumasından ödün vermeden ayarlayıcı ve verimli bir güç sistemi oluşturan ve alıcıları ve satıcıları benzer şekilde tutacak bir çözümleyicidir. İki temel kirlilik yönetimi tekniği uygulanabilir. Bu yöntemler pahalı veya masrafsız değildir. Tıkanıklık Yönetimi tekniklerinin iki anahtarı uygulanabilir. Bunlar masraf teknikler ve masrafsız tekniklerdir. Bu çalışma, marjinal maliyetleri önemsiz olduğu için düşük ekonomik etkiye sahip olan maliyetsiz yaklaşımlardan birini (bazı güneş enerjisi ünitelerini şebekeden ayırmayı) ele almaktadır. Gerekli sınırlamayı en aza indirmek amacıyla güneş enerjisi ünitelerini ayırmak için seçim stratejileri önerilmektedir. Balina optimizasyon algoritması, üç tarife limiti, güç oranı ve fiyatlar/enerji tüketimi açısından en uygun çözümü değerlendirmesi, en iyiyi ve tüm şirketlerin stratejisine göre en iyiyi seçmesi, yani üretim maliyetlerini mümkün olan en düşük maliyetlere düşürmesi için önerilmiştir. FV tabanlı dağıtılmış jeneratörlerin (DJ) optimum bağlantı kesintisi görüşüyle, bu tez düzensiz güç şebekelerindeki tıkanıklığı yönetmeye yönelik verimli yaklaşıma genel bir bakış sağlamaya çalışmaktadır. Güç kapasitesi sınırlamalarına göre nominal tarifeli şebekeye bağlı ünitelerin sayısının arttırılması hedeflenmektedir. Bir optimizasyon problemi olarak, FV fazlalık birikiminden yararlanılmış ve farklı optimizasyon teknikleri kullanılarak çözülmüştür. Güneş enerjisi üniteleri, seçilen üniteler dağıtılmış ağdan çıkarılıncaya kadar yerel yüke güç sağlamaya devam edecektir. Bu çalışma, düzensiz güç şebekelerinin tıkanıklık yönetimi için BOA 'ya (Balina Optimizasyon Algoritmasına) odaklanan pratik bir yönetim metodu önermektedir. Önerilen çözüm, gerçek güç dengesini ve tıkanıklık kısıtlamalarını göz önünde bulundururken, iş kazançlarını en üst düzeye çıkarmakta ve yerel üreticilerin hizmetlerini geliştirmektedir. Simülasyon sonuçları, FV sisteminin optimum bağlantı kesintisinin tarife maliyetlerini düşüreceğini ve iletim tıkanıklığını azaltacağını göstermektedir.
Anahtar Kelimeler : Akıllı Şebeke, Ağ Tıkanıklığı Problemi, Optimizasyon. Bilim Kodu : 91438
ACKNOWLEDGMENT
First and foremost, all praises and thanks go to Allah, the Almighty, for His never-ending showers of blessings throughout my research work.
I would like to express my profound and sincere gratefulness to my research supervisor Assist. Prof. Dr. Mustafa GÖKDAĞ, for giving me the valuable opportunity to conduct research under his guidance and for providing me with invaluable constructive feedback throughout the study. It was such a great honor to work and study under his supervision.
I am enormously indebted to my mother and my late father for their endless love, prayers, caring and sacrifices for educating and preparing me for my future. I am also obliged to my wife and my children for their love, understanding, prayers and continuing support to finish this research. Additionally, I would like to extend my thanks to my sisters and brother, for their continuous support.
CONTENTS Page APPROVAL ... ii ABSTRACT ... iv ÖZET... vi ACKNOWLEDGMENT ... viii CONTENTS ... ix
LIST OF FIGURES ... xii
LIST OF TABLES ... xiii
SYMBOLS AND ABBREVIATIONS INDEX... xv
PART 1 ... 1 INTRODUCTION ... 1 1.1. MOTIVATION ... 1 1.2. ELECTRICITY GRID ... 2 1.3. DISTRIBUTED GENERATION ... 4 1.4. PHOTOVOLTAIC SYSTEM ... 5
1.4.1. Stand-Alone Systems (Off-Grid) ... 5
1.4.2. On-Grid Systems ... 6
1.5. REVIEW OF CONGESTION MANAGEMENT ... 8
1.5.1. Direct Control Methods ... 9
1.5.2. Indirect Control Methods ... 10
1.6. KNAPSACK PROBLEM ... 12
1.7. META-HEURISTIC OPTIMIZATION TECHNIQUES ... 13
1.7.1. Differential Evolution ... 14
1.7.2. Ant Colony Optimization ... 15
1.7.3. Genetic Algorithm ... 15
Page
PART 2 ... 17
PROPOSED ALGORITHM FOR ON-GRID PV UNIT DISCONNECTION ... 17
2.1. INTRODUCTION ... 17
2.2. PROBLEM DEFINITION ... 18
2.3. THE PV SYSTEM ... 19
2.4. AVAILABLE TRANSFER CAPABILITY ... 20
2.5. KNAPSACK PROBLEM ... 22
2.6. PROBLEM FORMULATION ... 23
2.7. THE PROPOSED GREEDY ALGORITHM ... 24
2.8. CASE STUDY ... 26
2.9. PARTICLE SWARM OPTIMIZATION ... 29
2.9.1. Size of Swarm ... 30
2.9.2. Position ... 30
2.9.3. Velocity... 30
2.9.3.1. Objective Function ... 32
2.10. WHALE OPTIMIZATION ALGORITHM ... 34
2.10.1. Encircling Prey ... 35
2.10.2. Bubble Attacking of the Prey ... 35
2.10.3. Searching for Prey (Exploration Phase) ... 37
PART 3 ... 44
3.1. INTRODUCTION ... 44
3.2. SYSTEM MODELING AND SIMULATION ... 44
3.3. SYSTEM PERFORMANCE UNDER TARIFF CONSTRAINT ... 46
3.3.1. System Modeling with ATC 250 kW ... 46
3.3.2. System Modeling with ATC 350 kW ... 47
3.3.3. System Modeling with ATC 315 kW ... 48
3.4. SYSTEM PERFORMANCE UNDER POWER RATIO CONSTRAINT .... 49
3.5. SYSTEM MODELING WITH ATC 250 kW ... 50
3.5.1. System Modeling with ATC 350 kW ... 51
Page 3.6. SYSTEM PERFORMANCE UNDER TARIFF AND POWER RATIO
CONSTRAINTS ... 52
3.6.1. System Modeling with ATC 250 kW ... 52
3.6.2. System Modeling with ATC 350 kW ... 54
3.6.3. System Modeling with ATC 315 kW ... 55
3.7. RESULT ANALYSIS ... 55
PART 4 ... 66
CONCLUSION AND FUTURE WORK ... 66
4.1. CONCLUSION ... 66
4.2. FUTURE WORK ... 67
REFERENCES ... 68
LIST OF FIGURES
Page
Figure 1.1. Traditional power grid ... 3
Figure 1.2. Smart grid ... 3
Figure 1.3. Distributed Generation with bidirectional power flow ... 4
Figure 1.4. Off-Grid solar system ... 5
Figure 1.5. A grid-connected solar system with batteries ... 6
Figure 1.6. A grid-connected solar system without batteries. ... 7
Figure 1.7. Smart meter ... 8
Figure 2.1. Rooftop PV system of a Swiss logistics firm, Switzerland ... 18
Figure 2.2. Schematic diagram of the grid-tie solar system. ... 19
Figure 2.3. Example of a systematic model. ... 22
Figure 2.4. Case study load flow. ... 27
Figure 2.5. Flowchart of the PSO algorithm. ... 32
Figure 2.6. Unique bubble-net feeding methods of humpback whales and the mathematical model ... 36
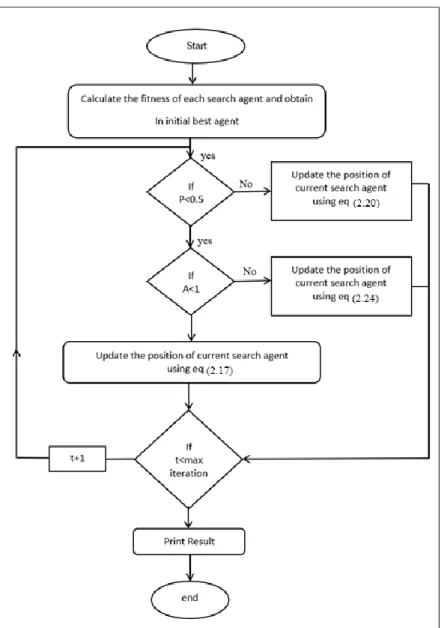
Figure 2.7. Flowchart of the proposed WOA. ... 38
Figure 2.8. Convergence curve at PATC = 300 kW. ... 41
Figure 2.9. Convergence curve at PATC = 160 kW. ... 42
Figure 3.1. Load flow of the system. ... 45
Figure 3.2. Convergence curve at cost constraint and PATC = 650 kW. ... 62
Figure 3.3. Convergence curve at power ratio constraint and PATC = 650 kW. ... 63
Figure 3.4. Convergence curve at cost power ratio constraints and PATC = 650 kW ... 64
LIST OF TABLES
Page Table 2.1. Case study information at PATC = 300 kW. ... 27 Table 2.2. Selected unit by the Greedy algorithm at (PATC = 300 kW). ... 28 Table 2.3. Selected unit by the Greedy algorithm at PATC = 160 kW. ... 29 Table 2.4. Units selected by PSO compared with the Greedy Algorithm at
PATC = 300 kW. ... 33 Table 2.5. Units selected by PSO compared with the Greedy Algorithm at
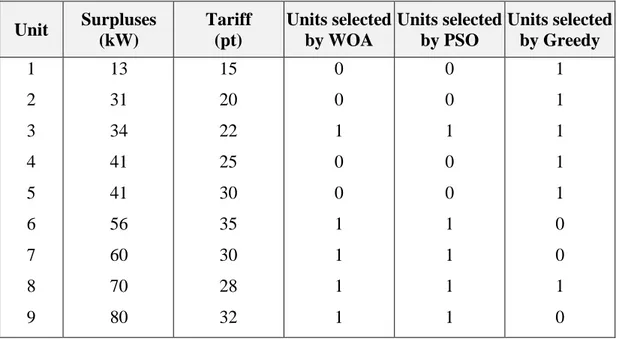
PATC = 160 kW. ... 34 Table 2.6. Units selected by WOA comparing with PSO and Greedy Algorithm
for PATC = 300 kW. ... 39 Table 2.7. Units selected by WOA comparing with PSO and Greedy Algorithm
for PATC = 160 kW. ... 40 Table 3.1. Case study information. ... 46 Table 3.2. Units selected by WOA with minimm tariff constraint for PATC =
250 kW. ... 47 Table 3.3. Selected units with minimum tariff constraint for PATC = 350 kW. ... 48 Table 3.4. Selected units with minimum tariff constraint for PATC = 315 kW. ... 49 Table 3.5. Selected units with a high power ratio constraint for PATC = 250 kW. ... 50 Table 3.6. Selected units with a high power ratio constraint for PATC = 350 kW. ... 51 Table 3.7. Selected units with a high power ratio constraint for PATC = 315 kW. ... 52 Table 3.8. Selected units with minimum tariff and high-power constraints for PATC = 250 kW. ... 53 Table 3.9. Selected units with minimum tariff and high-power ratio constraints
for PATC = 350 kW. ... 54 Table 3.10. Selected units with minimum tariff and high-power ratio constraints for
PATC = 315 kW. ... 55 Table 3.11. Selected units using WOA compared with PSO under different
constraints at PATC = 250 kW. ... 56 Table 3.12. Selected units using WOA compared with PSO under different
Page Table 3.13. Selected units using WOA compared with PSO under different
constraints at PATC = 315 kW. ... 58 Table 3.14. Selected units using WOA compared with PSO under different
SYMBOLS AND ABBREVIATIONS INDEX
ABBREVIATIONS
ABC-DE : Artificial Bee Colony-Differential Evolution ACO : Ant Colony Optimization
ATC : Available Transfer Capability BKP : Bounded Knapsack Problem CBM : Capacity Benefit Margin CM : Congestion Management
CPSO : Chaotic Particle Swarm Optimization DE : Differential Evolution
DG : Distributed generation
ETAP : Electrical Transient Analyzer Program ETC : Existing transmission commitments EVs : Electric Vehicles
FACTS : Flexible Alternating Current Transmission Systems GA : Greedy Algorithm
HPs : Heat Pumps
ISSO : Improved Simplified Swarm Optimization KP : Knapsack problem
SG : Smart Grid
PSO : Particle Swarm Optimization RES : Renewable Energy Sources RMSE : Root Mean Square Error RTPV : Rooftops Photovoltaic SA : Simulated Annealing SOC : System on a Chip
WPS : Wind Power Systems
UKP : Unbounded Knapsack Problem TCSC : Thyristor Controlled Series Capacitor LMP : Locational Marginal Price
ANN : Artificial Neural Network CS : Cuckoo Search Algorithm
CEED : Combined Economic Emission Dispatch Environment PSO-TVAC : PSO with Time Varying Acceleration Co-efficient
PART 1
INTRODUCTION
1.1. MOTIVATION
Energy production from renewable energy sources is the most effective solution for climate change and brings balance within clean sustainable energy. Wind and solar are the most potential renewable energy sources to meet our rapidly increasing power demands. The past ten years have witnessed a significant increase in the search for alternative energy as a clean and environmentally friendly source, for example in Germany the wind generation capacity increased by 107% from 2010 to 2017 to a total of 56 gigawatts, and the capacity obtained from solar energy by 139% To a total of 43 gigawatts in the same period [1].
This increase in renewable energy flowing to the electric grid sometimes exceeds the capacity of the grid in terms of the transmission and distribution system, including cables and transformers, which causes congestion problem which occurs for several reasons, such as the sudden increase in energy demand, outages of generation, etc. Transmission congestion may also be defined as the overload condition where more power flows across transmission lines and transformers than the physical limits of those lines and transformers.
The major goal of the dissertation is to introduce a proposed economic solution for alleviating the congestion problem resulting from the surpluses of PV power installed on the rooftops of houses. This technique goes to optimize system performance and reliability by disconnecting one or more PV consumers from the grid based on applying optimization techniques and considering specific constraints which may be expressed as a knapsack problem.
The Rooftops PV (RTPV) systems were chosen for their advantages such as raising the power factor and reducing the losses of transmission lines, and it is a clean source of energy and the spread of this type of renewable energies provides new job opportunities.
1.2. ELECTRICITY GRID
The electricity grid can be viewed as one of the wonders of the modern engineering world. It is incredibly complex and one of the essential systems for our life today. An electricity grid connects the power generated at different remote locations to end-users. It is because of this grid that schools, industries, complexes and houses are electrified. The electricity grid has seen enormous growth over a number of decades. In the early 1880s, the time at which the electricity grid originated, it was only localized and small. Now in the 21st century, there are vast interconnected electricity networks. The grid is the electricity system that consists of electricity generation, electricity transmission, electricity distribution and electricity consumption. Grids are classifiable as:
• Traditional power grids, or • Smart Grids (SG).
Traditional grids are systems comprised of a place where electric power is generated, usually in remote areas, with the power being supplied to many consumers. A typical traditional grid system is shown in Figure 1.1. Traditional grids lack in terms of two-way communication; this leads to restrictions such as:
• One-way communication
• Few sensors which restrict the available data of the grid • The requirement for annual monitoring
• Manual restoration of traditional grids
• Centralization of generation leading to decreased reliability. • Limited control overpower
On the other hand, a smart grid has two-way communication [2] and the next generation of power supplies. A schematic of a smart grid with two-way digital communication technology is shown in Figure 2.1. The SG can be considered an electrical system that uses information, two-way, cyber-secure communication technologies, and computational intelligence over electricity generation, transmission, substations, distribution, and consumption to achieve a system that is clean, safe, secure, reliable, resilient, efficient, and sustainable [3,4].
Figure 1.1. Traditional power grid [5].
1.3. DISTRIBUTED GENERATION
Existing electrical energy distribution systems in most countries are mainly dependent on centralized generating plants. These plants are installed at distant locations from the load centers. While these plants can meet consumer demand, in several situations, the capacity of centralized power plants during times of peak demand may not be sufficient to satisfy all the demand. During peak hours, Distributed Generation (DG) can meet the extra demand [6]. The distributed systems comprise generators based on biomass, combustion turbines, fuel cells, microturbines, solar thermal and photovoltaic systems, wind turbines, engine/generator sets, storage and control technologies.
A generalized Distributed Generation (DG) is shown in Figure 1.3. Distributed Generation with bidirectional power flow. Some characteristics that were not present in traditional centralized power systems are present in Distributed Generation [7], and include:
• The power generated by distributed generators (DGs) being small and having variations depending on the generator’s primary energy source’s availability and variability
• The position of the DG in the network region depending on the presence of the primary source of energy, and the power flow being bidirectional compared to the traditional generation system of unidirectional power flow.
1.4. PHOTOVOLTAIC SYSTEM
Energy demands have seen a significant rise in the last two decades. Coping with such energy demands in a sustainable manner compels governments worldwide to expand their share mainly in PV technologies. With new technologies coming into existence for Solar PV systems, it has become one of the most promising solutions to meet growing energy demands. Solar PV is economical in its operation and it produces clean energy. Over the years, it has had a significant role in preventing or decelerating environmental degradation as it serves as an alternative to pollution generating fossil fuels [9,10].
1.4.1. Stand-Alone Systems (Off-Grid)
Off-grid powered solar is employed in a battery-powered solar PV system. During the daytime, solar energy is used to charge the batteries, side by side, providing electricity at night to utilities which will use the energy accumulated in the batteries during the day and on rainy days whenever solar energy is absent [11]. A stand-alone PV system is shown in Figure 1.4.
1.4.2. On-Grid Systems
The photovoltaic on-grid system is the type of system that produces electricity with the assistance of solar photovoltaic harvesters and supplies electrical power to utilities. An on-grid system can be configured with and without a battery back-up system. As illustrated in Figures 1.5 and 1.6, the house is connected to both the national grid and the advanced solar energy network. Energy is always available at night, and even if it is rainy. One can build any number of solar energy systems; however, only one will incur costs if electricity usage does not exceed the amount being produced [13].
Figure 1.5. A grid-connected solar system with batteries [12].
Most decentralized connected solar photovoltaic (PV) installations are grid-connected. They may be regarded as a “Distributed Generation” (DG) and serve a significant purpose in mitigating distribution losses, enhancing power quality,
improving power reliability, offering improved voltage support, and decreasing greenhouse gas emissions [14].
Figure 1.6. A grid-connected solar system without batteries [15].
Grid-connected systems utilize an array of photovoltaic modules to produce power, which is eventually supplied through an on-grid inverter to the main grid. Any excess is transmitted to the grid when the solar array produces a greater amount of energy than is consumed in the building. The gap is obtained from the grid if the solar panel produces less power than that used in the house. Figure 1.7 shows a smart meter (bidirectional network meter). Through grid-connected solar photovoltaic systems for residential users, the gap between grid-imported electricity and excess energy or electricity exported to the grid is tracked [16]. A smart meter is also an automated energy meter that calculates consumers’ energy usage and provides the utility company with more detailed information than a normal energy meter [17]. Smart meters allow:
• Bidirectional interactions in the grid • Quick calculations of power
• Measurements of voltage and frequency
• Tracking of smart meters and regulation of any equipment and appliances used by the user to handle demands and charges.
Figure 1.7. Smart meter [18].
Net metering is an energy strategy that enables consumers to replace all or some of the power consumption with self-produced electricity with renewable sources [19,20].
1.5. REVIEW OF CONGESTION MANAGEMENT
Modern (distributed generation) technologies have drawn attention globally as a new form of clean energy generation that provides flexible power supply support for the electric power system. The rapid installation of distributed generation’s results in capacity challenges in the distribution system operators, i.e., congestions in the network such as cables, transformers, busbars, isolators and voltage boundary violated at the connection points. Congestion is a mode of operation where there is no sufficient transport capacity to employ all transactions at the same time [21]. In this mode, electricity producers and consumers will generate and consume quantities that would cause the system to work within or over one or more transmission limitations, which may prevent the existence of new contracts, resulting in extra power cuts, increases in the price of electricity in some electricity markets, and threaten the safety and
reliability of the system [22]. Congestion could occur due to many reasons, including [23]:
• Lack of communication between production and distribution companies • unexpected incidents such as outages in generation
• Abrupt increases in supply due to loading conditions • Energy surpluses from renewable sources
Lack of attention to congestion in the system may lead to widespread blackouts associated with negative social and economic consequences. Thus, it is necessary to manage congestion to determine the priorities of transactions and commit to a schedule such that it will not overload the network. The management of congestion may be referred to as the comprehensive set of action procedures implemented to prevent or improve congestion. Specifically, congestion management refers to managing the network in order not to break both functional and safety constraints. For distribution networks, congestion management approaches can be categorized into two groups:
• Indirect control methods. • Direct control methods. 1.5.1. Direct Control Methods
The direct method means considering re-dispatch of securitized generations, methods of network responsiveness variables, congestion pricing, sector-based approaches and implementation of Flexible Alternating Current Transmission Systems (FACTS) devices [24, 25, 26]. The generation unit may provide an increase or decrease in its output in the same way as it does on a balancing market. At the same time, the device operator must properly select the offer. Congestion management can be interpreted as a generalized problem of optimized energy flow in which optimization variables are re-dispatched from the electrical power output. The requirements function is a minimum of the costs associated with this re-dispatch [27]. Certain papers state the rescheduling; for instance, [28] concentrates on rescheduling in the environment of
power system restructuring using Differential Evolution (DE). It has been taken that the generators relied on the generator sensitivity to the congested line. [29], present the optimal rescheduling of active powers of generators using Particle Swarm Optimization (PSO) and Chaotic Particle Swarm Optimization (CPSO). It has been chosen the generators based on the generator sensitivity to the congested line. The rescheduling has been carried out by taking minimization of cost and satisfaction of line flow limits into consideration. The result shows that the CPSO is the most cost-efficient solution to the congestion management problem compared with conventional PSO. In [30], the author defined the DG unit’s optimal location by the Transmission Line Relief (TLR) sensitivity index. The outcomes indicate that the DG’s optimal connected placement alleviates congestion in transmission lines at load buses. In the study of [31], the congestion in the transmission is not only solved by rescheduling generators considering optimal placement of the distributed generation (DG) unit but also by optimal placement of a Thyristor Controlled Series Capacitor (TCSC). The author solved the problem by Particle Swarm Optimization (PSO) and genetic algorithm for fast convergence ratio and minimizes production cost. The curtailment approach is another methodology that is used for congestion management.
1.5.2. Indirect Control Methods
Indirect (cost-free) control methods belong to business approaches that use market mechanisms to manipulate versatile demand behaviors. Such ways are considered cost-free only because of the marginal nominal costs taken for their use [25]. Indirect methods consider actions such as out-aging of congested lines or operation of the transformer taps, phase shifters, or Flexible Alternating Current Transmission Systems (FACTS) devices [32,33], in this casefor suitable sizing and sitting of FACTS devices Differential Evolution (DE) algorithm has been chosen, after using Differential Evolution algorithm congestion has been significantly decreased. [34] presents the congestion trouble caused by high PV penetration in a residential distribution scheme by introducing a central energy management system, which utilizes a demand response approach to minimize the cost of the system along with scheduling the operation of the appliances and electrical storages in such a way that grid constraints would not be violated. Each house will be scheduled alone and send the data to the central manager
and then after analyzing the obtained data if the results go above the defined criteria the central energy management system will make an optimization to enhance the situation. The results show that the proposed means has decreased the possible problems produced by congestion and enhanced the performance of the distribution system. [35] Presented the influence of DG on congestion. The grid locations are examined to study the influence of DG penetration on Locational Marginal Price (LMP). The power injected by DG is found to reduce the congestion component, which is revealed from the reduced shadow prices associated with the constrained line flow. The optimal dispatch from DG is thus found to reduce the congestion rent and shadow prices associated with the line flow. Moreover, DG with the lower incremental cost is found to have better performance in terms of alleviating congestion in the network. Congestion management is in fact a non-linear optimization problem, having an additional dimension of social welfare. Thus, highly optimized numerical algorithms have been developed using soft computing techniques to provide a solution to this problem. Some important artificial intelligent techniques were used for congestion management for example the firefly algorithm, differential evolution, genetic algorithm, particle swarm optimization, fuzzy system, and hybrid approaches. By using the firefly algorithm in [36] congestion management problem has been solved by optimally rescheduling the active power of generators which are chosen based on the generator sensitivity to the congested line. When using the firefly algorithm, the congestion cost is minimized. Considering the most severe line outage, generator outage in case of emergency, and wheeling transactions in this paper it is found that the firefly algorithm is capable of submitting optimal solutions with low cost in all cases.[37] Proposed a combined technique Artificial Neural Network (ANN) and Cuckoo Search Algorithm (CS) for solving transmission congestion problem of the power system. By comparing the proposed method with the CS algorithm and PSO algorithm, the proposed method reschedules the real power of generation effectively and the congestion management cost reduced. Then, the power loss of the combined method is determined at various congestion levels. In [38] the optimal congestion management approach based on PSO is efficiently minimizing re-dispatch cost, and active power reschedule to the generators. It consists of cost factor Re-dispatched generators selected based on the large magnitude of New definition of generator sensitivity. Unexpected line outage, sudden load variation, and reschedule the active
power to the generators, and reducing the losses are considered in this work. Some of the different optimization techniques reviews for solving the CM problem is proposed in [39]. The author in [40] proposes an approach in a deregulated electricity market with the optimal location of (TCSC) under Combined Economic Emission Dispatch Environment (CEED) using PSO with Time Varying Acceleration Co-efficient (PSO-TVAC). After placing TCSC the investment cost of TCSC and generator rescheduling cost is minimized using Particle Swarm Optimization (PSO) and PSO-TVAC. The results prove that the PSO-TVAC can obtain higher quality solutions for the proposed problem. The congestion management need for a technique of selecting the greatest option among a given arrangement of alternatives in which choices must be taken to optimize or upgrade at least one of the objectives in some stipulated set of conditions, called optimization. An optimization problem is known as obtaining values of the factors that maximize or minimize the objective function while fulfilling the constraints [41]. Optimization problems can be classified into different types among these types, combinatorial optimization problem [41]. In this study, the congestion problem is considered as a Knapsack problem, which is a problem of combinatorial optimization.
1.6. KNAPSACK PROBLEM
The Knapsack Problem (KP) is a probabilistic approach in computer science for solving decision problems. The decision made in this approach is binary. N various item types that are vital; these could include a bottle of water, sandwich, apple, and so on. Each item type has a given set of two objectives, namely a weight (or volume) and a value decides the level of significance amount combined with each unit of this type of element. Since the knapsack has a restricted weight (or volume), the problem is how to load the knapsack with a mixture of units of the specified types of items that yields the ultimate total value. In the past decade, knapsack problems have been studied with considering both theorists and practitioners. From a theoretical point of view, the problem allows the exploitation of several combinational properties and permits more complex optimization problems to be solved through a series of knapsack type.
The crisp set obtained can contain a solution or exclude it. The problem centers on three factors. The knapsack problem has been categorized into many types [42]:
• The 0-1 knapsack problem, which is a particular type of knapsack problem where 1 stands for the inclusion of an item and 0 stands for excluding an article. • The bounded knapsack problem (BKP), in which boundaries are defined for
variables.
• Unbounded Knapsack Problem (UKP), in which variables can take any arbitrary value.
Many variations of the knapsack problem arose from the vast number of basic problem applications [43]. The key variations occur by changing the number of specific problem parameters, such as the number of items, the number of targets or even the number of knapsacks:
• Multi-objective knapsack problem • Multi-dimensional knapsack problem • Multiple knapsack problem
• Quadratic knapsack problem • Subset-sum problem
1.7. META-HEURISTIC OPTIMIZATION TECHNIQUES
In recent years, with the rapid growth of System on a Chip’s (SOC) power of computers has increased quite significantly such that computers can now handle many computationally tricky tasks [44]. The rise in the computational power of systems has contributed to many modern/non-traditional optimization methods. Meta-heuristic algorithms are preferred due to their multi-model handling ability [45]. Optimization problems are solved using global search algorithms as well as nonlinear programming methods. These nonlinear optimization techniques minimize any disparities between computed and targeted performances.
Different meta-heuristic algorithms have been proposed over recent years [46]. The Artificial Bee Colony-Differential Evolution (ABC-DE) algorithm performed best in terms of convergence time and was considered an efficient candidate for a parameter extraction algorithm. In comparison, Particle Swarm Optimization (PSO) shows better performance in terms of its anti-noise ability and accuracy over the other two. Moreover, PSO and the Genetic Algorithm have a significant offering in terms of the low value of the Root Mean Square Error (RMSE) in addition to having greater accuracy. Another nature-inspired algorithm known as the Flower Pollination Algorithm performs better than the Genetic Algorithm, Chaotic Particle Swarm Optimization (CPSO), PSO, and Simulated Annealing (SA). Moreover, existing algorithms are sometimes modified to suffice extraction problems as presented using the Newton Raphson method [47]. Another such algorithm is the Improved Simplified Swarm Optimization (ISSO) algorithm, which is based on simplified swarm optimization. It offers better minimization of least square error between the measured and the extracted data than Simplified Swarm Optimization (SSO) [48].
Most of the listed methods have emerged recently and have arisen as popular methods to solve complex engineering problems. Most of them can handle nonlinear problems and are very useful when compared to traditional optimization problems [49]. The best and most distinct feature of these algorithms lies in the fact that they do not require derivative information of the objective function, which is more or less that they cannot be obtained in many real-life problems. These methods rely on the input-output mapping of the objective function. The first group of techniques, namely the Genetic algorithms and differential evolution, are derived from natural genetics and Darwin’s theory of survival of the fittest. At the same time, particle swarm optimization and ant colony optimization were inspired by the social behavior of birds in flocks and ants in colonies when they migrate from nest to food taking the shortest path [50].
1.7.1. Differential Evolution
Differential Evolution (DE), similar to Genetic Algorithm, hails from the background of the evolutionary algorithm family [51]. It was developed in 1996 by Storn and Price. The algorithm differs from the Genetic Algorithm as the mutation parameter is given
more importance than the crossover [52]. This difference helps DE to become more self-adaptive than the Genetic Algorithm.
1.7.2. Ant Colony Optimization
Ant Colony Optimization (ACO) is based on real ant behavior, which tends to find the shortest distance from the nest to the food source. This effective optimization method was developed by Diego and his associates in the 1990s [53].
1.7.3. Genetic Algorithm
The Genetic Algorithm was introduced by Henry Holland in the early 1960s [54]. This algorithm was inspired by the natural genetics and selection of the fittest theory of Darwin. Initially, a population is created by randomly generating solutions in the search domain, after which a new population is produced by crossover mutation and survival operators.
1.8. THESIS STRUCTURE
The structure of this thesis consists of four parts as follows:
Part One: Introduces the motivation of this thesis, definition and benefits of the modified smart grids, the importance of renewable energy sources, and the contents of this thesis. It also introduces an extensive literature survey of the previous work for congestion management.
Part Two: Presents an introduction explains the advantages of electrical energy exported to the grid through solar energy units installed on the rooftops of houses, also explains the problem definition, formulation, and tackles the congestion possess from the PV surpluses by disconnecting a number of a client with its solar units from the grid according to the cost constraint. The candidate units for disconnection are selecting by three different algorithms.
Part Three: The system execution under different constraints is presented. The constraints applied to the system are min tariff, max power ratio and (min tariff/ max power ratio).
PART 2
PROPOSED ALGORITHM FOR ON-GRID PV UNIT DISCONNECTION
2.1. INTRODUCTION
The last two decades have seen tremendous growth in the field of renewable energy. The most prominent sources of renewable energy that have seen a boom are solar and wind energy. Solar energy is now widely available and can fulfill all the energy demands of humanity. Generally, solar energy is cultivated by installing solar panels on fields, rooftops of houses, offices, and other buildings. Generally, electricity generated by PV systems is installed on rooftops of either residential areas or commercial buildings. Electricity generated by PV systems is generally used for self-consumption, but any surplus can also be fed into the grid at regulated feed-in tariffs. Grid feeding is monitored by a net-metering mechanism, which allows a two-way flow of electricity where the consumer is billed after monitoring for the net consumption (total consumption − own PV production) of electricity. These Rooftops Photovoltaic (RTPV) systems can be installed with or without battery storage, with one integrated net meter or two separate meters (one for grid export and the other for consumption). PV systems deliver a number of advantages regardless of the commercial arrangement, including reductions in transmission and distribution losses, low gestation period, no additional land requirement, enhancement of tail-end grid voltages, reduction of network congestion with higher self-consumption of solar power, and generation of local jobs [55]. Due to these salient features, rooftop PV systems were studied in this thesis. Recently, a Switzerland based company also invested in a 2.34 MW Solar PV (Rooftop) system (Figure 2.1).
2.2. PROBLEM DEFINITION
Congestion tends to be the state of playback for which the transfer capacity is inadequate to employ all exchanged transactions at the same time due to some unexpected emergencies like outages for maintenance work and technical faults [56]. This has occurred in both regulated and deregulated power systems. However, due to competition between power producers and consumers, it occurs more often in deregulated systems [57]. Congestion may occur in several ways, one of them being when power surpluses are generated on either a rooftop or the ground from solar units. There are several ways to solve the congestion caused by PV surpluses, such as [58]:
• Trading the generated units when surpluses are available. • Storing surplus energy efficiently for future use.
• Disconnecting the number of the consumer with its PV units from the grid.
The final solution for congestion alleviation is introduced in this thesis. It is necessary to define the PV system first to study and propose a solution for congestion relief from the power surpluses produced from solar units on the rooftops or on the ground.
2.3. THE PV SYSTEM
PV systems can vary significantly in capacity, ranging from a small rooftop to large installations for generating utilities. Moreover, there are PV systems that operate as off-grid PV systems independently. As shown in Figure 2.2, the maximum amount of power that can be produced depends on different factors, such as temperature levels, irradiation. Solar power is generated as a stream of direct current via the semiconductor cells of PV solar panels. In a normal situation, for most residential and commercial uses, the grid-tie inverter converts the DC power generated from the solar panels into alternating current power. It generates power that meets utility grid specifications so that it is synchronized with grid power before it flows into the grid.
Essentially, there are two ways to prevent the generated solar power from reaching the grid:
• Connection opening between the solar panels and the rest of the network. • Connection opening between the inverter and the grid.
The first method entirely isolates the generated power from the solar panels. On the other hand, the second one enables households to absorb their solar power from another dedicated line from the pole. When energy consumption rises and exceeds the amount produced by the solar panels, the breaker is reconnected to the grid, and grid power can be supplied. Therefore, in this study, we considered the second case. In such an electric system, the power flow analysis is essential to schedule and plan the amount of power flows between two buses of the interconnected system. Available Transfer Capacity (ATC) is the primary indicator of electrical power participation.
2.4. AVAILABLE TRANSFER CAPABILITY
A practical ATC indicates the remaining transfer capacity over and above its already dedicated industrial use in competitive electricity markets [60]. It has been used as an instrument to control competition in the market for electricity marketers’ trading. The value of the ATC is calculated thus:
𝐴𝑇𝐶 = 𝑇𝑇𝐶 − 𝑇𝑅𝑀 − 𝐶𝐵𝑀 − 𝐸𝑇𝐶 (2.1)
The Total Transfer Capability (TTC) is the maximum quantity of power that can be safely transmitted over the network while meeting all protection constraints, i.e., thermal, voltage and stability limits, and the Transmission Reliability Margin (TRM) is the quantity of the transmission capacity that ensures that the network is secure under appropriate system conditions and uncertainties.
Existing Transmission Commitments (ETC) refers to the amount of transmission capacity booked by load-serving organizations for generation reliability requirements for emergency purposes when power generation is not available in one area to be
supplied with purchasing power from other regions [61]. In contrast, CBM refers to the Capacity Benefit Margin. In this study, ATC is used as a critical factor in estimating and minimizing the solar power surplus congestion problem.
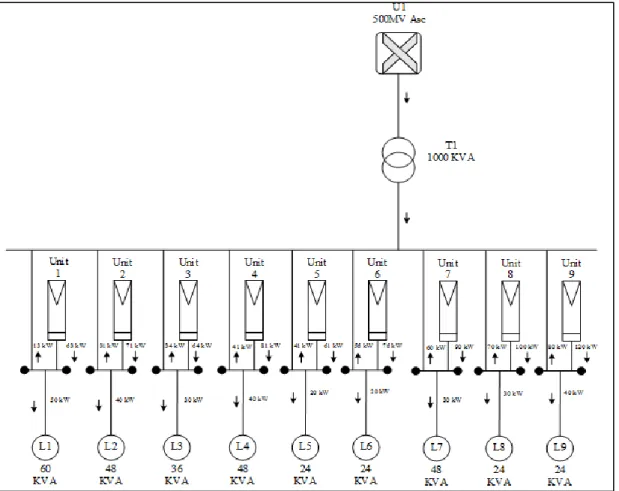
The Electrical Transient Analyzer Program (ETAP) incorporates an example of four investors, as shown in Figure 2.3, with solar panels attached to the distribution line. The investor makes their energy report available, containing information on solar power generation (PG), investor power demand (PD), and the surplus power that flows back to the grid (PS). In this example, every investor, except Investor 1, has a solar surplus with a value of −25 kW as it consumes more energy than it can generate. The demand of 50 kW by Investor 1 may be compensated by an aggregate of solar surplus power generated from the others, or by surpluses produced locally by investors. In both cases, electricity is taken from the distribution line, and the grid will stay with Investor 1.
From a utilitarian point of view, thus meeting the ATC, the resulting surplus can be used for commercial trading. Considering that line capacity cannot support the remaining surpluses in this article, disconnecting some of the solar units is one solution to prevent congestion. It will not reach the ATC limit regardless of the set selected. The method is designed to retain as many units in the selection as possible to avoid disconnection and reconnection.
Therefore, we are considering the second case in this article. In such an electrical system, an analysis of the power flow is essential to schedule and plan for the amount of power flows between two interconnected system buses. ATC is the primary indicator involving electrical power.
Figure 2.3. Example of a systematic model.
2.5. KNAPSACK PROBLEM
The Knapsack problem (KP) is a traditional combinatorial problem that has been studied for several years [62,63]. For such problems, we try to maximize (or minimize) a specific quantity while meeting certain constraints. Vector w consists of n items weights and another vector, v consists of their values, where vi and wi are integers.
𝑤 = (𝑤1, 𝑤2, 𝑤3, … , 𝑤𝑛) 𝑣 = (𝑣1, 𝑣2, 𝑣3, … , 𝑣𝑛) 𝑥 = (𝑥1, 𝑥2, 𝑥3, … , 𝑥𝑛)
To find another n-dimension decision, vector x makes the total maximum value under the limit of the Knapsack. The concrete math description is as follows:
Maximize: ∑ 𝑣𝑖𝑥𝑖 𝑛 𝑖=1 (2.2) Subject to:
∑𝑛 𝑤𝑖𝑥𝑖 ≤ 𝑊 𝑥𝑖{0,1}, 𝑖 = 1,2, … , 𝑛 𝑖=1
(2.3)
If xi = 1, then the ith item will be put into the Knapsack, if xi = 0 then the ith item will
not be put into the Knapsack. This is called the 0–1 Knapsack problem, wherein a fractional amount cannot be taken, and the items must be taken or left out totally. Therefore, we consider a 0/1 KP where Xn = 0 if client n is off-grid and Xn = 1 if the
client n is on-grid.
2.6. PROBLEM FORMULATION
In this work, an optimization approach is used for problem-solving. First, the problem is defined as a traditional optimization problem as follows:
• N clients have installed PV solar units.
• Clients are denoted by number n, where n = 1, 2,…, and N has PV units denoted by Xn.
• Clients may or may not consume power during solar power generation. The power demands of clients are denoted by PD,n.
• A trade-off occurs between the power generated and the results needed in surplus power consumption, and when the generated power in kW is more (less) than required, the corresponding surplus (less) value is an integer and denoted by PS,n.
The four abovementioned points define the problem statement. As can be seen in its nature, it can be categorized as a Knapsack problem. The formal problem statement is given below. The PV units that are connected to the grid are assigned a value of 1, and the units remaining unconnected are assigned a value of 0. After that, the total number of connected clients can be calculated as follows:
𝑈 = ∑ 𝑋𝑛 (2.4)
The goal is to maximize the number of connected clients up to a capacity that the network can handle. The problem statement as an optimization problem is given as follows:
Maximize:
∑ 𝑋𝑛 (2.5)
Subject to:
∑ 𝑃𝑠,𝑛. 𝑋𝑛 ≤ 𝑃𝐴𝑇𝐶 𝑤ℎ𝑒𝑟𝑒 𝑋𝑛 ∈ {0,1} (2.6)
From a power perspective, linking a large number of customers enables more consumers to benefit from the surplus they are producing. We aim to maximize the total power demand value while meeting capacity requirements. On the other hand, any power surplus will be sold through auctions in the future, after extending the feed-in tariff scheme. This will ensure that consumers with lower tariffs remafeed-in connected; subsequently, consumers with a higher tariff will be disconnected.
2.7. THE PROPOSED GREEDY ALGORITHM
Generally, the Greedy Algorithm (GA) can solve the KP, the ATC, and customer data (number of customers (PV units), surpluses, and tariffs) that are fed in Step 1. No clients are disconnected while the network is uncongested. The congested network state (overload) is determined by subtracting the capacity limit from the total N-client surplus. 𝑃𝑂 = ∑ 𝑃𝑠,𝑛 𝑛 𝑛=1 − 𝑃𝐴𝑇𝐶 (2.7)
The surpluses are arranged in ascending order by discovering the congestion (i.e., PO > 0).
𝑃𝑆,1 ≤ 𝑃𝑆,2… … … . ≤ 𝑃𝑆,𝑛 𝑛 ∈ 𝑁 (2.8)
If we suppose that PATC is greater than the minimum surpluses, then the algorithm searches for a split unit (Step 2). Units are chosen in ascending order, based on their surpluses. The algorithm will stop when an overload of the capacity is found:
∑ 𝑃𝑠,𝑛 𝑠−1 𝑛=1 ≤ 𝑃𝐴𝑇𝐶 𝑎𝑛𝑑 ∑ 𝑃𝑠,𝑛 𝑠 𝑛=1 > 𝑃𝐴𝑇𝐶 (2.9)
Note that the capacity constraint will be exceeded if the Ps value is added. Unit (client)
S is split, dividing the solution by x = 1 for n = 1; 2; s–1(left) and x = 0 for n = s; s + 1; (right) N.
𝑥 = [𝑋1 𝑋2 𝑋𝑠−1 𝑋𝑠 𝑋𝑠+1 𝑋𝑁] = [1 1 1 0 0 0]
The overflowed power (PE) will be identified by adding the split surplus value, which is incorporated into the two conditions set out in Step 3. A one-to-one replacement would be allowed for the number of candidate units in the left and right of the split unit. 𝑃𝐸 = ∑ 𝑃𝑠,𝑛− 𝑃𝐴𝑇𝐶 𝑠 𝑛=1 (2.10) Step 1
1 Initialize algorithm, collect units available for transfer, Calculate ATC, surpluses in each unit, tariff of each unit.
2 Check for capacity overload 3 if PO ≤ 0 then
4 Disconnect none 5 else
6 Sort surpluses in ascending order Step 2 (find split unit)
7 if PATC > the min surplus amongst N units then 8 Z = PATC
10 if PS;i ≤ Z then 11 Z = Z - PS;i 12 else
13 No more units can be accommodated 14 s = i
15 end if
16 end for Step 3 (Discover candidate(s))
17 c = s – 1
18 Compute the overflowed power PE 19 for w =1 to c do
20 Find candidate(s) in left side (x left) 21 if PE ≤ P S,w then
22 One in left side among units w-(s -1) with min tariff is the candidate. 23 for k = s + 1 to N do
24 Find candidate(s) in right side (xright) 25 if PS;k - PS;s ≤ PS;left - PE then
26 One in right side among units s-(k - 1) with minimum tariff is the candidate 27 if tariff left > tariff right then
28 Unit left is substituted by unit right 29 end if 30 end if 31 end for 32 end if 33 end for 34 end if 35 end if 2.8. CASE STUDY
A case study is presented in Figure 2.4. ATC (300 kW) is equipped with nine PV units owned by consumers with a load power of 300 kW, as shown in Figure 2.4. When the load flow of the system is applied, the PV unit power is calculated using the ETAP, which will satisfy the user load. To feed other users, the excess power (surpluses = 426 kW) can return to the grid. The line capacity cannot handle the residual surpluses that surpass the ATC value. By applying the Greedy Algorithm, disconnecting specific customers would be the correct approach to avoid congestion. The information about N customer-owned PV units (surpluses in kW, ATC in kW, and tariff in pilasters) is collected initially. No units are disconnected without overloading the network. By detecting network congestion (i.e., PO > 0) while applying (Eq. 2.7), the surpluses are set in ascending order. Although PATC (300 kW) is more than the minimum surplus (13 kW), it was found that the split unit discovered the unit.
Figure 2.4. Case study load flow.
Table 2.1. Case study information at PATC = 300 kW.
Unit Surpluses (kW) Tariff (pt)
1 2 3 4 5 6 7 8 9 13 31 34 41 41 56 60 70 80 15 20 22 25 30 35 30 28 32
Unit 8 (whose surplus value is 70 kW) is found to be the split one. Now the candidate in both the left and right sides of the split unit will be determined. By knowing
PE = 46 kW derived from Eq. (2.10), Unit 7, whose surplus value is 60 kW, is the only single candidate on the left side of the split unit (rows 21-22) in the flowchart. Unit 8, whose surplus value is 70 kW, is selected to be the candidate on the right side of the split unit (rows 25-26). In the end, Unit 7 is removed and substituted with Unit 8 without overriding the limit of the capacity.
𝑖. 𝑒. ∑ 𝑃𝑠,𝑛 + 𝑃𝑠,8= 300 ≤ 𝑃𝐴𝑇𝐶 6
𝑛=1
The results of applying the proposed knapsack GA are shown in Table 2.2, which shows the selected units to be disconnected. It is shown that Units 7 and 9 are selected to be disconnected at PATC = 300 kW, keeping more units connected to the grid with 286 kW and tariff 172 pt. for the connected units.
Table 2.2. Selected unit by the Greedy algorithm at (PATC = 300 kW). Unit Surpluses (kW) Tariff (pt) Units selected by Greedy
1 2 3 4 5 6 7 8 9 13 31 34 41 41 56 60 70 80 15 20 22 25 30 35 30 28 32 1 1 1 1 1 1 0 1 0
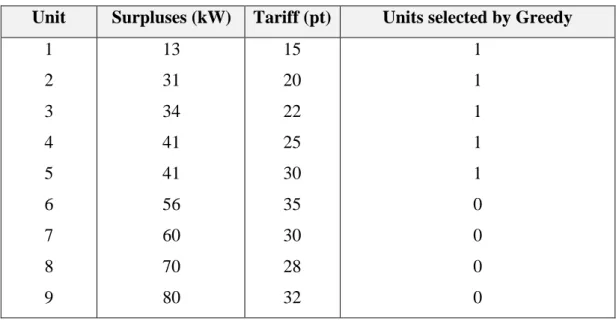
In another case shown in Table 2.3 for PATC = 160 kW, Unit 6 is found to be the split unit, which is number 6 with surplus = 56 kW while knowing PE = 56. The results of applying the proposed knapsack GA are shown in Table 2.3, which shows the selected units to be connected. It is shown that Units 1, 2, 3, 4, and 5 are selected to be connected at PATC = 160 kW, keeping more units connected to the grid with 160 kW and tariff 112 pt.
Table 2.3. Selected unit by the Greedy algorithm at PATC = 160 kW. Unit Surpluses (kW) Tariff (pt) Units selected by Greedy
1 2 3 4 5 6 7 8 9 13 31 34 41 41 56 60 70 80 15 20 22 25 30 35 30 28 32 1 1 1 1 1 0 0 0 0
2.9. PARTICLE SWARM OPTIMIZATION
Particle Swarm Optimization (PSO) was proposed by Kennedy in 1995 [64]. This algorithm mimics the behavior of a group of animals. The term particle denotes a single individual in the group, such as a bird in a flock or a fish in a school of fish [65]. Each particle in a group behaves in a distributed manner, having individual intelligence and that of a collective group, where if one individual finds food, then the group instantly tries to follow the individual no matter how far they individually are from the food. Optimization methods that work on swarm intelligence are known as behaviorally inspired methods, unlike Genetic Algorithm and DE, which are evolutionary types of techniques. While solving the optimization problems using the PSO method, the particles are initially scattered in the domain. Each particle has two parameters, namely velocity and position [66]. All the particles remember their best searched position, interact with each other and adjust their respective velocities, and positions, keeping in mind their best-searched position. The best among the positions of individual particles is known as a global best position. The main features of PSO are as follows:
• Each particle contributes to the velocity vector of other particles.
• Generally, algorithms mimicking the social behavior of animals have a higher convergence rate when compared to evolutionary-type algorithms. However, at times, social behavior-driven algorithms tend to overshoot the algorithm as a virtue of fast convergence.
• A parameter of θ is introduced to check for the problem of overshooting. 2.9.1. Size of Swarm
The size of the swarm should be chosen assuming the complexity of the problem. A more significant number of particles would result in more computation in each iteration, which in turn increases the computational burden. On the other hand, fewer particles may take a larger number of iterations to converge. Generally, 10-20 particles are chosen for any individual problem [67].
2.9.2. Position
Initially, all the particles are randomly scattered (similar to chromosomes in the genetic algorithm). The position of the particle is similar to the value it has attained as a design variable. These positions are updated by iteration according to the velocity that the particle attains:
𝑋𝑗(𝑖) = 𝑋𝑗(𝑖 − 1) + 𝑉𝑗(𝑖); 𝑗 = 1,2, … , 𝑁 (2.11)
Where j is the particle number and i is the iteration number. X and V are the position and velocity of the particle, respectively.
2.9.3. Velocity
The rate at which a particle changes position in an iteration is known as velocity. Velocity is dynamic and can vary rapidly from one iteration to another. The velocity of particles in a particular iteration is calculated thus:
𝑉𝑗(𝑖) = 𝑉𝑗(𝑖 − 1) + 𝑐1𝑟1[𝑃𝐵𝑒𝑠𝑡,𝑗− 𝑋𝑗(𝑖 − 1)] + 𝑐2𝑟2 [𝐺𝐵𝑒𝑠𝑡− 𝑋𝑗(𝑖 − 1)]; 𝑗 = 1,2, … , 𝑁
(2.12)
Where c1 and c2 are the cognitive (individual) and social (group) learning rates, respectively, and r1 and r2 are uniformly distributed random numbers in the range 0 to 1. The parameters c1 and c2 denote the relative importance of the memory (position) of the particle itself to the memory (position) of the swarm. PBest is the best position
the particle has achieved throughout the iterations, and GBest is the global best position
achieved among all the particles.
The inertia weight θ was initially introduced by Shi and Eberhart in 1999 to dampen the velocities (or iterations) over time, enabling the swarm to converge more accurately and efficiently compared to the original PSO algorithm in the equation. Normally, the value of the inertia term is selected to be between 0.9 to 0.4, but it is subjected to the application of the problem and can vary accordingly.
𝑉𝑗(𝑖) = 𝜃𝑉𝑗(𝑖 − 1) + 𝑐1𝑟1[𝑃𝐵𝑒𝑠𝑡,𝑗 − 𝑋𝑗(𝑖 − 1)] + 𝑐2𝑟2[𝐺𝐵𝑒𝑠𝑡− 𝑋𝑗(𝑖 − 1)] 𝑗 = 1,2, … , 𝑁
(2.13)
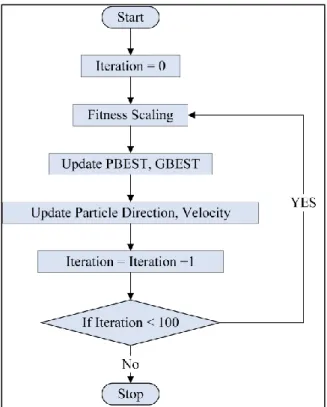
Greater insight is presented through the particle swarm optimization flowchart in Figure 2.5. The computational steps involved in solving the problem are presented below:
1. Randomly scatter particles in the domain of the problem; a particle swarm is usually chosen to be ten times the design variable.
2. Compute PBest and GBest for the current iteration.
3. Update position and velocity vector of all the particles in a swarm by state tarnation rules given in (Eqs.2.11) and (2.13), respectively.
4. If convergence criteria are met, then stop; otherwise, go to Step 2 and compute and update the velocities of the particles. The convergence criteria for this particular problem were chosen to be 100 iterations, as the minima/maxima were being achieved under 100 iterations observed from
Figure 2.5. Flowchart of the PSO algorithm.
2.9.3.1. Objective Function
The derived problem mentioned above can also be solved using the PSO algorithm. The problem is a constraint minimization problem; its correct mathematical statement is given below:
Minimize:
∑ 𝑇𝑛𝑋𝑛 (2.14)
Subject to:
∑ 𝑃𝑠,𝑛 𝑋𝑛 ≤ 𝑃𝐴𝑇𝐶 𝑥𝑛 ∈ {0,1} (2.15)
If we suppose that there is a case defined below that needs to be optimized as shown in Table 2.1:
𝑂𝑓 = 𝑚𝑖𝑛[15 × (1) + 20 × (2) + 22 × (3) + 25 × (4) + 30 × (5) + 35 × (6) + 30 × (7) + 28(8) + 32 × (9)]
Subjected to:
13 × (1) + 31 × (2) + 34 × (3) + 41 × (4) + 41 × (5) + 56 × (6) + 60 × (7) + 70 × (8) + 80 × (9)300
In this problem, using MATLAB, the result of the problem is shown in Table 2.4.
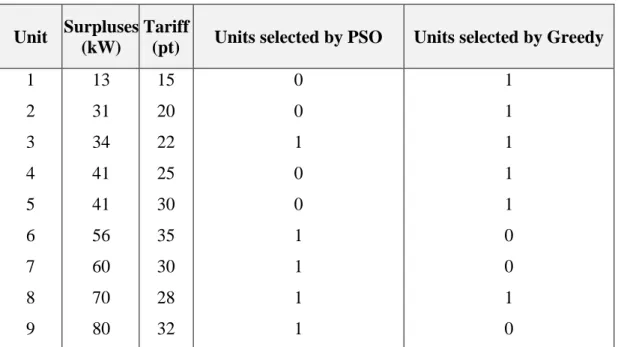
Table 2.4. Units selected by PSO compared with the Greedy Algorithm at PATC = 300 kW.
Unit Surpluses (kW)
Tariff
(pt) Units selected by PSO Units selected by Greedy 1 2 3 4 5 6 7 8 9 13 31 34 41 41 56 60 70 80 15 20 22 25 30 35 30 28 32 0 0 1 0 0 1 1 1 1 1 1 1 1 1 0 0 1 0
Table 2.4 shows the units that have been chosen by the PSO such that ∑ 𝑃610 𝑆,𝑛 + 𝑃𝑆,3 ≤ 300 with tariff = 147 being discovered to be the best-chosen competitors. From the comparison, the PSO gave better optimization for selecting the customer to be disengaged than did the Greedy Algorithm, with which the greatest associated power was 286 kW with a total cost of 175. In another case shown in Table 2.5 for PATC = 160 kW:
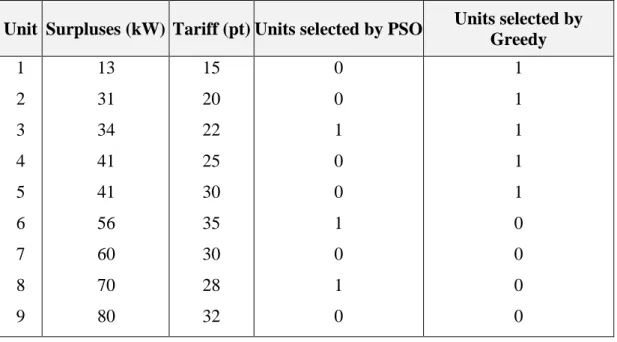
Table 2.5. Units selected by PSO compared with the Greedy Algorithm at PATC = 160 kW.
Unit Surpluses (kW) Tariff (pt) Units selected by PSO Units selected by Greedy 1 2 3 4 5 6 7 8 9 13 31 34 41 41 56 60 70 80 15 20 22 25 30 35 30 28 32 0 0 1 0 0 1 0 1 0 1 1 1 1 1 0 0 0 0
Table 2.5 shows that the units connected using PSO are 3, 6, and 9 with power = 160 kW = PATC and tariff 85 pt., even though the resulting power of the using Greedy Algorithm was 160 kW; however, the corresponding cost was 112 pt.
2.10. WHALE OPTIMIZATION ALGORITHM
Optimization is the solving of practical problems in any given area by achieving the best result with minimum effort. It is an essential tool to be used in many circumstances and issues in our daily life. The problem to be solved may be a problem of minimization or maximization, depending on the task. One of the new meta-heuristic algorithms is the Whale Optimization Algorithm (WOA) introduced by Lewis and Mirjalili. The WOA has several advantages over other swarm algorithms, such as lower design parameters and improved convergence velocities [68]. The WOA is inspired by the social activity of humpback whales and has three methodological steps. The theoretical model of surrounding prey, method of spiral bubble-net feeding, and prey search are as explained below.
2.10.1. Encircling Prey
Humpback whales may identify and encircle the location of prey. Since the location of the optimum design in the search space is not a priori known, the WOA algorithm assumes the target prey to be the current best candidate solution or close to being optimum. After the best search agent is defined, the other search agents will hence attempt to update their positions towards the best search agent. The following equations represent this behavior:
𝐷 = |𝐶. 𝑌𝑃(𝑡) − 𝑌(𝑡)| (2.16)
𝑌(𝑡 + 1) = 𝑌𝑃(𝑡) − 𝐴. 𝐷 (2.17)
where Y(t) is the position vector of the whale, t the current iteration, Yp(t) the vector
for the prey position, D the factor of convergence, and A and C the coefficient vectors determined thus:
𝐴 = 2𝑎𝑟 − 𝑎 (2.18)
𝐶 = 2. 𝑟 (2.19)
With regular iterations, the vector a is decreased linearly from 2 to 0 and r is a random vector within the range of 0 and 1.
2.10.2. Bubble Attacking of the Prey
To strike the prey, two approaches are used to describe the whales’ bubble behavior. These are represented as follows mathematically:
A- Shrinking encircling mechanism: In this tactic, the whales float around the prey in diminishing circles. This can be done by reducing the iterations of a from 2 to 0 and [A] < 1.
![Figure 1.2. Smart grid [5].](https://thumb-eu.123doks.com/thumbv2/9libnet/5405762.102170/20.892.170.789.706.1010/figure-smart-grid.webp)
![Figure 1.5. A grid-connected solar system with batteries [12].](https://thumb-eu.123doks.com/thumbv2/9libnet/5405762.102170/23.892.173.790.438.936/figure-grid-connected-solar-batteries.webp)
![Figure 2.6. Unique bubble-net feeding methods of humpback whales and the mathematical model [68]](https://thumb-eu.123doks.com/thumbv2/9libnet/5405762.102170/53.892.169.793.719.1080/figure-unique-bubble-feeding-methods-humpback-whales-mathematical.webp)