ScienceDirect
Materials Today: Proceedings 18 (2019) 1903–1909 www.materialstoday.com/proceedings
2214-7853 © 2019 Elsevier Ltd. All rights reserved.
Selection and/or Peer-review under responsibility of INTERNATIONAL CONGRESS ON SEMICONDUCTOR MATERIALS AND DEVICES.
ICSMD-2017
Experimental Investigation of 11x11 cm
2Membrane Microbial Fuel
Cell Performance
Mustafa Akram Hayder Hayder
a,*, Kevser Dincer
aaMechanical Engineering Department, Faculty of Engineering, Selcuk University, Konya 42030, Turkey
Abstract
Microbial fuel cells (MFC’s) are systems that can convert chemical energy into electricity directly from biochemically commutable substances (organic substances) by using microorganisms as a catalyst in an oxygen-free environment. Electrode-growing microorganisms in the anode chamber converts water organics into hydrogen ions and electrons. In this study, performance of 11x11 cm2 membrane microbial fuel cell have been experimentally investigated. In the experimental studies,
activated sludge sample have been used. In this study, current density (= I/V), power density (= P / V) values have been calculated by measuring current (I) and voltage (V) values. The performance of 11x11 cm2 Nafion 117 membrane activated
sludge microbial fuel cell (#ASMFC) have been determined. The maximum values of voltage, current density and power density values from the (#ASMFC) are represented subsequently (0.616 V, 0.463 A/m3 and 75.64 W/m3).
© 2019 Elsevier Ltd. All rights reserved.
Selection and/or Peer-review under responsibility of INTERNATIONAL CONGRESS ON SEMICONDUCTOR MATERIALS AND DEVICES. Keywords: Fuel Cell; microbial fuel cell; membrane; performance; power density
1. Introduction
The MFC system includes anode and cathode compartments separated by a proton selective membrane. This system is semi-biological because the anode compartment contains electrochemically active microorganisms, while the cathode is abiotic.
* Corresponding author. Tel.:+90 539-300-0243; fax:+90 332-241-06-35.
Nomenclature
#ASMFC activated sludge Microbial Fuel Cell HVFR high volumetric flow rate
I current density A/m3
LVFR low volumetric flow rate MFC Microbial Fuel Cell
P power density W/m3
V cell voltage V and volume m3
Substrates of microorganisms found in the anode compartment of MFC oxidize and during this time produce electrons and protons. Carbon dioxide is produced as an oxidation product. However, there is no clear carbon emission. Because carbon dioxide actually comes from the atmosphere in the process of photosynthesis in renewable biomass. The microorganisms in the anode partition liberate electrons and protons by different oxidation paths of organic substrates [1]. A typical MFC consists of an anode, a cathode, a proton-permeable membrane, and an electrical circuit [2]. Bacteria convert organic substances (glucose, acetate, wastewater, etc.) into carbon dioxide, electrons and protons by forming a biofilm layer on the anode in an oxygen-free environment.
Proton conducting materials in a MFC should ideally prevent transfer of other materials such as fuel (substrate) or electron acceptor (oxygen) while the catatonic protons are conducting at high efficiency. Due to its high ionic conductivity (10-2 S.cm-1), Nafion is the most widely used membrane among others [3]. (Liu, et al.) were reported
that in a single-cell microbial fuel cell, the oxygen diffusion increased when the membrane was removed and the coulombic efficiency decreased from 9 to 12% from 44-55%. However, the power density in the membrane fuel cell has increased with decreasing internal resistance [4]. (Kılıç, et al.) were used synthetic wastewater prepared in Chemical Oxygen Needy (COI) values in different environments in the laboratory environment. In laboratory scale and two-compartment cubic-MFC reactors, together with organic matter removal, they carried out a study to produce electric energy. They have been conducting electricity production from synthetic wastes using a lab-scale MFC reactor with glucose, an easily degradable organic matter. Scientific findings from the study have shown that pH is an important parameter and that the H+ ions, which are released as a result of glucose reduction in the anode
region, cause the pH to rise. As a result, they have also proven that the increase in COD concentration also increases electricity production and that industrial wastewater with high pollution can produce electricity while being treated with MFC [5]. (Logan, et al.) have been investigated that cysteine may serve as a substrate for electricity production by bacteria in a MFC. They have inoculated the two-compartment MFC containing a proton exchange membrane with an anaerobic sea sediment. Over a period of several weeks, electricity production was found using a 700 or 1000 Ω resistor and 385 mg/L Cysteine, which rises to a maximum power density of up to 19 mW/m2 [6]. (Min, et
al.) have been investigated the power output in MFC with a salt bridge instead of a membrane system. MFC salt bridges (G, metalized with the vaccine) found the power output 2.2 mW/m2. In both systems, it was observed that
oxygen diffusion from the cathode chamber to the anode chamber was a factor in power generation. They found that it is necessary to control the flow of dissolved oxygen into the anode chamber to increase power density in MFC’s, reduce internal resistance of the system and increase overall Coulombic efficiency [3]. (Kim, et al.) have been studied two different forms of microbial fuel cells for electricity generation from ethanol and methanol: two-chambered, aqueous-cathode MFC and single-chamber direct-air cathode MFC. Electricity produced a Coulombic efficiency (CE) ranging from 42% to 61% at typical maximum power density (40 ± 2 mW/m2) of the system and
ethanol using the two-chamber system. When the bacteria were transferred to known single-chamber MFC producing higher power densities with different substrates, the maximum power density increased to 488 ± 12 mW/m2 (CE = 10%) with ethanol. These results demonstrate that ethane can be used for continuous electricity
generation at room temperature using the bacteria in the bottom of a MFC [7]. (Aktan, et al.) in their study have been used two-reservoir MFC and pure culture Shewan Ella putrefactions, open circuit potential values were recorded using different organic materials. 10 mM glucose and 1250 mL pure culture, when the 5000 Ω external resistor was installed, the current was measured as 4 μA. According to Ohm's law, the power density per surface of the anode used is P = 0.8 mW / m2 [8]. (Yang, et al.) were demonstrated the conceptual microfluidic power source
by integrating laminar flow MFC’s in a series of integrable and scalable formats for LOC applications. Laminar flow-based power was produced by Pseudomonas aeruginosa PAO1 without physical membranes between the anodes and cathodes. Four Laminar Flow Microbial Fuel Cells (LAMFC) are connected in series to provide significant operating voltage and power. The LAMFC array produced a maximum power output of 60.5 W/cm2
under 100 kΩ, four times higher than that of each MFC unit. This study can provide increased power and voltage output with easy scalability and can improve the barriers to LOC devices by turning laminate flow-based biofuel cell technology into a practical application and leaving it to current research settings [9]. (Zhao, et al.) have been showed for the first time how diabetic microbial fuel cell performance, fed with glycerol, was affected by linkage changes during cluster processing. While the maximum voltage output in a serial connection reached 1.15 V, the maximum current density was 5.73 mA in parallel. Both connections increase the maximum power density with the initial concentration of glycerol. However, the glycerol degradation was even faster in the parallel connection. When the system is shifted to the parallel connection, the reactor has reached a steady power output without any delay. Reducing the response of system performance to different mass-linking modes helps in the practical application of MFC in the future and also provides a new way to obtain profitable values (electricity) from glycerol [10]. (Zhang, et al.) were used carbon cloths (0%, 30%, 50% and 70%) resistant to different wetness in diffusive MFC’s in different amounts in their work. The best performance was obtained with a 50% moisture-proof cathode and 1 diffusion layers (DL) (1427 ± 28 mW/m2), but the water in the cathode was leaked. They produced a maximum
power density (988 mW / m2) less than 31% of that produced by a commonly used cathode (30% moisture-proof
cathode, 4 DL), 50% moisture-proof cathode (1 DL). The different materials and the number of DL’s showed that cathode performance is directly related to the conditions that increase oxygen transfer [11]. (Qin, et al.) have been investigated the production of current generation from 2-chamber MFC’s fed with synthetic wastewater containing acetate for 192 days. In both MFC they used carbon paper anode electrode, whereas carbon cloth (MFC-1) and carbon paper (MFC-2) coated with 1 mg / cm2 platinum were used in the cathode. Voltammetry and impedance
analyzes were performed to monitor the factors limiting the performance of MFC’s. They found maximum power densities of 58.6 mW / m2 and 439 mW / m2 for MFC-1 and MFC-2, respectively, during the 135th day voltameter
tests. They conducted, when ferrocyanide is used as an electron acceptor in place of oxygen and platinum as a catalyst, it emphasizes that the electric current and power generation of MFC’s have increased significantly [12]. (Manickam, et al.) have been used activated carbon nanofibers (ACNFN) as a new anode material in MFC’s. ACNFN’s were obtained by electrospin method using PAN. They then manufactured it with steam activation. Have found that the open circuit voltage (OCV) of ACNFN (0.46 V) is higher than that of carbon cloth (CC) and Granular activated carbon (GAC) (0.4 and 0.41 V, respectively). The maximum current density obtained is 2714.646 A/m3,
which is the highest maximum value ever obtained in the literature (2500 A/m3, about 10% higher using a CNT
sponge composite anode) [13]. The aim of this study was to compare the performance of #ASMFC's fitted withA 11x11 cm2 Nafion-117 membrane and compare their performance (Cell voltage, Current density and power density
)with different temperatures as well as different resistances. 2. Materials and Method
2.1. Microbial Fuel Cell
A two-compartment microbial fuel cell (MFC) test of ASMFC was tested in a two-chamber microbial fuel cell with an air cathode as described in other studies. In this study, the copper braid anode section was placed with a 3-liter wastewater compartment and the copper rod of the cathode section was placed in the 3-3-liter domestic water cathode section. The current and voltage values were investigated in the cathodic area in contact with the solution in the MFC, while the air was influenced by the motor and the two air streams were blowing. The volume of anode-cathode sections is kept constant at 15x15x15 cm3. Activated sludge samples containing different anaerobic bacteria
were supplied by Konya Metropolitan Municipality Wastewater Treatment Plant and used in anode section.
Proton passing to the cathode side combines with oxygen to form water. Electric current generation can be done by separating the microorganisms from the anaerobic environment or from another terminal receiver, and this occurs under anaerobic ambient conditions [14]. A schematic picture of how an MFC operates is presented in Fig. 1.
Fig. 1. typical MFC working principle [1].
2.2. Experimental process
Experiments were carried out using activated sludge. The parameters used in the experiments were measured by determining temperature differences, resistance, flow effect, then cell voltage and current values have been recorded. The schematic view of the experimental system is presented in Fig. 2(a and b).
Voltage and current over an external resistance (R) of 10000 Ω were recorded using three multimeters at ΔT = 8, 10, 12, 14 oC in 6-hour continuous experiments and at four different temperatures. MFC has been operated at four
different temperatures in the environment provided by a heating mixer at ΔT = 8, 10, 12, 14 oC (sludge and ambient
temperature). The glass containers were manufactured in order to be composed of two chambers of 15x15x15 cm3
(Fig. 2a). 11x11 cm2 dimensions, membranes were placed between glass containers. #ASMFC uses current, power
density and voltage to compare low and high volumetric flow rates performance.
Fig. 2. (a) Schematic MFC system design (b) MFC experimental system setup.
(Fig. 2.a and b), the system is marked from 1 to 10, (Temperature sensor (thermal couple) (1), #ASMFC's glass containers (2), Copper braid (anode) and copper rod (3), The magnetic stirrer heater (4), The table (5), The flow meter (6), Multimeters (7), 11x11 cm2 Nafion membrane (8), External resistance (R
ex) (9), Air motors (10)).
The values of the temperature are ΔT = (8, 10, 12, 14 ° C). T= Tsludge-Tambient have been determined at two
volumetric flow rate effects for each ΔT value (flow rate at the highest level of the air motor 1 lt/min (=1,66 x 10 m s⁄ ) and 1.5 lt/min (=2,5 x 10 m s⁄ ). The experiment has been done under 21 different resistances R = (2, 50, 100, 200, 300, 400, 500, 600, 700, 800, 900, 1000, 2000, 3000, 4000, 5000, 6000, 7000, 8000, 9000, 10000 Ω) then for each flow rate voltage and current values were recorded. The data for the resistances were recorded by given momentarily. So, 21 experiments were done. The experiment was carried out as follows.
1) First, glass containers (fuel cells) were made ready by adding activated sludge and domestic water to the anode section and the cathode section, respectively. The copper braid anode section and the copper rod were placed in the cathode section.
2) Fishes thrown in the anode section were used to prevent active mud accumulation on the bottom of a MFC. 3) To ensure the temperature difference, the magnetic stirrer heater is located under the MFC to mix the
activated sludge.
4) The temperature sensors were used to measure both the ambient temperature and the system temperature. 5) A magnetic stirrer heater was used to bring the temperature up to a certain level and to mix the mud.
6) In order to measure the desired resistance value, the resistor was connected in series to the MFC circuit which was connected to the voltage section of the resistor box and to the voltage section of the resistor, and the desired resistance value was set by the potentiometer.
7) After adjusting the resistance value, the current measurement should be placed at the mouth of the first-born screw in the positive current section and the (+) end of the second born screw. The same process is done in the voltage section for the voltage measuring avometer.
8) When the system was installed, the measured values of voltage and current at the resistance value were recorded.
3. Results and Discussion
MFC’s are systems that can convert chemical energy directly from biochemically changeable substances into electrical energy using microorganisms as catalysts in an oxygen-free environment. In this study, 11x11 cm2
membrane MFC at different temperatures (ΔT = 8, 10, 12, 14 oC). In this study, the effect of volumetric flow rates
on the performance of #ASMFC's module was investigated. In order to obtain the similar current generation, two conditions were created: 1 liter/min (= 1.66 x 10⁻⁵ m3/ S LVFR) and 1.5 liter/min (= 2.5 x 10⁻⁵ m3/s HVFR). The
performance of #ASMFC (cell voltage, current density and power density) under the two flow rate operation stages have been found from (equation 1).
( / ) = ( ) (1)
Energy harvested by the different resistances was affected by volumetric flow rates (LVFR and HVFR) and at LVFR different parameters were recorded and the highest values were compared to those of HVFR.
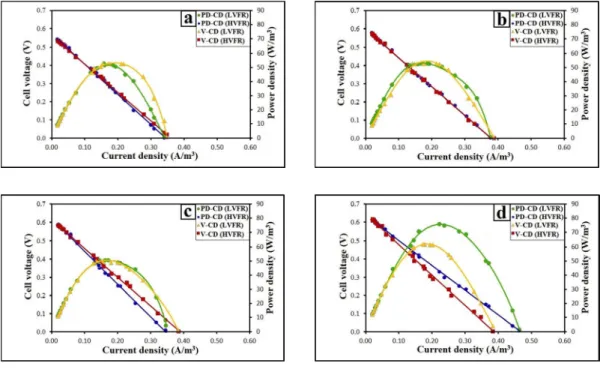
In this research, performance analyzes of MFC, variation of cell voltage with respect to current density, and variation of power density with respect to current density are presented in Fig.3 for ΔT = (8, 10, 12, 14 oC ) at low
and high flow rate effect of 11x11 cm2 Nafion 117 membrane by using active sludge as substrate. Fig.3 summarizes
the outcomes of the investigation of the performance parameters.
Analysis result of Fig. 3a; #ASMFC's work at ΔT = 8 oC temperature and 1 lt / min and 1.5 lt / min flow rates, the
performance of MFC’s variation of the power density with respect to the current density and the variation of the cell voltage with respect to the current density were investigated. Maximum power density = 52.64 W / m3, were
recorded at 1 lt / min, R = 700 Ω, and maximum cell voltage of MFC Vmax = 0.540 V at 1 lt / min, R = 10,000 Ω. The maximum value of current density = 0.460 A/m3, 1.5 lt / min flow rate and resistance 2 Ω have been
demonstrated.
Analysis result of Fig. 3.b; # ASMFC's work at ΔT = 10 oC temperature and 1 lt / min and 1.5 lt / min flow rates,
the performance of MFC’s variation of the power density with respect to the current density and the variation of the cell voltage with respect to the current density were investigated. Maximum power density = 52.92 W / m3, were
recorded at 1.5 lt / min, R = 400 Ω, and maximum cell voltage of MFC Vmax = 0.577 V at 1 lt / min, R = 10,000 Ω. The maximum value of current density = 0.387 A/m3, 1 lt / min flow rate and resistance 2 Ω have been
Fig. 3. The variation of MFC’s Cell voltage with respect to current density and the variation of power density with respect to current density at low and high flow rate a.(for ΔT = 8 oC), b.(for ΔT = 10 oC), c.(for ΔT = 12 oC), d.(for ΔT = 14 oC).
Analysis result of Figure 3.c; # ASMFC's work at ΔT = 12 oC temperature and 1 lt / min and 1.5 lt / min flow rates,
the performance of MFC’s variation of the power density with respect to the current density and the variation of the cell voltage with respect to the current density were investigated. Maximum power density = 50.41 W / m3, were recorded
at 1 lt / min, R = 600 Ω, and maximum cell voltage of MFC Vmax = 0.583 V at 1.5 lt / min, R = 10,000 Ω. The maximum value of current density = 0.383 A/m3, 1.5 lt / min flow rate and resistance 2 Ω have been demonstrated.
Analysis result of Figure 3.d; # ASMFC's work at ΔT = 14 oC temperature and 1 lt / min and 1.5 lt / min flow rates, the performance of MFC’s variation of the power density with respect to the current density and the variation of the cell voltage with respect to the current density were investigated. Maximum power density = 75.64 W / m3,
were recorded at 1 lt / min, R = 600 Ω, and maximum cell voltage of MFC Vmax = 0.616 V at 1.5 lt / min, R = 10,000 Ω. The maximum value of current density = 0.463 A/m3, 1 lt / min flow rate and resistance 2 Ω have been
demonstrated.
As can be seen from Table 1, current density decreased at four records from 0.463 A/m3 to 0.020 A/m3 when the
external resistance increased from 2 to 10000 Ω. The energy production of the #ASMFC's module were 50-75.64 W/m3.
Table 1. #ASMFC's performance records at different (temperature, resistance and flow rate) parameters.
11x11 cm2 LVFR 11x11 cm2 HVFR Temperature difference ΔT cell voltage V current density A/m3 power density W/m3 cell voltage V current density A/m3 power density W/m3 ΔT= 8 oC 0.540 0.341 52.64 0.534 0.346 52.6 ΔT= 10 oC 0.577 0.376 52.82 0.573 0.387 52.92 ΔT= 12 oC 0.582 0.346 50.41 0.583 0.383 50 ΔT= 14 oC 0.612 0.463 75.64 0.616 0.383 61.88
4. Conclusion
In this study, 11x11 cm2 membrane MFC, 1 lt/min and 1.5 lt/min volumetric flow rates at different temperatures
gradiants (ΔT = 8, 10, 12, 14 oC), have been reviewed and the best performance are given below:
The maximum power density of #ASMFC is P_max= 75.64 W/m3, Δ T= 14 oC, 1 liter/min (LVFR) output,
resistance at 600 Ω.
The maximum voltage of #ASMFC is V_max= 0.616 V, ΔT= 14 oC, 1.5 l/min output, resistance at 10000
Ω.
The maximum current density of #ASMFC I_(max.)= 0.463 A/m3, ΔT = 14 oC, 1 l / min output, resistance
2 Ω.
Unexpectedly, the (LVFR) was close or higher than the (HVFR) in current producing ability and power density suggesting that the comprehensive analyses are useful for a practical evaluation of MFC for different membrane surfaces.
Acknowledgements
This experimental study was supported by Selcuk University Scientific Research Projects (BAP) project BAP_17201094. Experimental system is available at S.U. Advanced Technology Laboratory (ILTEK) in laboratory B-Block 103.
References
[1] K. Rabaey, W. Verstraete, Microbial fuel cells: novel biotechnology for energy generation, Trends in Biotechnology. 23 (2005) 291–298. doi:10.1016/j.tibtech.2005.04.008.
[2] BE. Logan, B. Hamelers, R. Rozendal, U. Schröder, J. Keller, S. Freguia, et al. Microbial fuel cells: methodology and technology. Environmental science & technology. (2006);40(17):5181-92.
[3] B. Min, S. Cheng, B.E. Logan, Electricity generation using membrane and salt bridge microbial fuel cells, Water Research. 39 (2005) 1675– 1686. doi:10.1016/j.watres.2005.02.002.
[4] B. Liu, I. Williams, Y. Li, L. Wang, A. Bagtzoglou, J. Mccutcheon, et al., Towards high power output of scaled-up benthic microbial fuel cells (BMFCs) using multiple electron collectors, Biosensors and Bioelectronics. 79 (2016) 435–441. doi:10.1016/j.bios.2015.12.077. [5] A. Kılıç, Y. Uysal, Ö. Çınar. Laboratuvar Ölçekli Bir Mikrobiyal Yakıt Hücresinde Sentetik Atıksudan Elektrik Üretimi. Pamukkale
Üniversitesi Mühendislik Bilimleri Dergisi. (2011);17(1):43-9.
[6] B.E. Logan, C. Murano, K. Scott, N.D. Gray, I.M. Head, Electricity generation from cysteine in a microbial fuel cell, Water Research. 39 (2005) 942–952. doi:10.1016/j.watres.2004.11.019.
[7] J. Kim, S. Jung, J. Regan, B. Logan, Electricity generation and microbial community analysis of alcohol powered microbial fuel cells, Bioresource Technology. 98 (2007) 2568–2577. doi:10.1016/j.biortech.2006.09.036.
[8] S. Aktan, EU. Çokgör, F. Gücın. Mikrobiyel yakıt hücresinde Shewanella putrefaciens. ITU Journal Series E: Water Pollution Control. (2011);21(2).
[9] W. Yang, K.K. Lee, S. Choi, A laminar-flow based microbial fuel cell array, Sensors and Actuators B: Chemical. 243 (2017) 292–297. doi:10.1016/j.snb.2016.11.155.
[10] N. Zhao, I. Angelidaki, Y. Zhang, Electricity generation and microbial community in response to short-term changes in stack connection of self-stacked submersible microbial fuel cell powered by glycerol, Water Research. 109 (2017) 367–374. doi:10.1016/j.watres.2016.11.064. [11] X. Zhang, H. Sun, P. Liang, X. Huang, X. Chen, B.E. Logan, Air-cathode structure optimization in separator-coupled microbial fuel cells,
Biosensors and Bioelectronics. 30 (2011) 267–271. doi:10.1016/j.bios.2011.09.023.
[12] M. Qin, E.A. Hynes, I.M. Abu-Reesh, Z. He, Ammonium removal from synthetic wastewater promoted by current generation and water flux in an osmotic microbial fuel cell, Journal of Cleaner Production. 149 (2017) 856–862. doi:10.1016/j.jclepro.2017.02.169.
[13] S.S. Manickam, U. Karra, L. Huang, N.-N. Bui, B. Li, J.R. Mccutcheon, Activated carbon nanofiber anodes for microbial fuel cells, Carbon. 53 (2013) 19–28. doi:10.1016/j.carbon.2012.10.009.
[14] F. Zhao, N. Rahunen, J.R. Varcoe, A.J. Roberts, C. Avignone-Rossa, A.E. Thumser, et al., Factors affecting the performance of microbial fuel cells for sulfur pollutants removal, Biosensors and Bioelectronics. 24 (2009) 1931–1936. doi:10.1016/j.bios.2008.09.030.
![Fig. 1. typical MFC working principle [1].](https://thumb-eu.123doks.com/thumbv2/9libnet/5387382.101391/4.816.304.523.121.315/fig-typical-mfc-working-principle.webp)