353
http://journals.tubitak.gov.tr/veterinary/ © TÜBİTAK
doi:10.3906/vet-1903-19
Determination of the causal relationship between beef prices and the consumer price
index in Turkey*
Ahmet Cumhur AKIN1,**, Mustafa Bahadır ÇEVRİMLİ2, Mehmet Saltuk ARIKAN3, Mustafa Agah TEKİNDAL4
1Department of Animal Health Economics and Management, Faculty of Veterinary Medicine,
Mehmet Akif Ersoy University, Burdur, Turkey
2Department of Livestock Economics and Management, Faculty of Veterinary Medicine, Selçuk University, Konya, Turkey 3Department of Animal Health Economics and Management, Faculty of Veterinary Medicine, Fırat University, Elazığ, Turkey
4Department of Biostatistic, Faculty of Veterinary Medicine, Selçuk University, Konya, Turkey
1. Introduction
Sufficient consumption of main foods in a healthy and timely manner is of great importance for the physical and mental development of human beings. Developed countries are able to sell food products to their consumers at affordable prices, complying with the quality and hygiene standards, thanks to their well-established food markets.
Any increase in food prices adversely affects the regular consumption of foods by low-income consumers [1,2], leading to changes in the dietary preferences of the society [3,4]. It is reported that exogenous food price shocks in developing countries significantly contribute to the inflation process, and that food products constitute a larger portion of the products in the Consumer Price Index (CPI) in such countries [5]. Food prices pose a serious risk for inflation, which is also stated in the inflation report prepared by the Central Bank of the Republic of Turkey
[6]. Additionally, numerous studies conducted in Turkey emphasize that food prices lead to considerably increased inflation [2,6,7]. Although food prices that create inflationary pressures seem to be in favor of producers in the short term, they affect the whole society in the medium and long term [2].
Food products are considered to be a major source of the recent inflation spikes. Among the food products, beef meat is held responsible for the inflation due to its high price [8]. The increasing demand for beef meat and the global pressures on climate change have pushed up wholesale and retail prices of meat products across the world [9]. In Turkey input costs have increased steadily [10] and import policies applied to meet the demand for beef meat failed to prevent price increases, but caused the price increases to accelerate due to the decrease in production in the long term [11]. It is highlighted that the price spikes are a dominant factor that affects the consumer price index and
Abstract: The rising prices of beef meat have recently restricted its accessibility for consumers who need to consume it for a balanced and healthy diet. Speculations have been made about the increase in beef meat prices being one of the major factors underlying the increase in the consumer price index (CPI). In this scope, the causal relationship between the monthly average prices of beef and the rate of year-on-year change in the CPI for the period between January 2005 and February 2018 was analyzed in the study. Since time series data were used, the augmented Dickey–Fuller and Phillips–Perron tests were conducted to find out whether the series were stationary. Nonstationary series were made stationary by taking their difference. After conducting unit root test on the series, a vector auto regression model was developed, and the causality between the variables was tested by the Granger Causality Analysis. The results of the Granger Causality Analysis indicate that the monthly average price of beef and the rate of year-on-year change in the CPI are causally related at a level of 5% and 10%. In conclusion, the monthly data of the CPI and the beef prices between January 2005 and February 2018 are causally related at a significance level of 1%.
Key words: Beef prices, causality, consumer price index, granger analysis, vector auto regression analysis
Received: 09.03.2019 Accepted/Published Online: 14.05.2019 Final Version: 11.06.2019
Research Article
* This manuscript was presented as oral presentation in the 1st International Health Science and Life Congress (IHSLC 2018), 02-05 May 2018, Burdur.
makes it harder to predict [2]. On the other hand, the lack of policy measures to overcome the effects of the economic crises over the years has caused beef meat production to decrease [12]. While retail beef prices rose by 130% between 2005 and 2013, retail mutton prices increased by 154% and the forage prices by 115%. The increases in the prices of beef meat were higher than the increases in the CPI, which was 118% in the same period [13].
Considering that the phenomenon of inflation is a common problem of current economies, it is of great importance to determine the direction and extent of the relationship between inflation and relative price volatility [14]. Defining the relationship between beef meat prices and inflation will allow better assessment of the increases in inflation. According to the theory of causality, in explaining the causal relationship between two variables, we check whether the lagged values of one of the variables contribute to the explanation of the current value of the other variable [15]. In this context, the Granger causality analysis is a method of analysis that is widely used in studies on stockbreeding [16,17].
The purpose of this study is to test the causal relationship between the monthly average prices of beef and the rate of year-on-year change in the CPI for the period between January 2005 and February 2018 using the Granger causality analysis, thereby presenting the causation between the consumer prices of beef and the CPI.
2. Materials and methods 2.1. Dataset
In order to test the causality between the prices of beef and the CPI, the monthly average prices of beef and the rate of year-on-year change in the CPI for the period between January 2005 and February 2018 were used as the dataset for the study [18]. The datasets of the average prices of beef used in the analyses were obtained from the weekly bulletin of the Meat and Milk Board (MMB) [19].
2.2. Analysis method
The causal relationship between the monthly average retail price of beef and the rate of year-on-year change in the CPI for the period between January 2005 and February 2018 was analyzed in the study. Since time series data were used, the augmented Dickey–Fuller (ADF) and Phillips– Perron (PP) tests were conducted to find out whether the series were stationary. Nonstationary series were made stationary by taking their difference. After conducting unit root test on the series, a vector auto regression model was developed, and the causality between the variables was tested by the Granger causality analysis. All tests were conducted on using the econometric analysis software program Eviews 6 [20].
In stationary series, the data fluctuate around a constant mean. Hence, in order to tell whether a series is stationary, it is necessary to display the graph of the series that shows its change over time [21].
Before starting the Granger causality analysis, the lag values of the variables should be determined, and the structure of the dataset should be examined to determine its lag value. If the variables have annual data, the lag value is equal to 1. If the data are semiannual, quarterly, or monthly, the lag value to be used is 2, 4, or 12, respectively. The Granger causality analysis is used to test the presence and direction of a causal relationship between two variables [21].
In the present study, the models used in the causality analysis are as follows:
𝑏𝑏! ! !!! ≠ 0 𝛽𝛽! ! !!! = 0 𝐵𝐵𝐵𝐵𝐵𝐵𝐵𝐵. . .!= 𝑌𝑌!= 𝑦𝑦!𝐵𝐵𝐵𝐵𝐵𝐵𝐵𝐵. . .!!!+ ! !!! 𝜃𝜃!𝐶𝐶𝐶𝐶𝐶𝐶!!!+ ! !!! 𝜗𝜗! 𝐶𝐶𝐶𝐶𝐶𝐶! = 𝜑𝜑!= 𝜑𝜑!𝐶𝐶𝐶𝐶𝐶𝐶!!!+ ! !!! 𝜃𝜃!𝐵𝐵𝐵𝐵𝐵𝐵𝐵𝐵. . .!!!+ ! !!! 𝜀𝜀!
(1) 𝑏𝑏! ! !!! ≠ 0 𝛽𝛽! ! !!! = 0 𝐵𝐵𝐵𝐵𝐵𝐵𝐵𝐵. . .!= 𝑌𝑌!= 𝑦𝑦!𝐵𝐵𝐵𝐵𝐵𝐵𝐵𝐵. . .!!!+ ! !!! 𝜃𝜃!𝐶𝐶𝐶𝐶𝐶𝐶!!!+ ! !!! 𝜗𝜗! 𝐶𝐶𝐶𝐶𝐶𝐶!= 𝜑𝜑!= 𝜑𝜑!𝐶𝐶𝐶𝐶𝐶𝐶!!!+ ! !!! 𝜃𝜃!𝐵𝐵𝐵𝐵𝐵𝐵𝐵𝐵. . .!!!+ ! !!! 𝜀𝜀!
(2) The null hypothesis is
𝑏𝑏! ! !!! ≠ 0 𝛽𝛽! ! !!! = 0 𝐵𝐵𝐵𝐵𝐵𝐵𝐵𝐵. . .!= 𝑌𝑌!= 𝑦𝑦!𝐵𝐵𝐵𝐵𝐵𝐵𝐵𝐵. . .!!!+ ! !!! 𝜃𝜃!𝐶𝐶𝐶𝐶𝐶𝐶!!!+ ! !!! 𝜗𝜗! 𝐶𝐶𝐶𝐶𝐶𝐶!= 𝜑𝜑!= 𝜑𝜑!𝐶𝐶𝐶𝐶𝐶𝐶!!!+ ! !!! 𝜃𝜃!𝐵𝐵𝐵𝐵𝐵𝐵𝐵𝐵. . .!!!+ ! !!! 𝜀𝜀!
, meaning that CPIt-i
CPIt-m lagged variables are not involved in the relationship, and that there is no causal relationship in the direction from the CPI between January 2005 and February 2018 to the beef prices between January 2005 and February 2018. The alternative hypothesis is 𝑏𝑏!
! !!! ≠ 0 𝛽𝛽! ! !!! = 0 𝐵𝐵𝐵𝐵𝐵𝐵𝐵𝐵. . .!= 𝑌𝑌!= 𝑦𝑦!𝐵𝐵𝐵𝐵𝐵𝐵𝐵𝐵. . .!!!+ ! !!! 𝜃𝜃!𝐶𝐶𝐶𝐶𝐶𝐶!!!+ ! !!! 𝜗𝜗! 𝐶𝐶𝐶𝐶𝐶𝐶!= 𝜑𝜑!= 𝜑𝜑!𝐶𝐶𝐶𝐶𝐶𝐶!!!+ ! !!! 𝜃𝜃!𝐵𝐵𝐵𝐵𝐵𝐵𝐵𝐵. . .!!!+ ! !!! 𝜀𝜀!
, meaning that a
causality in the direction from the CPI to the beef prices between January 2005 and February 2018 exists [22].
3. Results
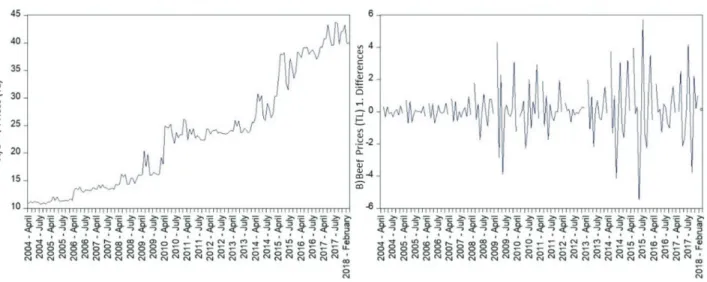
Figure 1A illustrates the change in the beef prices between January 2005 and February 2018. It is clear that the variables do not follow a stationary course during the periods under consideration. By applying the ADF test (Figure 1B), the time series of the beef prices between January 2005 and February 2018 was made stationary.
The first difference of the data was taken to make the time series of the beef prices between January 2005 and February 2018 in Figure 1B stationary. The series became stationary after its first difference was taken.
Figure 2A illustrates the change in the CPI between January 2005 and February 2018. It is clear that the series does not follow a stationary course during the periods under consideration. By applying the unit root test (Figure 2B), the time series of the CPI between January 2005 and February 2018 was made stationary.
The first difference of the data was taken to make the time series of the CPI between January 2005 and February 2018 in Figure 2B stationary. The series became stationary after taking its first difference.
Results of the ADF and PP unit root tests indicate that the time series data of the CPI between January 2005 and February 2018 became stationary after taking its first difference. Results of the unit root tests for the beef prices between January 2005 and February 2018 are given in Table 1.
ADF and PP test values of the time series data of the beef prices between January 2005 and February 2018 after taking its first difference are significant at a significance level of 1%, 5%, and 10%, respectively. The values in the parentheses are the optimal lag lengths.
Results of the ADF and PP unit root tests indicate that the time series data of the beef prices between January 2005 and February 2018 became stationary after taking its first difference. Results of the unit root tests for the CPI between January 2005 and February 2018 are given in Table 1.
ADF and PP test values of the time series data of the CPI between January 2005 and February 2018 after taking its first difference are significant at a significance level of 1%, 5%, and 10%, respectively. The values in the parentheses are the optimal lag lengths.
Results of the causality analysis conducted on the data whose stationarity was confirmed using the unit root test are given in Table 2.
Considering the presence and direction of the causal relationship between MMB’s beef prices between January 2005 and February 2018 and the beef prices between January 2005 and February 2018 that are analyzed according to the Turkish Statistical Institute’s CPI data and the CPI values between January 2005 and February 2018, we can reach the following conclusion.
The results of the Granger causality analysis indicate that the monthly average price of beef and the rate of
year-Figure 1. Checking the stationarity of the beef prices (A) between January 2005 and February 2018 (monthly closing prices) using the ADF test (B).
on-year change in the CPI are causally related at a level of 5% and 10%. The CPI and the beef prices are causally related at a significance level of 1%.
4. Discussion
A study maintaining that food inflation is affected by both supply- and demand-side factors reports that there is a positive long-term relationship between food inflation and the variables such as inflation expectation, GDP per capita, support prices, food import and food export [23]. Another study reports that the agricultural inflation is significantly reflected in the food inflation and aggregate CPI inflation, confirming the presence of the positive relationship [24]. It is underlined that the major factor that has recently restricted the rate of decrease in inflation in Turkey is the high food prices, and that a significant upward trend is observed in the food prices due to both negative supply shocks and the effects of the exchange rate [7]. It is noted that the effect of inflation on the prices of agricultural products is positive in developed countries and negative in developing countries as in Turkey [25]. Another study conducted in Turkey reports that there is a long-term relationship between agricultural and food uncertainty and inflation, and that the uncertainties in agricultural product and food prices have a positive effect on inflation [6]. In a study analyzing the effect of inflation rate on the prices of agricultural products, this effect was analyzed for developing countries using the data for the period 1980– 2007 and the panel smooth transition regression method, and the results indicated that the effect of inflation on the prices of agricultural products was positive during periods of low inflation and negative during periods of high inflation [25]. In Turkey, the contribution of food inflation to overall inflation is high and has been around 3–4 points since 2013. It is reported that 3.11 points, that is, 40% of the overall inflation, which was 8.17% in 2014, arose out
of food inflation [26]. Another study highlights that a 1% increase in food consumer price index results in a 0.79% increase in inflation [2].
Generally speaking, the above-mentioned studies focusing on the relationship between food prices and inflation underline the effect of food prices on inflation. However, they address the effect of food prices on inflation rather than their mutual interaction as we do in our study. One of the major aspects of this study is that it identifies the level of effect that both factors have on each other and determines the direction of the effects. As a result of the statistical analysis, a causal relationship was found between 5% and 10% of the beef price to the CPI and 1% of the CPI to beef price.
A study conducted in Turkey found that both the producer prices of beef and feed prices had increased by 17 times. It reported that based on the inflation-adjusted current prices both feed and beef prices had decreased by 20% and 21% in the period between 1998 and 2017, respectively [27]. As is evident from this study, the fact that prices actually decreased when they were adjusted for inflation although the current prices were high supports the view that the most dominant factor underlying the increase in the beef price is inflation.
The production of main products, and particularly foods of animal origin, by intensive production methods rather than through use of natural resources leads to increases in production costs in Turkey. The recent upward trend in the costs stem from the high dependency of production on import substitute products, the increases in the price of energy and fuels, and the high cost of feed, a major input in the stockbreeding sector, in the intensive production model.
However, the beef meat sector faces a great risk as the government has failed to take measures in favor of the producers, particularly aimed at reducing the costs in the
Table 2. Results of the Granger causality test.
Null hypothesis No. of observations F statistics Probability value Beef meat is not reason for the CPI 157 3.092227 0.024
CPI is not reason for the beef meat 157 4.946716 0.00392 Table 1. Unit root tests for the beef prices and CPI between January 2005 and February 2018.
Variable Level value First difference Level value First difference
ADF PP
Beef Prices −8.346559 (12) −3.471192 (12) −10.60378 (12) 7.712876 (12) CPI −0.280632 (12) −4.539879 (12) −3.511212 (12) −10.60378 (12)
production of beef meat, and the increase in imports does not allow production planning in the sector and a sustainable production by local producers. The decreasing total production of beef meat in Turkey for the last 3 years indicates the extent of this risk.
Recently, speculations have been made about the increase in beef meat prices being one of the major factors underlying the increase in the CPI in Turkey. The results of this study, conducted to validate this view and present the causality between the change in the CPI and the beef meat prices, suggest that the effect of the CPI on the beef meat prices is, contrary to popular belief, more significant.
The causal relationship between the beef meat prices and the CPI for the period under consideration was found to be significant at a significance level of 5% and 10%. In this context, one can say that the effect of beef prices on the CPI cannot be overlooked and that beef has an effect on inflation, albeit slightly.
However, the presence of a causal relationship between the CPI and beef prices at a level of 1% suggests that contrary to popular belief CPI has more effect on beef prices than beef prices have on the CPI. Hence, we can say that beef meat prices are affected by the CPI rather than affecting it. There are numerous studies focusing on the relationship between food prices and inflation, which usually highlight that food prices have an effect on inflation [6,23,24,28,29].
In conclusion, the steps to be taken by authorities that steer the sector’s future development to prevent the increasing prices of beef meat and foods of animal origin need to be supported by such kind of analyses. In order to make a sound assessment, the overall basket of goods should be addressed with specific focus on similar products, rather than assessing the individual commodities that have an effect on the CPI. Such an approach will prevent targeting of a single product, allowing more effective decisions to be taken and sustainable policies to be formulated.
References
1. Hernandez MA, Ibarra R, Trupkin DR. How far do shocks move across borders? Examining volatility transmission in major agricultural futures markets. European Review of Agricultural Economics 2013; 41 (2): 301-325. doi: 10.1093/ erae/jbt020
2. Eştürk Ö, Albayrak N. Investigation of the relationship between agricultural products-food price increases and inflation. ÜİİİD-IJEAS 2018; (18. EYİ Özel Sayı): 147-158 (article in Turkish with an English abstract). doi: 10.18092/ ulikidince.353991
3. Sarris A. Food commodity price volatility and food insecurity. Bio-based and Applied Economics 2013; 2 (3): 213-236. 4. Bazga B, Ipate I, Ipate N. Price volatility in context of food
security for sustainable development. Competitiveness of Agro-Food and Environmental Economy 2014; 198-204.
5. Mohanty MS, Klau M. What determines inflation in emerging
market countries? BIS Papers No 8, Modellin Aspects of Inflation Orocess and Monetary Transmission Mechanism in Emerging Market Countries 2001; 1-38.
6. Erdal G, Esengün K, Erdal H. Türkiye’de tarım ve gıda ürünleri fiyatlarındaki belirsizliğin enflasyon üzerindeki etkileri. KMU İİBF Dergisi 2008; 10 (15): 65-79 (in Turkish with an English abstract).
7. Bayramoğlu AT, Yurtkur AK. International factors on food and agricultural price determinations in turkey. Anadolu Üniversitesi Sosyal Bilimler Dergisi 2015; 15 (2): 63-74 (in Turkish with an English abstract). doi: 10.18037/ausbd.84248
8. Akın AC, Arıkan MS, Çevrimli MB. Effect of import decisions
in Turkey between 2010-2017 on the red meat sector. 1st International Health Science and Life Congress; Burdur, Turkey; 2018. pp 109-119 (in Turkish with an English abstract).
9. Revell BJ. One man’s meat… 2050? ruminations on future meat demand in the context of global warming. Journal of Agricultural Economics 2015; 66 (3): 573-614. doi: 10.1111/1477-9552.12121
10. Sarıözkan S. Livestock product prices and input costs in Turkey (1995-2004). Erciyes Üniversitesi Veteriner Fakültesi Dergisi 2006; 3 (2): 105-110 (in Turkish with an English abstract). 11. Cevger Y, Sakarya E. Meat prices and factors affecting them
in Turkey. Turkish Journal of Veterinary and Animal Sciences 2006; 30 (1): 1-6.
12. Aydın E, Aral Y, Can MF, Cevger Y, Sakarya E et al. Analysis of the red meat price changes over the last 25 years and effects of import decisions in Turkey. Vet Hekim Der Derg 2011; 82 (1): 3-13 (in Turkish with an English abstract).
13. Özertan G, Saghaian SH, Tekgüç H. Dynamics of price transmission and market power in the Turkish beef sector. İktisat İşletme ve Finans 2015; 30 (349): 53-76.
14. Yamak N, Kolcu F. Inflation-relative price variability relationship: the case of Turkey. International Journal of Sciences and Education Research 2015; 1 (3): 740-757 (in Turkish with an English abstract). doi: 10.24289/ijsser.279153 15. Engeloğlu Ö, Meral İG, Genç K. A literature review on the
causality test applications about Turkey. Social Sciences Research Journal 2015; 4 (2): 142-154 (in Turkish with an English abstract) .
16. Arslan S. The impacts of fuel prices on ovine and cattle prices. Uluslararası Yönetim İktisat ve İşletme Dergisi (ICMEB17) Özel Sayı 2017; 284-291 (in Turkish with an English abstract). doi: 10.17130/ijmeb.2017ICMEB1735452
17. Yalçınkaya HS. Research of suitability of the Ankara meat exchange with the efficient market hypothesis. Journal of Business Research-Türk 2017; 9 (4): 495-509 (in Turkish with an English abstract). doi: 10.20491/isarder.2017.343
18. TURKSTAT. Tüketici fiyat endeksi, Türkiye İstatistik Kurumu [online]. Website https://biruni.tuik.gov.tr/ medas/?kn=84&locale=tr [accessed 09 March 2019]. 19. MMB. Bulletin of weekly price. Meat and Milk Board [online].
Website https://www.esk.gov.tr/ [accessed 09 March 2019]. 20. EViews 6. EViews 6 user’s guide. Quantitative Micro Software,
CA, 2007.
21. Yılmazer M. Relationship with foreign direct investment, foreign trade and economic growth: a case study on turkey. Celal Bayar Üniversitesi SBE, Sosyal Bilimler Dergisi 2010; 8 (1): 241-260 (in Turkish with an English abstract).
22. Doğan B, Eroğlu Ö, Değer O. The causal relationship between inflation and interest rates: the case of Turkey. Çankırı Karatekin Üniversitesi İİBF Dergisi 2016; 6 (1): 405-425 (in Turkish with an English abstract). doi: 10.18074/cnuiibf.258 23. Abdullah M, Kalim R. Empirical analysis food price inflation
in Pakistan. World Applied Sciences Journal 2012; 16 (7): 933-939.
24. Çıplak U, Yücel ME. İthalatta koruma önlemleri ile tarım ve gıda fiyatları. Türkiye Cumhuriyet Merkez Bankası, Araştırma Genel Müdürlüğü Çalışma Tebliği 2004; No:04/01, Ankara, (in Turkish).
25. Güloğlu B, Nazlıoğlu Ş. Impacts of inflation on agricultural prices: panel smooth transition regression analysis. Siyaset, Ekonomi ve Yö netim Dergisi 2013; 1 (1): 1-22 (in Turkish with an English abstract).
26. Erol E. The determinants of food inflation in Turkey. PhD, Middle East Technical University, Ankara, Turkey, 2017. 27. Çiçek H, Doğan İ. Developments in live cattle and beef import
and the analysis of producer prices with trend models in Turkey. Kocatepe Vet J 2018; 11 (1): 1-10 (in Turkish with an English abstract). doi: 10.5578/kvj.66117
28. Başkaya YS, Gürgür T, Ögünç F. Global warming, globalization and food crisis – an empirical study on processed food prices in Turkey. Central Bank Review 2008; 8 (2): 1 (in Turkish with an English abstract).
29. Utkulu U, Ekinci R. Asymmetric and nonlinear pass-through of international oil and food prices to domestic prices: NARDL model evidence for Turkey. Finans Politik & Ekonomik Yorumlar 2016; 53 (617): 9 (in Turkish with an English abstract).