A Comparative Study on Prediction of the Indoor Soundscape
in Museums via Machine Learning
Yilmazer, Semiha1
Bilkent University
Department of Interior Architecture and Environmental Design, Bilkent University, Ankara Turkey
Yilmazer, Cengiz2
CSY R&D and Architecture Engineering Cyberplaza, Cyberpark, Bilkent
Ankara, Turkey Acun, Volkan3
Bilkent University
Department of Interior Architecture and Environmental Design, Bilkent University, Ankara Turkey
ABSTRACT
This paper presents the preliminary findings of a soundscape research, which uses machine learning to make a prediction about human perception for indoor auditory environments. Museums of Çengelhan Rahmi Koc and Erim Tan are selected as the case study settings for data collection. The survey questionnaire basically consisted of three parts which are concerned with identifying the socio-cultural status, the personal tendencies, and evaluation of the physical and auditory environment. Before constructing of grounding the predictive model, data went through analyses to normalize and to eliminate the irrelevant items. Preliminary findings demonstrated how an indoor auditory environment would be perceived based on the individuals’ socio-cultural status, tendencies, preference and expectation from the space and physical elements of the space with together constructing a preliminary grounding model to use Machine / Deep learning algorithm.
Keywords: Indoor Soundscape, Machine Learning, Artificial Intelligence (AI) I-INCE Classification of Subject Number: 70
_______________________________
1. INTRODUCTION
Artificial Intelligence (AI) is concerned with the development of systems which are able to perform tasks in a similar way as human intelligence would do (1). AI makes it possible for machines to perform human-like tasks, learn from experience and adjust to new inputs. In order to achieve this, it makes use of machine / deep learning algorithms respectively. As far as the early days of AI, it is among the goals to mimic human cognition to construct accurate and testable theories about the mechanism of the human mind.Machine learning refers to a broad range of algorithms. These algorithms can be studied under two major categories; Supervised Learning and Unsupervised Learning. Supervised Learning, Classification and Regresion, uses labled input and output samples to develop prediction models (2). Classification; a classification problem is when the output variable is a category, such as “red” or “blue” or “disease” and “no disease”. Regression; a regression problem is when the output variable is a real value, such as “dollars” or “weight”.
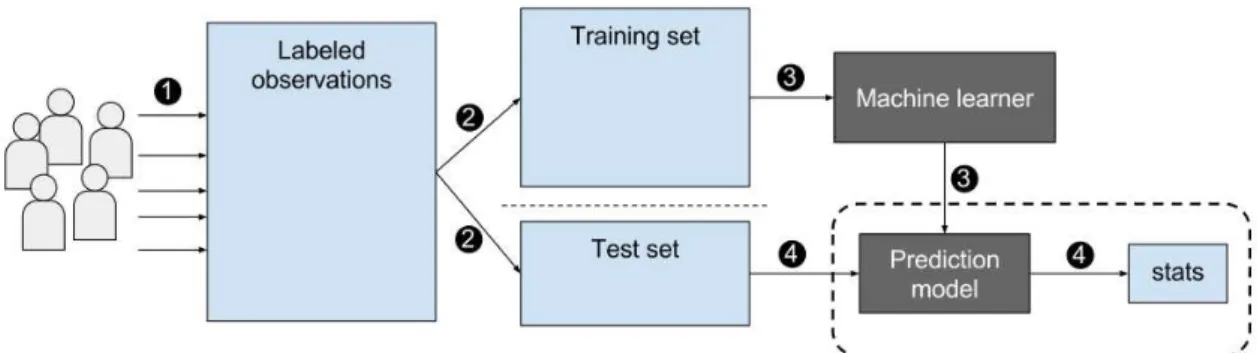
Figure 1. The process of the supervised learning
It is called supervised learning because the process of an algorithm learning from the training dataset can be thought of as a teacher supervising the learning process (Figure 1). We know the correct answers, the algorithm iteratively makes predictions on the training data and is corrected by the teacher.
Supervised learning is best suited to problems where there is a set of available reference points or a ground truth with which to train the algorithm (3).It is difficult to measure the accuracy of an algorithm trained with unsupervised learning. All learning algorithms are expected to be generalized well before grounding the relative all suspects.
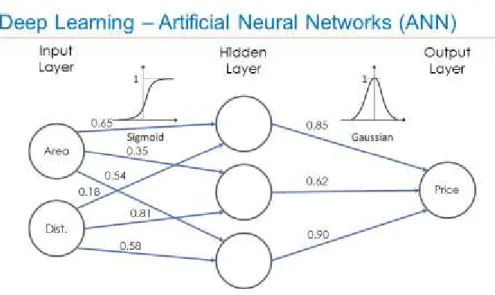
Can a machine think like a human? Human brain thinks through a series of linked neurons. Artificial Neural Networks (ANN) are the result of an effort to model the information processing ability of human nervous systems which is use wide as deep learning to day (4). ANNs simulate four basic function of a human neuron: (I) Reception of information from the external environment (input); (II) Decide on what to do with the information (activate and take into account or ignore); (III) Process the information (IV) Present the output of the whole procedure (5).
Figure 2. Architecture of a multilayer ANN (4)
ANN structure compose of any cell function, weighting matrix related to the inputs, bias value, activation function and if required a threshold value (Figure 3).
Figure 3. A basic sketch for ANN Cell
In the field of acoustics, AI methods are commonly used for likes of signal processing and is in use perfectly for speech recognition and sound classification. Stowell and colleagues used machine listening methods to automatically detect and classify audio events, and
automatically classify audio scenes. Their results comparable to the results from the human listeners. Stowel et al. trained the network based on the sounds recorded in an urban park (6). Afterwards the system is used to analyze a continuous sound level recording in different parks. Boes et al. used a 3 layer ANN to achieve human like audio perception. Their ANN made prediction about the sounds which will most likely to be noticed by the human visitors of the park (7).
As soundscape is not only the signal wised understanding but also physiological, cultural, and perceptual, it becomes more complicated for AI adaptation. It requires to be grounded the individual, sociological, physiological, physical parameters, and correlations between them concerning to perception manner.
This paper presents the preliminary findings of a soundscape research, which targeted to uses machine/deep learning to make a prediction about human perception of indoor auditory environments.
2. METHODOLOGY
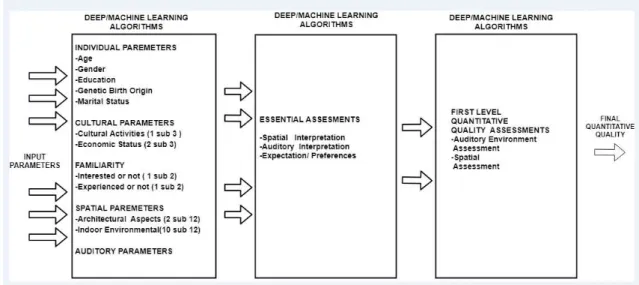
To familiarize and experiment with AI first is required grounding the possible input and output relations in the way of supervised learning, we prepared and pre-finalized a questionnaire to identify and minimize the potential issues. The input and output parameters are selected from the literature (12-14) and expanded accordingly during the current study. The possible grounding model targets the Artificial Intelligence (AI). The model is given in Figure 4. In the figure, each box indicates a “Neural Cell” algorithm as a combination of the targeted aim. The second box is ready for the deep learning algorithm as a hidden layer.
Figure 4. A Model for AI application for sound perception simulation In the model, input parameters are defined as Individual Parameters (age, gender, education, genetic birth origin, marital status); Cultural Parameters (cultural activities, economic status); Familiarity (interested or not, experienced or not); Spatial Parameters (architectural aspects, indoor environmental); Auditory Parameters. The output parameters are designated in three layers: (I) Essential Assessments (spatial interpretation, auditory interpretation, expectation/preferences); (II) First Level Quantitative Quality Assessment (auditory environment assessment, spatial assessment); (III) Final Quantitative Quality. The definition of the statements of outputs specially selected is targeted to AI application on the bases of literature. The input and output statements are also open to extend or reduce accordingly to the application would be bounded on purpose for future developments. The number of the total input is around 20; Essentials are 18; First level quality is 8; Final quality questions are five as organized. We applied the prepared questionnaire in two different museum environment.
2.1 Sites
Museums of Çengelhan Rahmi Koc and Erim Tan are selected as the case study settings for data collection. Both museums are located opposite to the main gate of Ankara Castle which is the most historic and cultural part of Ankara (Figure 5).
Figure 5 – Red spot shows Çengelhan Rahmi Koç Museum, yellow spot shows the location of the Erimtan Archaeology and Arts Museum, and blue spot shows the location of the Ankara
Castle’s entrance
Figure 6 – Exterior views of Çengelhan Rahmi Koç Museum (left) and Erimtan Archaeology and Arts Museum
The historic caravanserai of Cengelhan, which is currently a part of the Rahmi Koc Museum was constructed between 1520 and 1521. It was originally built as a caravanserai, a historic Ottoman/Seljuk building type that combines commerce and accommodation for travelers. Through the centuries, however, it was used for various functions until its restoration and conversion into a museum in 2005 (Figure 6, 7). Erim Tan museum was opened in 2015. It is comprised of the facades of three old houses around the castle. While the scale and the façade of the building are connected contextually to its historic environment, the interior provides the contemporary experience to its visitors (Figure 6, 7).
Çengelhan Rahmi Koç Museum houses exhibitions which reflect the industrial and engineering marvels of the last century. The building shows the typical characteristics of a caravanserai. The two-story building has an inner courtyard and a basement floor. The courtyard is in the middle, surrounded by vaulted cloisters. The inner courtyard is covered with a glass roof during the restoration (Figure 2) and has a total height of 10.5 meters. Ceiling height of the ground floor is 3.85 meters, while the ceiling height of the upper floor is 3.40 meters. Courtyard floor is covered with a layer of thin carpet over the
original stone floor. Rest of the enclosed space floors are generally covered with a stone finish, but wooden floor planks are also used in some rooms. The cloisters and walls are made out of a combination of brick and local stone. Their ceilings are brick vaults (Figure 7).
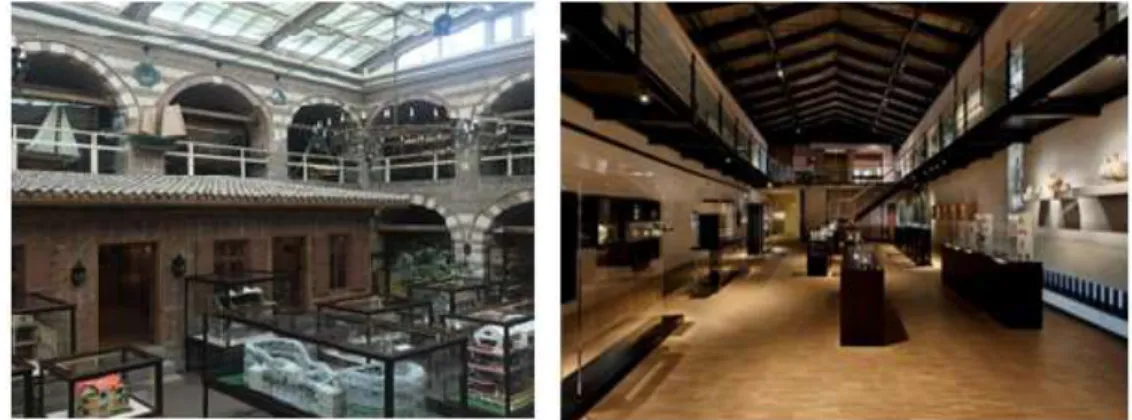
Figure 7 – Interior of the Çengelhan Rahmi Koç Museum (left) and Erimtan Archaeology and Arts Museum (right).
Erimtan Archaeology and Arts Museum is a three-story building and exhibits more than 2000 objects from Yüksel Erimtan’s collection of Anatolian archaeological artefacts like glass artifacts, gems, and coins etc. There is always a temporary exhibition throughout the year on the ground floor. The study only takes place in the permanent exhibition areas, which includes the first floor and mezzanine floor to make the study more reliable. The height of the studied area is 10,6 meters. The main floor covering material is wood. The local travertine is used on the walls. The material of the ceiling is concrete and there are glass and metal surfaces in interior space (Figure 7).
2.2 Data Collection and Analysis
In-situ measurement of LAeq and ODEON simulation are used to acquire basic information about the acoustical conditions within the museum (8). Bruel & Kjaer Sound Level Meter type 2230 is used to measure the LAeq, during the visiting hours. The in-situ measurement of sound levels is conducted at the P2. It is performed simultaneously with the questionnaire survey. Three dimensional model of the building is created with SketchUp 2017 software, based on the recent restoration drawings, and imported to the ODEON Room Acoustics Software version 12 basic edition. To find the Speech Intelligibility Index (STI) and Reverberation Time (T30), 40 receivers and six sound sources are placed in key locations.
Data collection for the study is being held through a questionnaire survey which is adapted from a previous indoor soundscape study (9). This study consisted of a qualitative and a quantitative part. In the qualitative part, Grounded Theory was used for gathering data and creating a conceptual framework. At the second part, validity of this conceptual framework is tested with Structural Equation Model approach. In order to do this, we required questions regarding each category of the framework (9). Some of these questions were adapted from literature (11). For the rest of the questions, we went over the interview transcripts of the first part again, and generated the questions based on participant interviews. Adapting questions from a recent study also provided us with the opportunity to adjust some of the questions, which we observed the participants struggle with answering questions from the previous Çengelhan Rahmi Koç Museum research mostly included in the final part of the questionnaire, where we asked participants opinions regarding the physical elements of the
space. This questionnaire consists of three main parts. First part identifies the demographic and socio-cultural status of the visitors while the second part is concerned with identifying their personal tendencies and preferences. Third part is associated with the physical properties of the space, including the sonic environment.
Figure 8 –Çengelhan Rahmi Koç Museum (left) and Erimtan Archaeology and Arts Museum (right): Sound source and receiver locations of the ODEON model.
Data collection for the study is being held through a questionnaire survey which is adapted from a previous indoor soundscape study (9). This study consisted of a qualitative and a quantitative part. In the qualitative part, Grounded Theory was used for gathering data and creating a conceptual framework. At the second part, validity of this conceptual framework is tested with Structural Equation Model approach. In order to do this, we required questions regarding each category of the framework (9). Some of these questions were adapted from literature (11). For the rest of the questions, we went over the interview transcripts of the first part again, and generated the questions based on participant interviews. Adapting questions from a recent study also provided us with the opportunity to adjust some of the questions, which we observed the participants struggle with answering questions from the previous Çengelhan Rahmi Koç Museum research mostly included in the final part of the questionnaire, where we asked participants opinions regarding the physical elements of the space. This questionnaire consists of three main parts. First part identifies the demographic and socio-cultural status of the visitors while the second part is concerned with identifying their personal tendencies and preferences. Third part is associated with the physical properties of the space, including the sonic environment.
Participants attended (n:30) the questionnaire survey voluntarily and were chosen randomly after they toured the museum. They did not have any idea about the content of the questionnaire while they were visiting. The questionnaire survey ended between 7 to 17 minutes and were recorded and transcribed verbally.
2.3 The Relation Path from Input to Essentials Assessments
The data collected from the site are considered as formerly inputs and outputs matrixes. According to the application targeted sketched in Figure 4 one input data matrix exists with three output matrixes. Together with each output matrix might also be considered as input data for the next output.
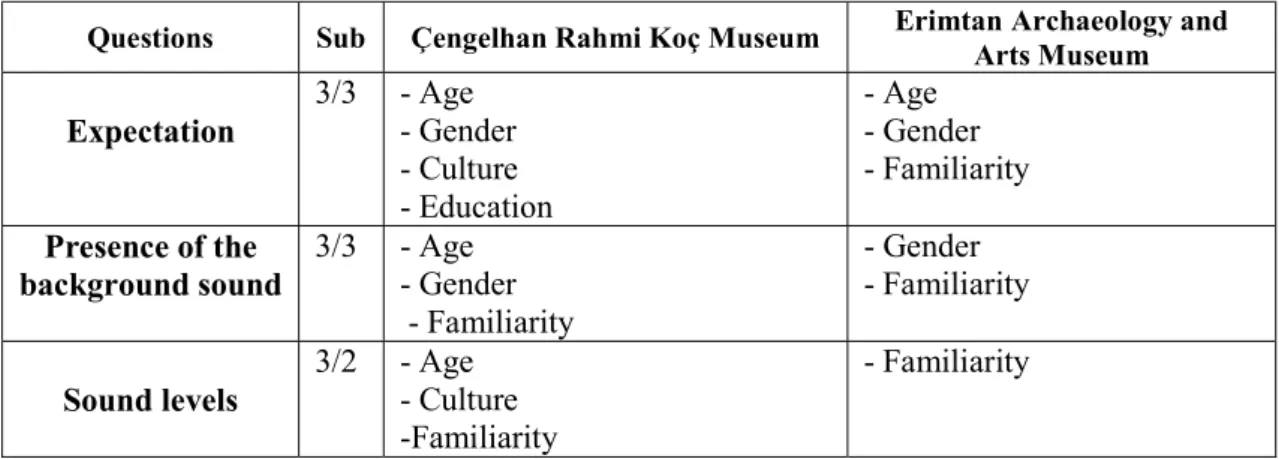
Based on the minimum deviation boundary achievements and observing the separation and correlation in the input variables, this study has attended as grouping each outcomes column for the mean and standard deviation to create sub-columns. After the classification, it becomes evident that there is a definite separation between the input variables in contributing the “Essential Assessments” (outputs). This observation and analysis are given in Table 1 for some assessment value. As a preliminary study, Erimtan Archaeology and Arts Museum’s questionnaire includes only individual parameters like cultural and education as an input. Table-1 indicates the contribution of inputs and outputs for both museums.
Table -1 Input and output statements of both museums
Questions Sub Çengelhan Rahmi Koç Museum ErimtanArts Museum Archaeology and
Expectation 3/3 - Age - Gender - Culture - Education - Age - Gender - Familiarity Presence of the background sound 3/3 - Age - Gender - Familiarity - Gender - Familiarity Sound levels 3/2 - Age - Culture -Familiarity - Familiarity
Table 1 shows three brief examples from the comparison between the essential assessment parameters and the input parameters. This comparison is held by sorting each significant essential assessment parameter into subgroups, based on the minimum standard deviation method. Afterward, checking each input parameters for points where similar responses are clustering, based on the subgroups of the essential assessment parameters. Right two columns of the table show the input parameters for the two case study settings under which the significant differences were observed for the subgroups essential assessment parameters.
According to this, gender, familiarity, and age are the three input parameters, under which differences are observed. Out of these three, we can say that the familiarity is the most reoccurring parameter and it can be said that it will potentially affect visitors’ expectations, annoyance from the sound levels and the presence of background noise. We can hypothesize that those who are familiar will be less likely to get annoyed or distracted by sound levels and the background sound as they already expect it. Prior experiences mainly influence expectations, and they are known to affect both individual behaviors and their evaluation of both the sound and the built environment (11)
In Çengelhan Rahmi Koç Museum, as all potential input parameters are included the analysis, the relation paths from “Inputs” to “Essentials” are observed clearly and separately, within comparing to the irrelevant a potential to design a neural network based AI for simulation auditory perception for similar environments.
3. RESULTS AND DISCUSSION
In Çengelhan Rahmi Koç Museum, ODEON simulation results showed that the speech transmission index (STI) ratings ranged from 0.43 to 0.77 with average rating of 0.53. Reverberation Time (T30) also simulated with ODEON software which indicated that the average T30 ratings for the common frequencies of speech are, 2.25 for 500 Hz, 1.95 for 1000 Hz and 1.86 for 2000 Hz The in-situ measurements were completed to find the LAeq level and it resulted with the average of 63.2 dB(A) (9).
In Erimtan Archaeology and Arts Museum, ODEON simulation results showed that
the speech transmission index (STI) ratings ranged from 0.35 to 0.72 with the average rating of 0.47. And average reverberation time (T30) ratings for the centre frequencies of speech are calculated as 2.62 for 500 Hz, 2.91 for 1000 Hz and 2.71 for 2000 Hz. The in-situ measurements were completed to find the LAeq level and it resulted with the average of 87,6 dB(A).
As the pilot study continues in the manner of increasing the site number, the data analysis is not complete for reaching statistical assurance to confirm affectivity of the grounding research discussed above / to make the strong inference. However, it provides with the opportunity to improve the questionnaire before we move on with the extensive data, to enhance the study.
So far, we have focused on the “Input Questions” up to 16 -20, we want these questions to classify the socio-cultural status affecting of the participants on perception, which can be summarised as the demographic information, what kind of settlement the participant is currently lived and/or used to live, what are their native language, do they have any health or hearing issues, what do they do on their free time, etc. on the outcomes separately would supply relation path to outcomes as suitable NNs base AI approach.
What we aim to identify with these questions is, do they like being in this space, did they come here on their own will or brought here by someone else, and are they likely to choose being here on their own. Answer to these can also be figured out in a much easier manner by simply asking “Are you happy being here?” However, the method we are currently using will provide us with more data and variation to train a supervised learning algorithm.
One crucial decision taken before forward, the study shows that classification, clustering base search should be done first on outcomes (essentials) are more effective then invest the search on input parameters first. This approach also gives a useful ability in the application using neural cell base structures. It is also apparent that in the forward, the input and output parameters would be presented in the matrix form and decomposition and relevant mathematical base know algorithms would be applied to deal with big data to find the trusted path for training NNs on discussion with supervising.
Generating ensured base/ground for modelling of AI which would be useful for the auditory environment will also lead unsupervised AI, means another huge study on feedback base / correlated learning/training algorithms for the feature.
4. CONCLUSION
This study could be evaluated as useful in the two bases: Firstly, defining a ground for the perception simulation which is suitable for AI application. Secondly, to use NNs Cells for AI, the classification direction should be defined on three paths. Those paths are forward, backward and interleaved ways.
Further study will be focused on the big data use with computer base manipulations to generate training algorithms and searching influence of questionnaire enhancements by increasing data collection with the base introduced.
5. ACKNOWLEDGEMENT
The authors would like to thank the management of Çengelhan Rahmi Koç Museum and Erimtan Archaeology and Arts Museum for their understanding and help during the study.
6. REFERENCES
1.Akbari, M., Asadi, P., Givi, M. K. B., & Khodabandehlouie, G. (2014). Artificial neural network and optimization. Advances in Friction-Stir Welding and Processing. https://doi.org/10.1533/9780857094551.543.
2. Tharwat, A. (2016). Linear vs. quadratic discriminant analysis classifier: a tutorial. International Journal of Applied Pattern Recognition, 3(2), 145. https://doi.org/10.1504/IJAPR.2016.079050.
3.Wittek, P. (2014). Machine Learning. In Quantum Machine Learning: What Quantum Computing Means to Data Mining (pp. 11–24). Academic Press. https://doi.org/10.1016/B978-0-12-800953-6.00002-5.
4. Guarascio, M., Manco, G., & Ritacco, E. (2018). Deep Learning. In Reference Module in Life Sciences (pp. 741–751). Academic Press. https://doi.org/10.1016/B978-0-12-809633-8.20352-X.
5. Profillidis, V. A., Botzoris, G. N., Profillidis, V. A., & Botzoris, G. N. (2019). (Artificial Intelligence—Neural Network Methods. Modeling of Transport Demand, 353–382. https://doi.org/10.1016/B978-0-12-811513-8.00008-X.
6. Stowell, D., Giannoulis, D., Benetos, E., Lagrange, M., & Plumbley, M. D. (2015). Detection and Classification of Acoustic Scenes and Events. IEEE Transactions on Multimedia, 17(10), 1733–1746. https://doi.org/10.1109/TMM.2015.2428998.)
7. Boes, M., Filipan, K., De Coensel, B., & Botteldooren, D. (2018). Machine Listening for Park Soundscape Quality Assessment. Acta Acustica United with Acustica, 104(1), 121–130. https://doi.org/10.3813/AAA.919152.
8. Acun, V., Yilmazer, S. & Orhan, C. (2018, May). Indoor Soundscape of Historical Spaces: The Case of Çengelhan Caravanserai. Presented at the Euronoise2018, 11th European Congress and Exposition on Noise Control Engineering, Hersonissos, Crete, Greece. 9. Yilmazer, S. and Acun, V. A Structural Equation Modelling Approach for Indoor Soundscape:
Adaptive re-use in Çengelhan Caravanserai, AESOP 2018, 10-12 July 2018, Gothenburg, Sweden.
10. Davies, W. J., Adams, M. D., Bruce, N. S., Cain, R., Carlyle, A., Cusack, P., Poxon, J. (2013). Perception of soundscapes: An interdisciplinary approach. Applied Acoustics, 74(2), 11. Bruce, N. S., & Davies, W. J. (2014). The effects of expectation on the perception of
soundscapes. Applied Acoustics, 85, https://doi.org/10.1016/j.apacoust.2014.03.016 12. Davies, W. J., Adams, M. D., Bruce, N. S., Cain, R., Carlyle, A., Cusack, P., Poxon, J
(2013). Perception of soundscapes: An interdisciplinary approach. Applied Acoustics, 74(2), 224–231. https://doi.org/10.1016/j.apacoust.2012.05.010
13. Spilski, J., Schulte, M., Meis, M., Huber, R., Meister, H., & Fischer, R.-L. (2016). Development and psychometric properties of the sound preference and hearing habits questionnaire (SP-HHQ). International Journal of Audiology, 57(sup3), S118–S129. https://doi.org/10.1080/14992027.2016.1248795
14. Yu, L., & Kang, J. (2008). Effects of social, demographical and behavioral factors on the sound level evaluation in urban open spaces. The Journal of the Acoustical Society of America, 123(2), 772–783. https://doi.org/10.1121/1.2821955