Coğrafi Bilimler Dergisi, 2003, 1(2), 85-101
A COMPARATIVE ANALYSIS OF THE FOREIGN-BORN
POPULATION IN TEXAS, 1990.
Teksas’ta Yabancı Doğumlu Nüfusun Karşılaştırmalı Analizi, 1990.
Yılmaz ARI
Balıkesir Üniversitesi Fen-Edebiyat Fakültesi Coğrafya Bölümü [email protected]
Abstract:This research compares socioeconomic characteristics of the foreign-born population
to the “native” (non-foreign-born) American population of Texas. Two different two-way discriminant analyses were run in SPSS (Statistical Package for Social Sciences) to compare the foreign-born and native populations in small areas. Those small areas were block groups, census designated areas, which usually contain 400 to 600 households. I chose block groups with concentrations of foreign-born and compared these groups with other groups to see which socioeconomic characteristics were more important in distinguishing areas with foreign-born population from other areas. The results of the discriminant analyses showed that the areas of foreign-born concentration were different from the native areas with their lower income, lower educational levels, lower percent of people with the ability to speak English, higher percent of population with Hispanic origin, and slightly higher unemployment rates.
Keyword: Texas, U.S.A., Foreign-born population, population geography, discriminant analysis. Özet: Bu araştırmanın amacı Teksas’ta yabancı doğumlu nüfusun sosyo-ekonomik özelliklerini,
yerli nüfus ile karşılaştırmaktır. Araştırma yabancıların yoğunlukta olduğu bölgelerin hangi özellikler bakımından yerlilerin yoğun olduğu yerlerden farklılaştığını ortaya koymaya çalışmaktadır. Araştırmanın veri tabanını Amerika Birleşik Devletleri (ABD) 1990 nüfus sayımının Blok Grupları düzeyinde elde ettiği veriler oluşturmaktadır. Blok Grupları ABD’de 400 ile 600 civarında evden oluşan nüfus sayım bölgeleridir. Yerli ve yabancı doğumlu nüfusu karşılaştırabilmek için yabancıların en yoğun olduğu Blok Gruplar seçilerek, bunlar kendilerine bitişik ama yabancıların yoğun olarak bulunmadığı Blok Grupları ile karşılaştırılmıştır. Kontrol grubu olarak da aynı ilçelerden (County) rastgele seçilmiş Blok grupları kullanılmıştır. Yabancı nüfusun en yoğun olduğu ilçeler Harris, Tarrant, Dallas, Travis, El Paso ve Bexar olduğu için bütün örnekler bu ilçelerden seçilmiştir. Karşılaştırmada SPSS (Statistical Package for Social Sciences) yazılımı ile diskriminant analizi yapmak yoluyla istatistiksel yöntem kullanılmıştır. Discriminant Analizi bu tür durumlarda herhangi bir elemanı özelliklerine göre belli bir gruba dahil etme esasına dayandığı için tercih edilmiştir. Bu analizin sonuçları göstermiştir ki yabancı doğumlu nüfusun yoğunlukta olduğu yerler gelir ve eğitim seviyesinin daha düşük, iyi İngilizce konuşamayanlar, Hispanik kökenli nüfusun ve işsizlik oranının daha yüksek olması durumu ile diğer alanlardan ayrılmaktadır.
Anahtar Kelimeler: Teksas, ABD, yabancı doğumlu nüfus, nüfus coğrafyası, diskriminant analizi.
1. Introduction
Over the last few decades, immigration has emerged as an ever more important issue throughout the world. Even though the determinants of international migration to the United States have changed over time, the volume of migration has grown and immigrants' origins have shifted from
Europe to Asia and Latin America. International migration has helped many developed countries like the U.S. in becoming diverse, multi-ethnic societies. During the last 40 years, legal immigration to the U.S. grew from 170,000 to 904,000 persons per year (Latour, 1996: B6). More important, immigration officials have estimated that for every legal immigrant, at least two immigrants entered the country illegally (Bouvier and Gardner, 1986: 4). Immigration has become as significant a demographic, economic, and political issue in the U.S. at the end of the 20th century as it was at the century's beginning (Martin and Midgley, 1994: 2).
One of the most popular destinations for immigrants to the U.S. is Texas. According to the 1990 census (Bureau of the Census, 1992), after California, New York, and Florida, Texas had the fourth largest number of immigrants. Of the 1990 census count of almost 17 million people in Texas, one and a half million were foreign-born. The foreign-born population is nine percent of the population, which is one percent higher than that of the U.S.
The distribution of the foreign-born population is not even in Texas. Star County, which is on the Mexican border, has the highest percent of foreign-born with 34.8 percent. Sabine and San Augustine counties have the lowest percents with 0.4. Thirty-three counties have more than 10 percent foreign-born, and eight of the Texas' 254 counties have more than 20 percent foreign-born. All eight counties are located on the Mexican border. Fifty-nine percent of the total foreign-born population came from Mexico, 3.5 percent from Vietnam, 3.2 percent from El Salvador, 2.2 percent from Germany, 2.1 percent from India, 1.8 percent from United Kingdom, 1.7 percent from South Korea, and 1.7 percent from Philippines.
This research compares socioeconomic characteristics of the foreign-born population to the "native" (non-foreign born) American population of Texas. I did not want to include a high concentration of Mexican-born areas because of this group's size and the closeness of their origins to Texas. However, because of data availability problems, it is not possible to separate Mexican-born population from other Hispanics and foreign-born groups. Instead of general foreign-born concentrated areas, I have chosen the block groups with a concentration of non- Hispanic population. These block groups include the highest percents of the non- Hispanic foreign-born. Because a considerable portion of the foreign-born population is Hispanic, mainly Mexican, these block groups also include a high percent of Hispanic population as well. I intended to focus on providing a clearer understanding of the different socioeconomic characteristics of the smaller foreign- born populations in Texas. However, because of the notable proportion of Hispanic population in most foreign-born areas in Texas, the characteristics of foreign-born areas reflect general Hispanic characteristics as well. The analysis compared the foreign-born and native populations in small areas. Those small areas are block groups, census designated areas, which usually contain 400 to 600 households. As my main study group, I chose block groups with concentrations of foreign-born and compared these groups with other groups to see how different the characteristics were. The analysis answers the question: which socioeconomic characteristics are the more important in distinguishing areas with foreign-born population from other areas.
2. Justification for the Study
Today, immigration to the U.S. has exceeded levels ever previously recorded. From 1945 to the present, the number of immigrants has grown dramatically. While only 20,000 immigrants entered the country in 1945, the number has grown to 240,000 in 1950, 290,000 in 1960, 480,000 in 1970, 590,000 in 1980, and after the IMMACT of 1986, to one and a half million immigrants in 1990 (Martin and Midgley, 1994).
In 1990, almost three-fourths of the 20 million foreign-born population in the U.S. lived in California, New York, Florida, Texas, New Jersey, and Illinois. Immigrants have their greatest impact in particular places at the state and local level. In short, their impact is often quite localized. The immigrants' diverse national and ethnic characteristics introduce new cultural elements to their American host communities. Such cultural transfers include language, cuisine, and even cognitive
categories of political understanding (Rodriguez, 1987: 5). Each of the ethnic minorities, illegal migrants in particular, establishes a community not typically found among Americans.
The patterns of immigration to the U.S. have changed significantly since the Immigration Act of 1965. Because over 90 percent of the immigrants arriving today are from non-European countries, immigration will continue to alter distinctly the ethnic make-up of the American population. For example, in 1990, 23 percent of the arriving immigrants were from Asia, while only 1 percent of the native-born population was Asian. In addition, immigrants have slightly higher fertility rates than native Americans, which increases their impact on the total population. For example, in 1980, according to the census (Bureau of the Census, 1982), the average number of children-ever-born to Asian immigrant women aged 35-49 was 2.3. This number was 3.6 for Vietnamese women, 4.7 for Laotian women, and 3.1 for Latin American women, while it is 2.6 for American women.
Texas' population is projected to grow to 30 million by 2035. Over that period of time, the non-Hispanic white proportion will decline from 63 to 43 percent, the Hispanic share will increase from 23 to 39 percent, the Asian share will increase from 2 to 6 percent, and the black proportion will decline slightly from 12 to 11 percent (Bouvier and Gardner, 1986: 27).
As immigration patterns have changed dramatically in the last three decades, both immigrants and established residents have become concerned with how people will adapt to the increasing diversity in their communities. To reduce the possible problems, especially at the local level, more research is needed. Bouvier and Gardner (1986: 28) pointed out that "the challenges of such a major ethnic shift should not be minimized, but neither should they be viewed with too many misgivings. The notion is resilient and with adequate planning any problem posed by such changes can be addressed." Studying the international migration and distribution patterns is important because migration patterns of a given group affect its level of spatial concentration, assimilation process, and political power.
This research hopes to contribute to the literature by examining the characteristics of the foreign-born population and comparing these characteristics to the characteristics of the native population. What makes this study unique is that unlike other studies, it compares geographic areas with concentrations of foreign- born population to areas with concentrations of native population.
3. Background Information
Historically, Texas has been a meeting place of people (Meinig, 1969). People have come from different parts of the U.S. and overseas and settled in Texas. From 1860 to 1900, the population of Texas increased fivefold and much of that growth was by immigration (Jordan, 1980). In the early history of Texas, immigrants usually came from other regions of North America. At that time, two eastern cultures dominated the immigration flows. They were the Middle Atlantic and the Upper South (Jordan et al., 1984). Later, when Texas was a province of Mexico, the Mexican government instituted a policy designed to attract settlers to Texas. After becoming independent in 1836, the immigration of Anglos increased. The reason for this increase was because land allotments were bigger and the price of land was cheaper (Jordan et al., 1984).
Although a considerable portion of black people in Texas came from other Southern States, some Texas blacks arrived directly from Africa in an illegal trade that lasted until the Civil War. However, the abolition of slavery caused a sharp decline in black immigration. After 1865, the proportion of blacks began decreasing steadily.
The roots of Hispanic population in Texas reach the times of Spanish and Mexican colonization. In fact, Spaniards from the Canary Islands were responsible for the establishment of the first civilian settlement in Texas, Villa (Meinig, 1969). By 1850, the Spanish surnamed population of Texas were six or seven percent of the state's total (Fleisher, 1963).
By far the largest European element in Texas is German who immigrated into the state largely between 1830 and 1914. Major German colonization efforts occurred in the 1840s as a result of several organized projects. The Adelsverein, a society of German noblemen who were interested in
overseas colonization, introduced more than 7,000 Germans into Texas between 1844 and 1847. Another similar effort led to the immigration of about 2,000 Germans about the same time (Jordan et al., 1984). After the German revolution a considerable number of Germans, usually liberals, who lost against the conservatives, came to Texas after 1848 (Day, 1996). Probably six percent of the state's total population is of German birth or ancestry. Over two million Texans claim at least partial German ancestry (Jordan et al., 1984). Between 1844 and 1847, German immigrants established settlements at the west and north of San Antonio such as New Braunfels, Castroville, and Fredericksburg. As a result of German immigration a "German belt" formed across South Central Texas, from Houston and Galveston on the east into the Hill Country beyond San Antonio and Austin on the west (Jordan, 1980).
The first considerable group of Czechs arrived in 1851. They settled in Fayette County and from there they expanded to dominate some of the best farmland in Texas. The oldest Polish colony was in Texas also. Before 1854, the Polish immigrants, led by a pastor who feared that their ethnic identity and Lutheranism were endangered in Prussia and Saxony, came to Texas. The main Swedish immigration, on the other hand, occurred after the Civil War. Swedish immigrants came to Texas as indentured labor. By 1910, some 10,000 persons of Swedish birth or parentage lived in Texas.
Although Texas has people from different backgrounds, many groups have lost much of their cultural heritage because of the process of assimilation. At present, however, a notable degree of regionalism survives in the state. One still can see cultural heritage of Germany, Czechoslovakia, Poland, Spain, Mexico, and Africa. In spite of this diversity, Jordan et al. (1984) noted that a sense of unity has long characterized most Texans, a sort of "nationalism" rooted in the ten-year period of Texas independence.
After the 1900s, the most important determinant of the international migration to Texas, like other states, has been the federal immigration policies. Not only did economic and social conditions in the U.S. and abroad affect the qualitative and quantitative characteristics of migrants, but also the U.S. immigration policies had major effects on immigrants’ characteristics. From the colonial period until the early 1900s, the American government welcomed immigrants. At that time, the entry of newcomers was unrestricted. After the 1900s, several immigration laws were passed by Congress to control immigration flows. These immigration laws did not achieve their original purpose. However, they often had surprising and unintended effects on the U.S. (Martin and Midgley, 1994: 3).
The first immigration laws did not carry restrictive rules. The Naturalization Act of 1790 established the principle that an immigrant could become a citizen after several years of residence in the U.S. In 1819, the federal government required ship captains to collect and report data on immigration. In 1875, Congress barred convicts and prostitutes from immigrating to the country. The Immigration Act of 1882 added "mental defectives" to the groups of undesirables who could not immigrate to the country (Browning 1968). In 1882, the federal government for the first time forbade immigration from a particular country, China. This ban remained in effect until 1943. In 1907, Japanese immigration was stopped by the "Gentlemen's Agreement".
In 1921, Congress changed its method of regulating immigration. It established numerical restrictions on immigrants according to quotas for specific national groups. The 1924 law reduced the annual limits of 358,000 immigrants of the 1921 law to 150,000. These laws established principles of selecting immigrants according to past national origins of the American people. In 1952, congressional reformers hoped to liberalize the law, but the McCannon-Walter Immigration and Naturalization Act (INA) left the national origins systems in place (Kelly, 1979: 29).
Fundamental reform occurred in 1965. The Immigration Act of 1965 eliminated the country of origin as a qualification. Under this law close relatives of U.S. citizens and people had special skills could immigrate to the U.S. This law provided a 20,000 immigrant limit to Eastern Hemisphere countries (Allen and Turner 1996). The Refugee Act of 1980 required the president to consult with Congress on the annual number of refugees to be admitted. The act also gave responsibility to the federal government to help refugees settle in the U.S. About 1.4 million refugees came to the U.S.
under the Refugee Act of 1980. In 1986, Congress passed the Immigration Reform and Control Act (IRCA) to slow illegal immigration. The IRCA attempted to close the American labor market to foreigners. However, it allowed 2.7 million undocumented aliens to obtain permanent resident status. In the late 1980s, some economists predicted a shortage of skilled labor in coming decades (Martin and Midgley, 1994: 21). The Immigration Act of 1990 ( IMMACT) reflected the fear that the previous laws hurt U.S. competitiveness by assigning the highest preference visas to relatives of U.S. citizens, rather than people with needed job skills.
4. Literature Review
The number of studies on North American immigration is considerable. Many of these studies focus on immigration issues at the national level, rather than the state or local level. In general, international migration studies have had several shortcomings. According to Massey et al. (1994: 700), the statistical methods researchers use in international migration studies are too simplistic and appropriate controls are lacking. In many cases unreliable survey designs offer little basis for testing hypotheses or for generalization. There are two reasons for such shortcomings. The first is a lack of good representative data. The quality and quantity of information on immigration is inadequate. The second reason is that population related institutions have never developed a specialized survey data set for international migration. There are no standard surveys such as World Fertility Survey, the Demographic and Health Survey, or the U.S. National Longitudinal Survey, which were developed to provide information on fertility, mortality, and stratification, respectively. Although national censuses provide some information about the foreign-born, census data have their own problems and limitations (Bean, Browning, and Frisbie, 1984: 57). Censuses underestimate undocumented migrants, provide no information on legal status, and are ill suited to the study of immigration as a process rather than an event (Passel, 1985: 10).
Massey et al. (1993: 432) also noted that another important reason for the scarcity of good, solid studies on international migration is the lack of a commonly accepted theoretical framework. Social scientists do not approach the study of immigration with a shared paradigm. As a result of this approach, research on the subject tends to be narrow, inefficient, and characterized by duplication, miscommunication, reinvention, and questioning about fundamentals. Despite these difficulties, much of the North American research literature is devoted to methodological and measurement issues: how to measure undocumented immigrants; how to count the number of immigrants and emigrants; how to study patterns of immigration assimilation; and how to analyze the social and economic consequences of immigration (Massey et al., 1994: 701).
Local-level immigration studies in Texas focus on issues other than comparing the foreign-born and native populations. Because a large majority of immigrants have come from Mexico, many studies in Texas have focused on Mexican immigrants. These studies deal with such issues as measurement of illegal immigrants (Bean, 1982), family issues, fertility, and marital instability (Alvirez and Bean, 1976; Bradshaw et al., 1972), and income inequality (Fossett, 1982). Other studies focus on assimilation of illegal Hispanics (Rodriguez, 1987), effects of the Immigration Reform Act of 1986 on Mexican immigration to Texas, and immigration history and the general picture of immigration in Texas (Sharp, 1993). While this research covers general issues about the international migration to the U.S, no study compares areas of concentrations of foreign-born to areas with concentrations of natives. This situation seems to be an error of omission in previous literature. Because of this omission, this study should provide a clearer understanding of the comparison of the foreign-born population to the native population in small urban areas in Texas.
5. Methodology: The Block Group Data
I analyzed five characteristics to compare areas with concentrations of foreign-born population to those with U.S. native populations. Social characteristics include education and the ability to speak English. Income and employment status are the economic variables. I also used people
of Hispanic origin, an ethnic variable, as a discriminator. Table 1 shows the characteristics, measurements and definitions.
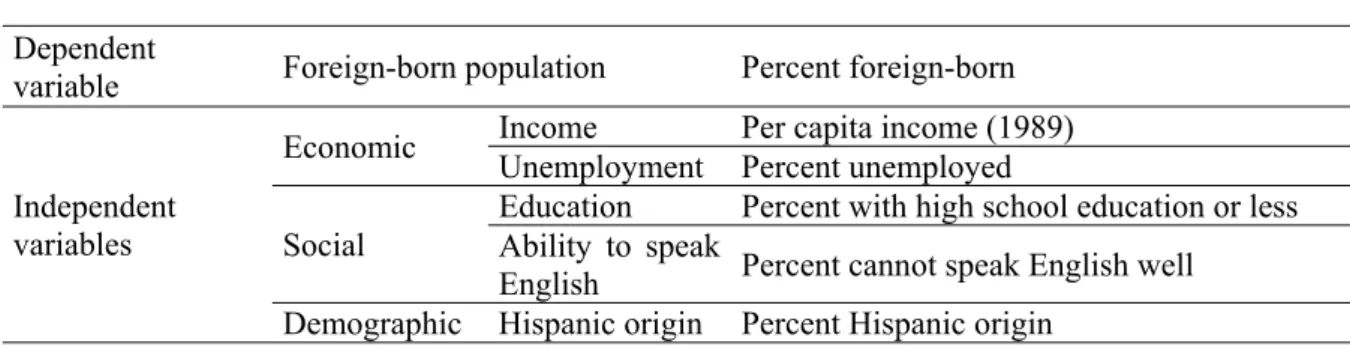
Table 1. Definitions and Measurement of Variables.
Conceptual factors Variables Measurements Dependent
variable Foreign-born population Percent foreign-born
Independent variables
Economic Income Per capita income (1989) Unemployment Percent unemployed Social
Education Percent with high school education or less Ability to speak
English Percent cannot speak English well Demographic Hispanic origin Percent Hispanic origin
Because country of origin data are not available at the block group level of census geography, I was not able to compare the characteristics of people who were born in different countries. However, these data are available at the county level and indicate that the major foreign-born groups include Mexican, Vietnamese, EI Salvadoran, German, Indian, British, Korean and Filipinos. Figure 1 shows the distribution of the foreign born, while Figure 2 shows the foreign born excluding the Mexican-born population.
To examine whether people's characteristics in areas of the foreign-born concentrations differ from the native areas, I found places that have concentrations of foreign-born groups at the block group (BG) level. The highest foreign-born concentrations are at the block group level and the census has made this information available at this geographic scale. I used the data from the Summary Tape File 3A (STF3A) of the 1990 Census of Population.
To find the block group with the highest percents of foreign-born population block groups, I first located the census tracts with the highest percents of non-Hispanic populations. From these tracts, I chose the block groups that had the highest percent of foreign-born population. Most likely, these block groups include the highest percents of the non-Mexican foreign-born population. Because the Mexican-born population comprise the majority of the total foreign-born (25 times larger than the second largest group), these block groups, at the same time, still had high percents of Mexican-born population. Because of this, even though I intended to examine the characteristics of non-Mexican foreign born, it appears that it is methodologically impossible not to include them in this study.
Figure 1. Foreign-born population as percent of the total population in Texas, by county, 1990.
Data Source: 1990 United States Census of Population
The census tracts that included the highest percents of the foreign-born population are located in Harris, Tarrant, Dallas, Travis, El Paso, and Bexar counties. This distribution is obvious from Figures 1 and 2. If I had not considered the Mexican-born population in the process of choosing these block groups, instead of the present sample of block groups, I probably would choose some other block groups near the Mexican border.
Figure 2. Percent of foreign-born population in Texas, excluding Mexicans, by county, 1990.
Data Source: 1990 United States Census of Population
The first group, which is the main study group, included 30 block groups with the highest percents of foreign-born population. The percents varied between 15 and 58. On average, the percent for this group was 40.38, which is almost 5 times larger than that for Texas as a whole. Of these 30 block groups, 18 were in Harris County, five were in Bexar County, three were in Dallas County, and two were in El Paso County. Tarrant and Travis counties had one block group each. I would have selected all of these 30 block groups from Harris County because it includes a higher percent of foreign-born more than any other county in Texas. However, to avoid emphasizing the same origin or characteristics, (on the assumption that people who have the same origin and characteristics usually live together), I chose the block groups from the other counties as well. For the same reason, most of these block groups are not in the same census tracts.
The second group contains another 30 block groups. I chose these groups among the block groups geographically contiguous to the first group. I determined these block groups by using the Census Bureau's block group maps, copies of which are on file at TNRIS (Texas Natural Resources
Information Systems). The geographic distribution of these block groups is the same as the previous ones. The percent of the foreign-born population in this group varied from zero to 42 percent. On average, 18 percent of this group was foreign born. For this group, having a smaller percent of foreign-born was the key criteria. However, because the foreign-foreign-born population tend to live together, the contiguous block groups also included higher percents of foreign-born than the usual, as was expected. These block groups, compared to the other two groups are considered neither "native" nor" foreign born." Therefore, if there is a trend in terms of the characteristics the results of the analysis for the second group should be in between or intermediate as well.
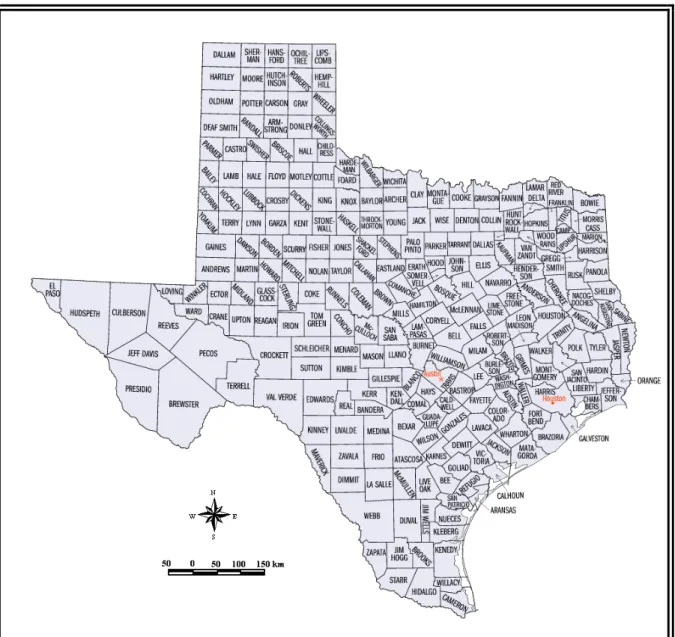
Figure 3. Map of Texas Counties
Data Source: United States Census Bureau
The third analytical group included 32 block groups. I selected the block groups randomly from the same counties as the previous groups. There were, for example, 18 block groups from Harris County in the first group. Therefore, I randomly selected 18 block groups from Harris County for the third group. The percent for the foreign born in this group varied from zero to 28. The average was
8.56, which is almost the same as it is for entire Texas. This group served as a control group in the analysis to see whether there were distinct differences among the three groups of block groups.
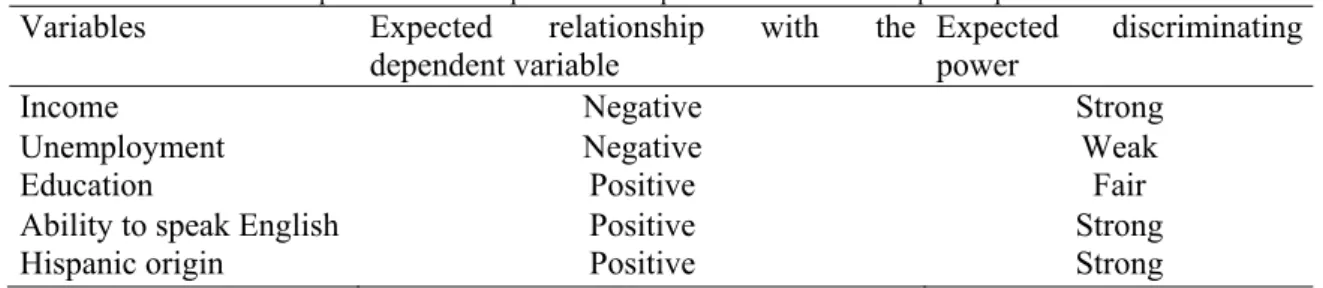
The primary hypotheses for this analysis are that the block groups that have highest percent of foreign-born population tend to have lower educational levels, lower per capita income, lower percents of people with the ability to speak English, higher unemployment rates and higher percent of people with Hispanic origin. Among those, ability to speak English, income, and Hispanic origin are expected to be the most powerful discriminators between the three groups. The variables, their expected relationships with the dependent variable, and the power of discrimination of these variables are shown in Table 2.
Table 2. Variables and their expected relationships with the dependent variable and expected power of discrimination.
Variables Expected relationship with the dependent variable
Expected discriminating power
Income Negative Strong
Unemployment Negative Weak
Education Positive Fair
Ability to speak English Positive Strong
Hispanic origin Positive Strong
To analyze the data of the three different groups, I compared these groups to each other. In the first step, I compared the first group that included the highest percent of foreign-born to the second group and then the third group. To compare these groups I used discriminant analysis. This type of analysis is useful to determine group membership. In this case, given the characteristics of the individual block groups in each group (one, two, or three); the analysis determined what group these individual block group should belong to.
6. Understanding Concentrations of Foreign Born: Explanatory Variables and Statistics
I used five characteristics that I thought would distinguish between the foreign-born areas and the native areas. These characteristics are education, income, ability to speak English, employment status and people who have Hispanic origin. Because the country of origin data are not available at the block group level, it is not possible to make comparisons, as it was proposed earlier, among different foreign-born population groups.
Education is an important social indicator in the immigration process. Funkhouser (1992: 70) discovered that educated urban workers could expect substantial earnings gains from U.S. migration, more than poorly educated rural dwellers. In 1980, 67 percent of the total U.S. population aged 25 and over had completed high school. The proportion was well above this for immigrants in the U.S. The Asian immigrants had the highest proportions. Seventy-three percent of Asians completed high school. The percentage was 89 for Indian immigrants. On the other hand, only 21 percent of Mexican immigrants had completed high school. Because of this disparity, Bouvier and Gardner (1986: 23) concluded that Asian immigrants enter one sector of the U.S. society and Hispanic immigrants another. One-fourth of recent immigrants over age 25 have at least a bachelor's degree, while 42 percent had less than a high school education in 1990.
Although the educational level of immigrants is well above that of the native population in the U.S, this is not the case in the study area. The percent who had a high school degree or less is almost the same for the first and the third groups, and the second group had the lowest value. The educational levels in the areas with foreign-born concentration, the first and second groups together, have the lower rates probably because of the Hispanic population, whose educational level is well below that of the native population and other immigrant groups. Because of this, education was a bi-model variable in the analysis. There were several well-educated and poorly educated block groups in all the three groups. In the first group, the percents of people who had a high school education or less varied
between 3.9 and 74.1. Where 3.9 percent of people had high school education or less, which is Travis County Census tract 17.04, Block Group 1 (north and west of MoPac), more than 5 percent of the foreign-born population speak Indic, Portuguese, Spanish, Tagalog, Chinese, and Japanese. This educational level is eight times higher than that of the average for the "native" groups. On the other hand, where 74.1 percent of people had a high school education or less, Bexar county Census Tract 1702 Block Group 4 (Southwest San Antonio), more than 5 percent of the foreign-born speak only Spanish. From these data I can see that this is a predominantly Mexican- American area. Data about the other foreign-born areas show that Spanish-speaking areas tend to have lower educational levels than non-Spanish speaking areas.
One's ability to speak English is important in terms of adaptation and participation in social processes. In the 1990 census, 32 million Americans reported that they spoke a language other than English at home. Fourteen million said they did not speak English very well. Almost half of the 17.3 million U.S. residents whose native language is Spanish do not speak English. Half of the Asians are in this group also. Martin and Midgley (1994: 24) noted that at the beginning of the 20th century, immigrants could work in factories or build railroads without speaking English, but in today's service dominated economy, it is almost impossible to earn enough to keep a family above the poverty level without speaking English. One recent study reported that among immigrant men who spoke a language other than English at home those who were not fluent in English earned only about half as much as those who were.
The ability to speak English was one of the most valuable discriminators because of its indirect relation with income and people of Hispanic origin. Since chances in immigration laws in 1965, large communities of Spanish- speaking people developed in many U.S. urban areas. This situation lowered the economic and social costs of not speaking English and increased the usefulness of speaking Spanish (Massey, 1995: 647). As a result of this trend, the new immigrants from Latin America are less likely to learn English than were their European counterparts at the turn of the century. Many local governments now provide their services in Spanish in addition to English. Also related to the ability to speak English, some scientists predict that assimilation will become more of a two-way phenomenon, with Euro-Americans learning Spanish and consuming Latin cultural products as well as Latinos learning English and consuming Euro-American products. Those who are able to speak both languages will benefit economically more than other people (Massey, 1995). It seems that Latinos will be more successful in learning English because of forcing factors, which are economic motivation and social benefits.
The ability to speak English was the most powerful discriminator for both of the analyses. The percent who cannot speak English well or not at all was highest in the first group, second highest in the second group and the lowest in the third group. In some block groups, percent of the population that cannot speak English well or at all exceeded the percent of foreign-born. This unusual situation is probably because some foreign-born parents speak to their children who are born in the U.S. in their native language. The ability to speak English is closely related to the Hispanic origin population. Wherever the percent of Hispanic population is high, the ability to speak English tends to have high values.
The common economic indicators used in immigration studies have been unemployment and per capita income. Blejer, Johnson, and Prozecanski (1978) employed models that assessed the effects of two variables on Mexican migration levels to the U.S. from 1960 to 1975: wage differentials and unemployment ratios. These researchers tried to predict the yearly number of legal immigrants from the ratio of Mexican/U.S. unemployment, the ratio of Mexican/U.S. industrial wages and agricultural wages. In their analysis, the explanatory power of employment exceeded that of wages. As Mexican unemployment increased, the volume of both legal and undocumented migration from Mexico rose. Relative wages contributed no additional explanatory power once they controlled the effect of Mexican unemployment. Bean et al. (1990) also used unemployment as a predictor of immigration
from Mexico to the U.S. Fleshier's (1963) analysis also found a strong relationship between the Puerto Rican unemployment rate and the volume of migration to the U.S.
The most debated question about the economic effects of immigration is how newcomers affect various groups of residents, such as unskilled workers, professionals, and employers. Most studies focus on the effects that unskilled immigrant workers have on unskilled American workers. Case studies found that in some industries, employers hired the first workers from a specific immigrant group for certain jobs within an industry by chance or by design. After immigrants dominate a particular job in the labor force, the language and the culture of the workplace often change and native workers who might have accepted these jobs at least temporarily no longer find out about them (Martin and Midgley, 1994).
In this analysis, even though the rate of unemployment decreased slightly with the decrease of the foreign-born, as a discriminator, it was the least important variable. It had little effect on assigning the cases into groups. However, although the economic factors are the most important motivators for migration, unemployment among the foreign born was still over four percent.
The percent of the population of Hispanic origin people discriminates between the different groups mainly because of a network effect. Communication with people who have already migrated is important in terms of the decision to migrate. Texas has 22 percent of the total Mexican immigrants to the U.S. The percent of Mexican immigrants is high mainly because Texas shares an international border with Mexico and used to be its territory. In addition, one of the empirical regularities of migration is that the majority of migrants go only a short distance (Ogden, 1984). This is why Texas, along with Arizona, New Mexico, and California have high percents of people with Mexican origin. However, the push factors in the Mexican side of the border and pull factors in the U.S. side are the most important contributors of the Mexican immigration. The average level of income in the border zone on the U.S. side is three to four times higher than on the Mexican side. On the U.S. side, the majority of American adults had completed high school, while only about 10 percent of adults on the Mexican side had completed 12 years of schooling. Despite the large wage differences, the standard of living of Mexican migrants in the U.S. is probably not much higher than what it was in their native country. Because of this low standard of living, their income is still lower than that of the native population. Traditionally, Mexicans have seen the north as a physical and cultural border, a zone where life is not easy but where many opportunities exist (Weeks and Chande, 1992). Migrants going long distances, on the other hand, go to one of the great centers of commerce or industry (Ogden, 1984). This generalization explains why the foreign-born population are concentrated in the big metropolitan areas in Texas.
The first group in the analysis had 47 percent of the population of Hispanic origin. This number decreased to 27 in the second group and 22 in the third group. The decrease is notable between the first and second groups but it is small between the second and the third group. The reason for this is because not only the areas of foreign-born population concentrations have high percents of people of Hispanic origin, but also the other areas have high percents as well. However, high percentages of Hispanics in the third group are not affecting the determination of the group membership because their characteristics tend to be more similar to the Anglo- Americans' characteristics.
Income also has a relationship with immigration. International migrants usually expect to earn higher incomes at their destination. A recent study found that in El Salvador people who migrated most frequently were those least affected by the political violence and who could expect the greatest income gain from working in the U.S. (Massey et a1., 1994: 737). Conroy (1985: 24) also notes that average incomes differ by a factor of five between Mexico and the U.S. Even after adjusting for the cost of transportation, entry and foreign living, most Mexican workers can expect to earn three times what they would at home.
In the first group, average income was $9,747, which is almost the half of it is in the control group. It seemed that income has a strong relationship with the ability to speak English and obviously
with employment status. Despite their low income, Rodriguez (1987) noted that immigrants send a part of their earnings back home. It is not surprising, then, that they have a lower standard of living. In the second group, the average income was 50 percent higher than the first group, and in the third group, it was 85 percent higher than that of the first group.
7. Summary of Results of the Discriminant Analysis
To distinguish between the three groups, I first used a 3-way discriminant analysis. The results of this analysis were not as good as the results of the 2-way discriminant analyses. This result was mainly because of confounding effects of the percent Hispanic in each group. Therefore, I ran two different 2-way discriminant analyses. The first analysis compared the foreign-born areas, the first group of block groups, to the "contiguous" block groups, the second group of block groups. The second analysis compared the foreign-born areas to the "native areas", which is the third group of block groups.
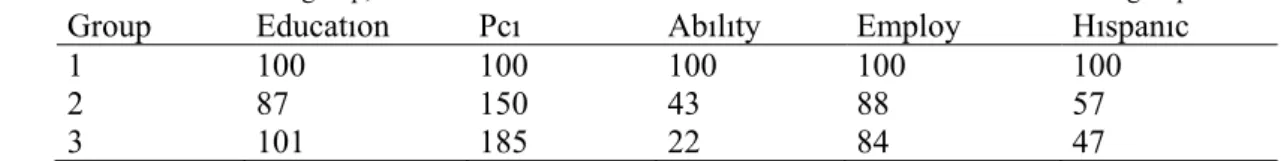
Large differences in means on some of the variables suggest that those variables are the potential discriminators. Between the first and the second group, the means do not differ as much as they do in the first and the third group. If the means of the variables in the first group have a value of 100, the means of the variables in the second and third group would be as in Table 3:
Table 3. Relative to the first group, standardized mean values of the variables in the second and the third groups.
Group Educatıon Pcı Abılıty Employ Hıspanıc 1 100 100 100 100 100
2 87 150 43 88 57
3 101 185 22 84 47
The three different groups used in this study are:
Group 1: Included the highest percentages of the foreign born.
Group 2: Contiguous group, included moderate percentages of the foreign-born. Group 3: Native groups, included average percentage of the foreign-born. Variables used in this study:
PCI : Per Capita Income in 1989
EDUCATION : Percent with high school education or less. EMPLOYMENT : Percent unemployed
ABILITY : Percent cannot speak English well or not at all. HISPANIC : Percent Hispanic origin
The two different analyses used in this study are:
1. The first analysis is the comparison between the "foreign-born areas" and the "contiguous areas" 2. The second analysis is the comparison between the "foreign-born areas" and the "native areas"
The classification tables (Table 6 and Table 9) suggest that the model was successful in predicting the group membership. In the comparison between the first and the second group, the model predicted 48 cases correctly out of 60. This classification means the independent variables are 80 percent effective in predicting the group membership. In the second comparison, the model predicted 85.48 percent of the variables correctly. In this case, although these percents show good results, it is easier to distinguish the first group from the third group than the second group. In both analyses, a random classification would yield a 50 percent chance for a case to be in either group. The prediction results are well above this.
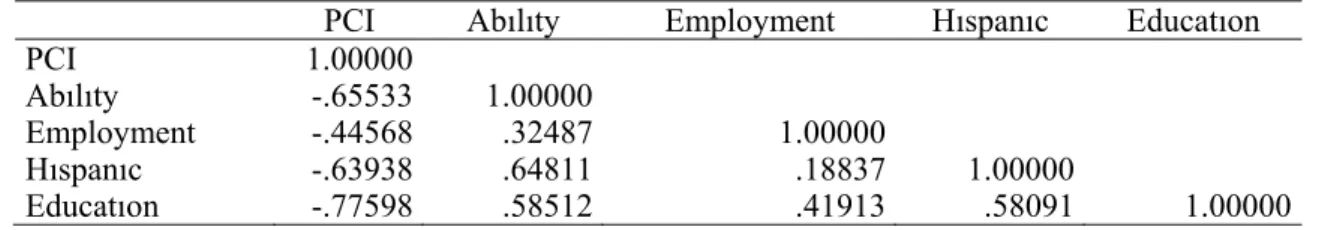
In the comparison between the first and the second group, the ability to speak English was the most valuable discriminator and had a negative relationship with the dependent variable. Income and
Hispanic origin followed the ability to speak English, respectively but had almost the same effect. Education, which is the percent of high school education or less, did not contribute a great deal. Employment status was a weak contributor in the analysis with a value of 80 percent smaller than that of the ability to speak English and 60 percent smaller than that of the Hispanic and income. Beside the ability to speak English, Hispanic origin, education, and employment status had a negative relationship with the dependent variable. However, education and employment status was not statistically significant (Table 4 and Table 5).
Table 4. Pooled within-groups correlation matrix in the first analysis between the "foreign-born areas" and the "contiguous
areas" to them.
PCI Abılıty Employment Hıspanıc Educatıon
PCI 1.00000
Abılıty -.65533 1.00000
Employment -.44568 .32487 1.00000
Hıspanıc -.63938 .64811 .18837 1.00000
Educatıon -.77598 .58512 .41913 .58091 1.00000
Table 5. Variables ordered by size of correlation within function in the first analysis.
Abılıty -.84862
PCI .66360 Hıspanıc -.60797 Educatıon -.26119 Employment -.18645
Table 6. Classification results in the first analysis.
Actual group Number of cases Predicted 1 Group membership 2
1 30 22 (73.3%) 8 (26.7%)
2 30 4 (13.3%) 26 (86.7%)
Percent of grouped cases correctly classified: 80.00%
In the second comparison, between the first and the third groups, the ability to speak English again was the most influential factor. However, the order of the other characteristics is changed a little. Percent Hispanic origin was the second most influential characteristic instead of income. This time the Hispanic origin, compared to the first analysis, lost its explanatory power because in the third group the average percent of the population of Hispanic origin was high, almost 22 percent, but most of them were native-born. Because of the native-born Hispanics, their characteristics did not differ greatly from the other native born. Unlike the first analysis, education had the least influence on discriminating between the groups. Employment again was insignificant (Table 7 and Table 8).
Table 7. Pooled within-groups correlation matrix in the second analysis.
PCI Abılıty Employment Hıspanıc Educatıon
PCI 1.00000
Abılıty -.13053 1.00000
Employment -.45978 .16694 1.00000
Hıspanıc -.33917 .69338 .18719 1.00000
Table 8. Variables ordered by size of correlation within function in the second analysis Abılıty -.76304 Hıspanıc -.43087 PCI .29400 Employment -.13202 Educa Tıon -.01088
Table 9. Classification results in the second analysis.
Actual group Number of cases Predicted 1 Group membership 2
1 30 24 (80.0%) 6 (20.0%)
2 32 3 (9.45%) 29 (90.6%)
Percent of grouped cases correctly classified: 85.48%
8. Conclusion and Further Research
Texas is one of the most popular destinations for international immigrants in the U.S. The migration is expected to alter distinctly the ethnic make- up of the American people. Because of the international migration, both the immigrants and the established residents are concerned with the adaptation to the increasing diversity in their communities. The migration patterns affect a group's levels of spatial concentration, assimilation process, and the political power. This study showed in terms of which characteristics the foreign-born population differ from native population in Texas.
In discriminating among the three groups, the ability to speak English was the most influential variable. Income played a significant role in distinguishing the areas as well. Hispanic origin was a good discriminator between the first and the second group, but insignificant between the first and the third groups because of the native-born Hispanic origin people. Education was effective in separating the first group from the second and third group, but did not play a role in separating the second group from the third group. Employment status was insignificant in distinguishing any of the three areas from each other.
In conclusion, the areas of foreign-born concentration were different from the native areas with their lower income, lower educational levels, lower percents of people with the ability to speak English, higher percents of population with Hispanic origin, and slightly higher unemployment rates.
Because the census does not have all types of data available at the block group level, it is difficult sometimes to work with these data. STF3A does not have a search option. The lack of a search option made it troublesome to determine the areas with highest percents of the foreign-born. In particular, It was impossible to find block groups with the highest percents of non-Mexican origin foreign born, the particular classification this study hoped to analyze.
Even though the findings of this research suggest that the foreign-born population can be distinguished from the native population, sometimes it is difficult to separate these areas because of the bi-model data. Where more than 5 percent of the foreign-born people speak Indic, per capita income tends to be higher, the percents of people who cannot speak English tend to be low, and educational levels tend to be better. This result is relatively true for areas of German and Chinese concentrations as well. On the other hand, where Spanish is the only language spoken at home, per capita income tends to be lower, the percent of people cannot speak English tends to be higher, and percents of the poorly educated population tend to be higher than other areas.
Knowing this fact, the logical next step of this research would be doing a similar study with primary or individual-level data. This type of study allows comparison between areas with peoples of different origins, and the assimilation of these peoples. Previous literature suggests that it is almost impossible to study the assimilation process without primary data, from specially designed surveys. Many block groups in Texas include high percents of people with Hispanic origin. It would be
interesting to choose a control group among the block groups that do not have high percents of foreign-born. Then one can compare the characteristics of the foreign-born to the Euro-Americans in Texas. It also would be interesting to study the change in the areas of foreign-born concentration, and their characteristics over time. Either the 1980 census or the 2000 census could be used for this type of longitudinal study.
Acknowledgement
I would like to thank Prof. Dr. Fred Day and Prof. Dr. Lawrence Estaville of Southwest Texas State University for their encouragement and support during this research. I am also grateful for the helpful suggestions of the referee of the Turkish Journal of Geographical Sciences.
References
Allen, J. P., Turner, E. (1996) “Spatial patterns of immigrant assimilation”, The Professional Geographer, 48: 140-156. Alvirez, D., Bean. F. D. (1976) The Mexican-American family, In Haberstein, R.B and Mindel, C. (Ed.), Ethnic Families in
America, Elsevier, New York.
Bean, F. D. (1982) Estimates of the number of illegal migrants in the State of Texas, Texas Population Research Center Paper, No: 4.001, Austin.
Bean, F. D., Browning, H. L., and Frisbie, W. P. (1984) “The sociodemographic characteristics of immigrant status groups: Implication for studying undocumented migrants”, International Migration Review, 18: 673-691.
Bean, F. D., Espanshade, T. J., White, M. J., and Dymowski, R. F (1990) Post IRCA changes in the volume and the composition of undocumented migration to the U.S., An assessment based on apprehensions data, In Edmonston, B and Passel, J. S (Ed.), Undocumented Migration to the U.S.: IRCA and the Experience of 1980s, the Urban Institute Press, Washington D.C.
Blejer, M. I., Johnson, H. G. and Projecanski, A. C. (1978) “An analysis of the economic determinants of legal and illegal Mexican migration to the United States”, Research in Population Economics, 1: 217-231.
Bouvier, L. F, Gardner, R. W. (1986) “Immigration to the United States: The unfinished story”, Population Bulletin, 41: 4. Bradshaw, B. S., Bean. F. D. (1972) Some aspects of the fertility of Mexican Americans, Demographic and Social Aspects of
Population Growth. The Commission on Population Growth and the American Future, 1, Washington D.C.
Browning, H. L. (1968) Population on Mobility: Focus on Texas. Bureau of Business Research. University of Texas at Austin, Austin.
Bureau of the Census. (1992) Projections of the population of the United States, by age, sex, and race: 1983 to 2050, Current Population Reports Series, No: 952.
Conroy, M. E. (1985) Socio-economic incentives for migration from Mexico to U.S. Cross regional profiles, 1969-78, Paper presented at the annual meeting of the Population Association of America, 11 April, Denver.
Day, F. A. Professor of Geography (1996) Interview by author, 3 August, Southwest Texas State University, San Marcos, Texas.
Fleisher, B. M. (1963) “Some economic aspects of Puerto Rican migration to the United States” Review of Economics and Statistics, 45: 2245-2253.
Fossett, M. A. (1982) Inequality and the relative size of minority populations: an examination of Anglo-Hispanic income inequality in the Metropolitan Southwest, Texas Population Research Center, Paper no: 4.018, Austin.
Funkhouser, E. (1992) Mass emigration, remittances, and economic adjustment: the case of El Salvador in the 1980s, In Borjas, G. J and. Freemand, R.B (Ed.), Immigration and the Work Force: Economic Consequences for the U.S. and Source Areas, University of Chicago Press, Chicago.
Jordan, T. G. (1980) Immigration to Texas, American Press, Boston.
Jordan, T. G., Bean, J. L. Jr., and. Holmes W. M. (1984) Texas: A geography, Westview Press, Colorado.
Kelly, C. B. (1979) Immigration policies of the United States of America, In Kubat, D (Ed.), The Politics of Immigration Policies, The Center for Migration Studies of New York, New York.
Latour, A. (1996) “How curbing immigration could hurt health care in inner cities, rural areas”, The Wall Street Journal, Tuesday, March 5, 6 (B).
Martin, P., Midgley, E (1994) “Immigration to the United States: Journey to an uncertain destination”, Population Bulletin, 49: 2
Massey, D. S. (1995) “The new immigration and ethnicity in the United States”, Population and Development Review, 21: 317-335.
Massey, D. S., et al. (1993) “Theories of international migration: A review and appraisal”, Population and Development Review, 19: 431- 461
Massey, D. S., et al. (1994) “An evaluation of International Migration Theory: the North American case”, Population and Development Review, 20: 699-751.
Ogden, P. E. (1984) Migration and Geographical Change, Cambridge University Press, Cambridge.
Passel, J. S. (1985) “Undocumented immigrants: how many?” In Proceedings of the Social Statistics Section, American Statistics Association, Washington D.C.
Rodriguez, N. P. (1987) “Undocumented Central Americans in Houston: diverse populations”, International Migration Review, 21: 1.
Sharp, J. (1993) Forces of Change: Shaping the Future of Texas, Texas Comptroller of Public Accounts, 2: 1, Austin. Weeks, J. R., Chande, R. H. (Eds.) (1992) Demographic Dynamics of the U.S- Mexican Border, Western Press, El Paso,