T.C.
SELÇUK UNIVERSITY
THE GRADUATE SCHOOL OF NATURAL AND APPLIED SCIENCES
MODELLING OF ATMOSPHERIC SO2 POLLUTION IN SEYDĠġEHĠR TOWN BY
ARTIFICIAL NEURAL NETWORKS
Zeynep Cansu ÖZTÜRK MASTER OF SCIENCE
Environmental Engineering Department
December-2015 KONYA All rights reserved
DECLARATION PAGE
I hereby declare that all information in this document has been obtained and presented in accordance with academic rules and ethical conduct. I also declare that, as required by these rules and conduct, I have fully cited and referenced all material and results that are not original to this work.
TEZ BİLDİRİMİ
Bu tezdeki bütün bilgilerin etik davranış ve akademik kurallar çerçevesinde elde edildiğini ve tez yazım kurallarına uygun olarak hazırlanan bu çalışmada bana ait olmayan her türlü ifade ve bilginin kaynağına eksiksiz atıf yapıldığını bildiririm.
Zeynep Cansu ÖZTÜRK Tarih: 22/12/2015
iv
ABSTRACT
M. Sc. THESIS
MODELLING OF ATMOSPHERIC SO2 POLLUTION IN SEYDĠġEHĠR TOWN BY ARTIFICIAL NEURAL NETWORKS
Zeynep Cansu ÖZTÜRK
THE GRADUATE SCHOOL OF NATURAL AND APPLIED SCIENCE OF SELÇUK UNIVERSITY
THE DEGREE OF MASTER OF SCIENCE IN ENVIRONMENTAL ENGINEERING
Advisor: Assoc. Prof. Dr. ġükrü DURSUN 2015, 61 Pages
Jury
Prof. Dr. Ali TOR
Assoc. Prof. Dr. ġükrü DURSUN Assoc. Prof. Dr. Dünyamin GÜÇLÜ
Air pollution has become a major environmental problem since last century because of the effects of fast population growth and industrial developments. Sulphur dioxide is considered as one of the major and most common air pollutant with using fossil fuels causing severe health problems such as disrupting tissues and mucous membranes of the eyes, disturbing nose and throat because of the irritating toxic odour, and affecting badly to upper part of respiratory system and bronchi. Seydişehir town of Konya was selected as working area for this study because heavy industrial activities are very wide in many fields such as mining and manufacturing industry. Also, usage of fossil fuels for heating system in winter period is other important atmospheric pollutants source. Eti Aluminium facility is the biggest industrial unite for SO2 pollution source in Seydişehir town. In this study, SO2 pollution in Seydişehir town was modelled with Artificial Neural Networks (ANN) which uses characteristics of biological neurons and capable of solving highly complex problems constructing parallel computations. Meteorological factors and previous day‘s SO2 concentrations were integrated to model as input parameters and next day‘s SO2 concentration was tried to be predicted. Two seasons were selected for model development namely winter and summer. Prediction performances of develop models are 67% for winter season and 81% for summer season. These values are compatible compared with previous studies using ANN modelling and can be improved with larger data sets.
v
ÖZET
YÜKSEK LĠSANS TEZĠ
SEYDĠġEHĠR ĠLÇESĠ ATMOSFERĠK SO2 KĠRLĠLĠĞĠNĠN YAPAY SĠNĠR AĞLARI ĠLE MODELLENMESĠ
Zeynep Cansu ÖZTÜRK
Selçuk Üniversitesi Fen Bilimleri Enstitüsü Çevre Mühendisliği Anabilim Dalı DanıĢman: Doç. Dr. ġükrü DURSUN
2015, 61 Sayfa
Jüri
Prof. Dr. Ali TOR Doç. Dr. ġükrü DURSUN Doç. Dr. Dünyamin GÜÇLÜ
Hava kirliliği, hızlı nüfus artışı ve endüstrinin gelişmesiyle birlikte geçen yüzyıldan buyana problem olmaya devam etmektedir. Kükürtdioksit fosil yakıt kullanımıyla birlikte ciddi sağlık sorunlarına neden olan önemli gazlardan biri olarak nitelendirilir. Bu sağlık sorunları arasında dokuların ve gözlerdeki mukus tabakasının zarar görmesi, rahatsız edici kokusu nedeniyle kulak ve burunda oluşan rahatsızlıklar ve üst solunum yolları ve akciğer problemleri sayılabilir. Bu tezde çalışma yeri olarak Konya‘nın bir ilçesi olan Seydişehir seçilmiştir. Bölgede endüstrinin bir çok farklı alanda gelişmiş olması örneğin madencilik ve üretim sektörleri, hava kirliliğine katkıda bulunan faktörler arasındadır. Bunun yanı sıra ısınma amaçlı fosil yakıtların kullanılması da bölgedeki hava kirliliğini olumsuz etkilemektedir. Özellikle Türkiye‘nin en büyük alüminyum tesisi olan Eti Alüminyum Fabrikası da SO2 kirliliğine katkıda bulunmaktadır. Bu tez çalışmasında Seydişehir İlçesindeki SO2 kirliliği yapay sinir ağları (YSA) ile modellenmiştir. YSA biyolojik nöronların karakteristik özelliklerini kullanır ve parallel bağ kurabilme yeteneği sayesinde kompleks problemleri çözüme ulaştırır. Meterolojik faktörler ve bir gün öncesine ait SO2 değerleri modele girdi parametreleri olarak entegre edilmiş, bir gün sonra salınacak SO2 konsantrasyonları tahmin edilmiştir. Model geliştirilirken yaz ve kış olarak iki mevsim dikkate alınmıştır.Geliştirilen modellerin tahmin performansları kış mevsimi için %67, yaz mevsimi için %81 çıkmıştır. YSA ile yapılan önceki çalışmalara bakıldığında bu sonuçlar tatmin edicidir fakat daha büyük veri setleri kullanılarak, geliştirilen modellerin tahmin yetenekleri arttırılabilir.
vi
PREFACE
I would like to express my deepest gratitude and appreciation to my supervisor Assoc. Prof. Dr. Şükrü Dursun for his excellent guidance, attitude and patience. The trust that he put on me always kept me confident and motivated. I feel very lucky to have a supervisor whom I see as my mentor. Also, I want to thank to Dr. Fatma Kunt for her support and valuable information during preparation of my thesis and her friendship.
Kiraz Kök should be mentioned in here for her kind help during measurements of pollution data which is the vital part of this thesis. I would like to thank to her for supporting me preparing my study.
General Directorate of Meteorology supported this thesis by providing meteorological data is greatly acknowledged. Moreover, I want to thank to Selçuk University BAP for their financial support with project no of 15101016.
I thank sincerely to my close friends Merve Soğancıoğlu and Hamza Aysan for their support and help. Also, I want to thank my dear friend Akın Y. Ayturan for his helps on MATLAB and all my lovely friends whose give me motivation.
My parents Mustafa and Melek Öztürk deserve very special thanks, as they have been supportive in every step of my education. I also thank to my brother Murat and his lovely wife Nilüfer for their support. Of course my special thanks go to my dear sister Göksu for her endless energy and joy which give me all the time.
Zeynep Cansu ÖZTÜRK
vii
TABLE OF CONTENTS
ABSTRACT ... iv
ÖZET ...v
PREFACE... vi
TABLE OF CONTENTS ... vii
SYMBOLS AND ABBREVIATIONS ... iv
1. INTRODUCTION ...1
2. LITERATURE REVIEW ...4
2.1. Air Pollution ...4
2.1.1. History of Air Pollution...4
2.1.2. Sources of Air Pollution ...5
2.1.3. Main Air Pollutants ...6
2.1.4. Effects of Air Pollutants ... 10
2.2. Artificial Intelligence ... 13
2.2.1. Artificial Intelligence and Engineering ... 13
2.3. Previous studies using ANN for air pollution modelling... 22
3. MATERIAL AND METHOD ... 25
3.1. Working Area ... 25
3.1.1. Climate of working area ... 26
3.1.2. Geographical situation of working area ... 30
3.1.3. Air pollution sources of working area ... 31
3.2. Data gathering ... 31
3.2.1. SO2 gas analyser device ... 31
3.2.2. Provision of meteorological data ... 36
3.3. Data analysis... 36
3.4. Modelling with artificial neural network ... 38
3.4.1. Modelling with winter data ... 40
3.4.2. Modelling with summer data ... 42
4. RESEARCH RESULTS ... 44
4.1. Results of winter model ... 44
4.2. Results of summer model ... 45
4.3. Evaluation of the effects of input parameters to SO2 pollution ... 49
5. DISCUSSION ... 52
6. CONCLUSION AND SUGGESTIONS ... 55
REFERENCES ... 57
iv
SYMBOLS AND ABBREVIATIONS
AI : Artificial Intelligence
AMOS : Automatic Meteorological Observation Station ANFIS : Adaptive Neuro-Fuzzy Inference System ANN : Artificial Neural Network
As : Arsenic BP : Back Propagation C6H6 : Benzene Cd : Cadmium CFCs : Chlorofluorocarbons CO : Carbon monoxide CO2 : Carbon dioxide dm3 : cubic decimetre E : East
EPA : Environmental Protection Agency of United States H2O : Water H2S : Hydrogen sulphide H2SO3: Sulphurous acid H2SO4: Sulphuric acid HCl : Hydrogen chloride HCs : Hydrocarbons HF : Hydrogen fluoride Hg : Mercury
HNO3 : Nitric acid
hv : Energy of the photon
IARC : International Agency for Research Cancer km : kilometre
kW/m2 : kilowatt per meter square L : litre
m/sec : meter per second m2 : meter square mb : millibars mm : millimetres
MSE : Mean Square Error N : North
N2 : Nitrogen N2O : Nitrous oxide NH3 : Ammonia NH4 : Ammonium nm : nanometre NN : Neural Network NO : Nitrogen monoxide NO2 : Nitrogen dioxide NO3 : Nitrate
NOx : Nitrogen oxides O2 : Oxygen
O3 : Ozone o
C : Celsius degree OH : Hydroxyl
v Pb : Lead
PM : Particulate Matter PMT : Photo Multiplier Tube ppb : part per billion
ppm : part per million
R : Correlation coefficient R2 : Coefficient of determination S : South
SO2 : Sulphur dioxide SO3 : Sulphur trioxide SO42- : Sulphate
UV : Ultraviolet
VOC : Volatile Organic Compound W : West
1. INTRODUCTION
Air pollution and its effects have become global issues since middle of 19s. Air pollution is transported to long distances with air movements and has global effects. The major concerns should be cautious that greenhouse effect major cause of global warming and depletion of ozone layer with effect of many primary and secondary pollutants (Zannetti 1990). Major primary air pollutants which are contaminants causing some adverse effects on environment are particulate matter (PM), sulphur compounds (e.g., SO2, H2S), nitrogen compounds (e.g., NO, NH3), carbon compounds (e.g., HCs, CO, CO2), halogen compounds (e.g., fluorides, bromides, chlorides) (Zannetti 1990). Moreover, chemical reactions happening in the atmosphere causes the transformation of primary pollutants to secondary ones, for example, SO2 gas transforms to SO4 2-(Zannetti 1990).
Sulphur dioxide emissions are considered as one of the major and most common air pollution problem in the world. SO2 emissions are responsible from London winter-type smog event and other many lethal smog events. Because of acid deposition problem, water bodies and animal life is also affected from SO2 gas. Main anthropogenic sources of SO2 are fuel combustion, petroleum, mining, industrial processes like paper production (Zannetti 1990).
In Turkey with the development of the industry and population growth air pollution has started to become a problem since beginning of 1980s. Seydişehir is a town of Konya which is one of the biggest cities of Turkey. In Seydişehir industrial activities are very wide in many fields such as mining and manufacturing industry. Especially mining has significant importance because of the minerals, bauxite, chromium and lignite, extracting from the area. Both extraction and manufacturing steps of minerals produce huge amount of emissions. Moreover, other manufacturing industries like chemical production, agricultural material production, and food production emits SO2 gas to the atmosphere (URL 1). Also, fossil fuel combustion from residential buildings and other institutions for heating purposes largely contributes to SO2 pollution in Seydişehir.
Eti Aluminium Facility is the biggest metal production and the only aluminium manufacturing facility of Turkey. It was constructed in closed area of 12,000,000 m²
(URL 2). During aluminium production Sulphur in the anodes is oxidized, releasing SO2 from the potlines which is a row of electrolytic cells used in the production of aluminium as the anodes are consumed. SO2 is also released from the anode bake furnace as pitch used to help form the anodes are oxidized during the baking process (URL 3). As a result of this anode process during aluminium production, Eti Aluminium facility contributes SO2 pollution in Seydişehir town.
All of these sources of SO2 in Seydişehir make it a problem for town. SO2 is not lethal in all concentrations but it decreases life quality for human in many manners such as giving harm to tissues and mucous membranes of the eyes, disturbing nose and throat because of the irritating odour, and affecting badly to upper part of respiratory system and bronchi (Hussainn 2011). Also, it affects the animal life, vegetation and environment badly. All these negative effects of SO2 pollution are considerable.
Nowadays prediction of air pollutants is increasing trend because with the help of future prediction of air pollutants establishing emission control legislations, evaluating the future emission control impacts, selecting possible locations in which it can be possible source of air pollutants, controlling air pollutant episodes and taking preventive precautions, and assessing present air pollutant sources and their responsibility in future events may be achieved (Zannetti 1990). In this study a model was established in order to predict SO2 pollution in Seydişehir town. There are many techniques used for prediction modelling such as statistical models, neural networks, fuzzy logic. Artificial neural network (ANN) was used for this study and MATLAB (R2011a) software was used for ANN development.
ANNs are structures which consist of interconnected simple adaptive elements having ability to make parallel computations for processing and representation of knowledge (Basheer and Hajmeer 2000). It has many advantages when it‘s compared with traditional models because these models only require known input data without any assumption (Gardner and Dorling 1998). With the help of suitable connecting weights and transfer functions, approximation of a multilayer function can be measurable function between input and output (Hornik et al. 1989, Gardner and Dorling 1998). Most of the parallel structured ANN models include intense interconnected adaptive
units. ANN models have very significant characteristic that highly nonlinear problems may be solved (Zurada 1997).
Back propagation (BP) feedforward algorithm used for training the multilayer neural networks is the most famous learning algorithm used in ANN models (Basheer and Hajmeer 2000). In this study Multilayer Feedforward Neural Network including input layer, hidden layer and final layer consisting of neurons was used.
Meteorological parameters which are hourly average temperature (oC), hourly average pressure (bar), hourly relative humidity (%), hourly wind speed (m/sec), hourly rainfall (mm), hourly cloudiness, hourly sun duration, hourly sun radiation (kW/m2) and previous day‘s hourly SO2 pollution concentration (ppb) was integrated to model as input parameters and next day‘s SO2 concentration was tried to be predicted. SO2 data used in this model was gathered between 2012-2013 years just on particular months by M100E UV Fluorescence SO2 Analyser device and meteorological data measured with automatic meteorological observation station (AMOS) was provided from General Directorate of Meteorology. Gathered data was separated to two datasets namely, winter and summer and one model was developed for each.
Next section of thesis literature was reviewed and previous studies with similar content were investigated. Detailed information related data gathering and model development is given in Section 3. Last sections include information related to research results.
2. LITERATURE REVIEW
2.1. Air Pollution
Air pollution is waste remaining from the ways humans produce their goods, transport themselves and their goods, and generate energy to heat and light the places they live (Vesilind et.al 2010). The amount of gaseous and particulate materials in the air which harms to the living organisms increases because majorly of the combustion of fossil fuels. Impurities in the fuel, poor air-to-fuel ratio, too high and low combustion temperatures lead to pollutants (Boubel et.al 1994).
2.1.1. History of Air Pollution
In early history air pollution firstly became a problem in 1157 because of the burning of the wood in Tutbury Castle in Nottingham. In 1273 coal burning is prohibited in London. After this prohibition, in 1306 sea coal started to be used in furnaces according to the proclamation of King Edward I. In between 1377 and 1399 years Richard II and between 1413 and 1422 years Henry V took steps to regulate the use of coal in England. King Charles II was published a booklet related to air pollution in 1661. After industrial revolution which was a consequence of the power production using steam to move machinery and pump water, coal combustion increased in order to provide necessary boiled steam for steam engines (Boubel et.al 1994). The main pollutants of coal combustion process were smoke and ash in nineteenth century. Reduction of these pollutants was considered as a health issue by first Public Act of 1848. In United States the first regulations related to smoke and ash were prepared im1880s considering reduction of the pollutants from industry, locomotives and domestic sources. Moreover, the first technological developments against air pollution were seen in nineteenth century. Scrubbers for removing acid gases from effluent gas streams, cyclones and bag house collectors were designed for collection of big size particulate matters (Boubel et.al 1994).
In first part of the twentieth century there were great changes in technology. The replacement of steam engine with electric motor was the most important development. Also, very effective air pollution control device, electrostatic precipitator was invented.
However, there were no significant changes related to the legislation, regulation and understanding of the problem. During period between 1925 and 1950 the present air pollution problems and their solutions were started to be investigated. In this period there were episodes causing death of thousands of people. The technical foundation for searching air pollutants and meteorological events was established. The major technological change during that period was the construction of natural gas pipelines. This reduced the amount of coal combustion emissions and improved air quality. Also, diesel locomotives were started to be used instead of steam locomotives (Boubel et.al 1994).
After 1950s both in European countries and United States some precautions had taken related to air pollution and within company of many countries first air pollution control act was signed. Also, national air pollution research centers opened in different countries by 1980. The importance of meteorology was understood and first mathematical models of the pollution of the atmosphere began to be developed. In the United States Clean Air Act Amendments was accepted in 1990 thus the importance of stratospheric ozone depletion and global climate changes was accepted (Boubel et.al 1994).
2.1.2. Sources of Air Pollution
Sources of air pollution are separated as natural and anthropogenic. Natural air pollution sources are volcanic eruptions, forest fires, dust storms, the oceans, plants and trees of the earth. Volcanic eruptions produces huge amount of particulate matter and other pollutant gases like SO2, H2S, and methane. These gases and particulate matter stay in the air very long time. Forest fires are another main source of natural air pollution. Because of the uncontrolled forest fire, smoke, hydrocarbons, carbon dioxide, carbon monoxide, nitrous oxides, and ash are emitted with large amounts. Dust storms are the main source of particulate matter pollution which can cause problems to the householders, industry and mobile transporters. Oceans also create air pollution problem since they emits salt form aerosols to the atmosphere that materials lead to corrosion problems. The effect of wave on shells and the surface of rocks erode them to sand particles and make them airborne particulate matter. Moreover, the green plants and trees are major source of hydrocarbons (Boubel et.al 1994).
Anthropogenic sources of air pollution are classified as the industrial sources, utilities, and personal sources. The main source of industrial air pollution originates from raw materials in manufacturing processes. For example, during mining activity dust and SO2 emissions, during briquetting & coking of coal dust, gases and impurities of coal, during metal smelting SO2 and various volatile metals such as Hg, As, Pb, Cd, and from chemical industry HCl, HF, H2S, NOx, NH3, HCs, VOC are emitted. Utilities are the important source of anthropogenic air pollution because most of them produce electricity by converting energy. This procedure emits huge amount of carbon dioxide, nitrous and sulphur oxides to the atmosphere. Moreover, personal sources such as mobile vehicles, furnaces and stoves in homes, barbeque grills, and burning of leaves in open area contribute to anthropogenic air pollution (Boubel et.al 1994).
2.1.3. Main Air Pollutants
2.1.3.1. Particulate Matter
Particulate matter (PM) which is also known as particulate pollution composed of very small particles and droplets of liquid. Many constitutions such as acids of sulphide and nitrate, organic compounds, metals and dust particles produce particulate pollution. Moreover, particle size is important factor affecting the health of all living creatures. Especially particles equal or smaller than 10 micron are very important for investigators and they has to be removed since these particles can pass through the nose and throat and affect the lungs and heart. This can lead to very serious health problems (URL 4).
Particulate matters or pollutants are classified in two categories according to Environmental Protection Agency of United States (EPA). These are named as inhalable coarse particles and fine particles. The diameter of inhalable course particles is bigger than 2.5 microns and smaller than 10 microns. Fine particles have diameter smaller than 2.5 microns. These particles are found in the atmosphere as a form of smoke and haze and emitted directly form forest fires and power plants (URL 4).
2.1.3.2. Sulphur-containing compounds
The most important sulphur containing gases in the atmosphere consist of sulphur dioxide (SO2), sulphur trioxide (SO3) and hydrogen sulphide (H2S). Along with these gases, sulphuric acid (H2SO4) and sulphate (SO4=) salts are found in the atmosphere as sulphur compounds (Kırımhan 2006). The first group of gases constitutes primary pollutants and the second ones are named as secondary pollutants which are somehow produced from primary ones (Vesilind 1975).
Sources of sulphur containing compounds are combustion of fossil fuels, combustion and decomposition of organic materials, volcanic eruptions, and interference of sulphate salts with atmosphere from oceans by powerful winds and emission of sulphuric compounds because of mining activities. Sulphuric compounds emitted by these sources can return back to the earth surface with wet or dry deposition (Kırımhan 2006). Moreover, sulphuric compounds in the atmosphere are oxidized by atomic oxygen, oxygen and ozone and they can produce new compounds as a result of interaction with some materials by photochemical and chemical process. Because of this transformation, pollutants emitted from different sources enter continuous cycle with air, water and soil (Kırımhan 2006).
Importance of SO2 is higher than the other sulphur containing compounds for air pollution because SO2 amount in the atmosphere is always associated with the public health. Besides, SO2 is evaluated with particulate matters and together with PM produces air pollution index causing health issues. SO2 creates respiratory problems and especially lethal for lung failure and respiratory insufficiency patients (Müezzinoğlu 1987).
According to national ambient air quality standards of EPA that are prepared for pollutants harmful for public health and environment, SO2 amount in the atmosphere should be smaller than 75 ppb hourly as a primary pollutant and it should be less than 0.5 ppm hourly as a secondary pollutant (URL 5).
Ambient Air Quality Standards of Turkey is given in the Regulation on Air Quality Assessment and Management. In the Annex 1 of this regulation Ambient Air Quality
Standards of Turkey are listed clearly. The main purpose of these standards is reaching the long term targets on the determined date and not exceeding the determined limit values. In order to reach this goal, governments use air pollution control mechanisms and try to decrease the limits for the further years. Regulation consists of SO2, NO2, N0x, PM10, Pb, C6H6, CO, O3 together with Arsenic, Cadmium, Nickel and Benzo(a)pyrene measurements, limit values and assessment methods. According to this regulation, hourly SO2 amounts in Turkey should be less than 900 µg/m3 (URL 6).
2.3.2.1. Sulphur Dioxide (SO2)
SO2 is a member of high reactive group of gases which are named as Sulphur oxides. 66% of SO2 emissions are originating from fossil fuel combustion in power plants and 29% of these emissions are coming from other industrial processes, for example, metal extracting, and burning of substances including high sulphur content. The bonds in the structure of SO2 molecule are covalent and it is a planar molecule with 120o angel and v-shaped. In Figure 2.1 molecular structure of SO2 is seen (Hussain 2011).
Figure 2.1 Molecular Structure of SO2 (Hussain 2011)
SO2 gas is colourless and two times heavier than air. It has suffocating and pungent characteristics when it is burned. The melting point -72.7 oC, boiling point -10 oC, and relative density of SO2 gas is 1.43. SO2 gas also has high solubility in water at 0 oC 1 L of water can dissolve 80 dm3 of SO2 gas (Hussain 2011).
In order to form SO2 gas, burning reaction of sulphur should occur shown in below.
S + O2 SO2 (Equation 2.1)
It can also be produced in laboratory by heating of copper pieces with sulphuric acid or reaction of sulphuric acid with concentrated hydrogen sulphide (Hussain 2011).
When it is in moisture environment, it makes reaction with water as a reducing agent and produce sulphurous acid (H2SO3) which is reduced in two ways such as addition of nascent hydrogen and removal of oxygen atom. Final molecule produced from these reduction reactions of sulphurous acid is sulphuric acid (H2SO4) (Hussain 2011).
The reactions of SO2 with atmosphere are very complex and many different aspects like wind speed, cloudiness, rainfall and temperature affect this relationship (Dursun 1994).
2.1.3.3. Nitrogen-containing compounds
Nitrogenous compounds include gases like nitric oxide (NO), nitrogen dioxide (NO2), nitrous oxide (N2O), ammonia (NH3) and salts like nitrate (NO3) and ammonium (NH4) (Kırımhan 2006). Nitrous oxide is colourless compound and emitted from natural sources. It is made up of bacteriological activity and reaction of nitrogen (N2) with oxygen and ozone. Nitric oxide (NO) is formed by both natural events and anthropogenic activities. Especially combustion of fossil fuels huge amount of nitric oxide is emitted and nitrogen dioxide (NO2) is emitted with nitric oxide because when NO contacts with oxygen in the air, it produces NO2. These two gases are very important pollutants (Kırımhan 2006).
Furthermore, chemical alteration of these gases in the atmosphere produces nitrate and ammonia salts which return to the earth surface by wet and dry deposition. NOx species cause the formation of acid rains (Kırımhan 2006).
2.1.3.4. Other Pollutants
Other pollutants that could be considered as important can be listed as carbon monoxide (CO) which is colourless, odourless, non-irritating but very poisonous gas, carbon dioxide emitted from combustion, volatile organic compounds (VOC) which are vapours and solvents of hydrocarbon fuels, chlorofluorocarbons (CFCs) emitted from products currently banned from used, radioactive pollutants produced by nuclear explosions, war explosives, and natural processes such as the radioactive decaying of radon, and odours from garbage, sewage, and industrial processes (Vesilind 2010).
2.1.4. Effects of Air Pollutants
Air pollutants have adverse effects on human health and welfare, vegetation and animals, materials and structure, and atmosphere, soil and water bodies (Boubel et.al 1994) The information related to health effects of air pollutants come from three different research paths named as epidemiological, clinical and toxicological. Mostly these effects occur in respiratory, circulatory, and olfactory systems. Air pollutants enter to the human body directly by respiratory systems and cause the alteration in the function of lungs. The main air pollutants and their effects on human health can be sort as CO leads to problems in circulation of oxygen in the body, NO2 makes respiratory system more susceptible to pathogens, O3 causes asthma attacks, SO2 and particulate matters rise the acute respiratory disease problems (Boubel et.al 1994). The detailed information about effects of SO2 in human health is given in next sections.
Moreover, air pollutants affect vegetation in two ways which are visible and nonvisible symptoms seen on the plants. Visible ones include collapse of tissue and colour loss while nonvisible ones cause reduction of plant growth and physiological and biochemical process alteration. Animals are affected from air pollution with respect to the acidification process in water bodies or heavy metal deposition in various environments in which animals are lived (Boubel et.al 1994).
Oher significant effect of air pollutants is on the materials and structures. Especially stone, metals, fabrics and dye, leather, paper, pain and glass, rubber are main materials affected from air pollutants. Air pollution increases the rate of corrosion on metals, causes deformation on the stone parts of buildings because of acid gases, causes loss in tensile strength on fabrics, and decomposes composition of the leather by SO2 absorption (Boubel et.al 1994).
Also, the effects of air pollutants to atmosphere, soil and water bodies have great importance. The visibility problems and acid deposition because of the formation of H2SO4 and HNO3 by the contact of SO2 and NO3 gases with water bodies are the main problems could be seen in these environments (Boubel et.al 1994).
2.1.4.1. Effects of SO2
Effects of SO2 depend on gas amount emitted by volcano eruption, atmospheric layer in which the gas is found, wind and weather conditions affecting transportation of the gas. Mostly known effects of SO2 are it may give harm to tissues and mucous membranes of the eyes, nose and throat because of the irritating odour and the upper part of respiratory system and bronchi are seriously influenced by SO2 gas. In addition to these main effects, SO2 has negative impacts on human health, vegetation and animals, and environment (Hussain 2011).
2.1.4.1.1. Effects of SO2 on Human Health
Health effects of SO2 gas is changing according to the dose and the exposure time. If exposure time is short and dose is high, there could be problem threatening life for people who already have lung disease. If exposure time is long and dose is high, diseases such as chronic bronchitis, emphysema, and respiratory illness could be formed (Hussain 2011). Moreover, sulphur dioxide gas may react with chemicals and particulates in the air and produce sulphate particles that cause respiratory illness and breathing problems by accumulating in the lungs (Hussain 2011). Fertility decreases in men and women for long term exposure of industrial SO2 gas. People who have diseases like asthma, heart or lung problems are more sensitive to SO2 gas than other people. Whether there is a relationship between cancer and SO2 gas but some studies done in animals show that SO2 gas may produce cancer on mice but according to classification of International Agency for Research Cancer (IARC), SO2 gas has not capable to make cancer on humans (Hussain 2011).
2.1.4.1.2. Effects of SO2 on Vegetation and Animals
Effects of SO2 on leaves mainly occur with penetration into stomata and injury depends on uptake rate of SO2. Also, severity of the injury depends on resistance of the leaves. SO2 with high concentrations and short exposure can create acute problems in the plants while the long term exposure of low concentrations can be much more problematic. As a result of that kind of exposure, chronic injuries occur in the plants such as decrease in growth and yield, increase in senescence, and colour problems (Hussain 2011).
Moreover, lichens and bryophytes are affected from SO2 gas largely while they are in metabolically active and moist condition. Decrease in nitrogen fixation ability, increase in membrane leakiness, destruction in photosynthetic pigment and activities are the main effects of SO2 gas on lichens and bryophytes (Hussain 2011).
Furthermore, acid mists another important problem occurs on the plants, especially on forests. SO2 gas is one of the main pollutants that are capable of producing acid mist causing serious injuries on the leaf surface and plant growth (Hussain 2011).
Long term exposure of SO2 and its‘ effects on animals have searched only on the experimental animals. Concentrations higher than 10 ppm with long term exposure may produce harm on the epithelial area of animals. Besides, bronchoconstriction and asthma problems can be developed by animals according to the exposure time and concentration (Hussain 2011).
2.1.4.1.3 Environmental Effects of SO2
Acid rain produced by SO2 gas contribution gives harm to plants and buildings, causes acidification problems on lakes, rivers and streams and damages to the aquatic life. When the exposure from this gas become continuous, ecosystem change could be inevitable for plants and animals (Hussain 2011). Volcano eruption is one of the most important contributor of SO2 pollution. It could emit SO2 to the atmosphere smaller ranging smaller than 10 ton/day to higher than 20 million ton/day (Hussain 2011).
SO2 released from volcano eruption in huge amounts is easily oxidized to sulphuric acid. In this reaction primary oxidation agent is hydroxyl radical (OH) which is formed in higher layers of the atmosphere and ozone (O3) is used for its‘ formation. If SO2 and other pollutants which have greenhouse effect are emitted in large amounts, OH and ozone depletion occur and global warming problem is constituted (Hussain 2011).
Also, hydrolysis reaction occurs between SO2 and H2O which produce sulphuric acid and causes ozone depletion in oxidation reaction with ozone, hydrogen peroxide and oxygen (Hussain 2011).
2.2. Artificial Intelligence
According to Ginsberg (1993) simple definition, ―Artificial Intelligence is the enterprise of constructing an intelligent artifact.‖ In this definition artificat means physical symbol system consisting of set of symbols that have different physical characteristic by Ginsberg (1993). The main concern of AI is intelligent behaviour which includes communication, perception, and learning, reasoning and behaving in problematic environment. With AI these behaviours can be solved by machines as good as human does (Nilsson 1998). Moreover, AI can understand these behaviours in wherever it occurs like in machines, in humans or in animals. Both scientific and engineering aims are important in AI perspective (Nilsson 1998).
2.2.1. Artificial Intelligence and Engineering
Although starting point of artificial intelligence is computer sciences, there have been developed several practical tool in order to solve engineering problems which are severely complicated for human mind (Pham and Pham 1999). These tools are fuzzy logic, knowledge based systems, inductive learning, neural networks, and genetic algorithms (Pham and Pham 1999).
Knowledge based systems includes domain related to that the knowledge is interlarded in a computer program using IF-THEN rules. In this method problems are solved by inference mechanism making changes in the loaded knowledge. Applications of this method are broad such as signal interpreting, fault diagnosis, machine design, selection of materials and machine and process control (Pham and Pham 1999).
Fuzzy logic is the other important tool of artificial intelligence used in engineering problem solving. It has one disadvantage which is not capable of handling new situations not found in the knowledge bases of the system. However, it shows better performance when it is used for the problems having a qualitative and inexact bases. In these systems variable‘s precise value is displaced with description. ―For instance, ‗20°C‘ can be replaced by ‗normal‘ as the linguistic description of the variable ‗room temperature‘.‖ (Pham and Pham 1999) Fuzzy logic uses same IF-THEN rules used in knowledge based system.
Inductive learning includes set of examples to produce a result. In this method the example sets are categorized as attributes and a value is attained to each attribute. After value attenuation step, process called dividing and conquering in which special strategy is used for selection of an attribute in order to achieve division of example set to subsets is applied. Inductive learning produce decision tree which include knowledge gained by specific examples to classify the example set correctly. Thus, inductive learning may be very useful for handling some problems not given in the example set (Pham and Pham 1999).
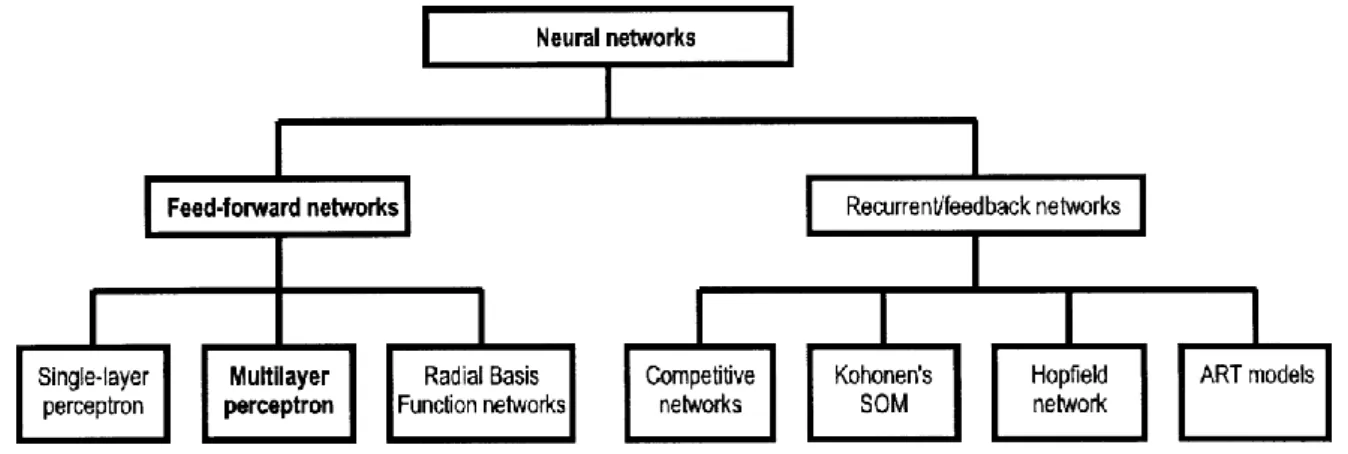
Neural networks have computational features of human brain. Models developed with neural networks make computation by using neurons which simple interconnected units are working in parallel structure (Pham and Pham 1999). Taxonomy of neural networks is given in Figure 2.2 (Gardner and Dorling 1998). The multilayer perceptron is the mostly known and used neural network. Perceptron modelling mainly uses feedforward network where inputs and outputs are connected with each other in a single line of signals. Precise knowledge of neural network is provided by training process. Weights of the connections between neurons are modified by using error among actual and expected output values. The back propagation algorithm used in multilayer perceptron determines the weight modifications in the hidden layer of network and spread the error from output vectors. There are many application of neural networks used for engineering problem solving such as prediction, classification and pattern recognition, clustering, optimisation and signal processing (Pham and Pham 1999). Detailed information related to artificial neural networks is given in next section.
Genetic algorithms are the last mostly used artificial intelligence technique. Natural evolution is the inspiration point of genetic algorithm. The most important feature of genetic algorithm is solving the complex problem without requiring any specific information related to issued problem. Nevertheless, strings of numbers must be used for representative of given problem so that algorithm is applicable to give potential solutions. These strings of numbers known as chromosomes must show the goodness or badness of each (Pham and Pham 1999).
2.2.1.1. Artificial Neural Networks
In order to model complex problems related to many aspects, artificial neural networks (ANN) which is computational modelling have appeared. ANN models have interconnected structures that produce parallel computations during data processing. The main idea behind the ANN modelling is using complex problem solving ability of biological networks (Rozlach 2015). The remarkable characteristics of biological systems such as high parallelism, fault and failure tolerance, nonlinearity, leaning, handling ability of fuzzy information, and generalization ability are significant features of ANN models (Basheer and Hajmeer 2000).
There are three ways which uses ANN models in below: Used as biological nervous system models
Used as controller in robotic systems or signal processing tool Used as analytical data methods (Sarle 1994)
In this thesis artificial neural network was used as analytical data method. Detailed of this process will be discussed in next sections.
2.2.1.1.1. Fundamentals of ANN
In order to understand artificial neural networks clearly, fundamental information related this subject is very useful. Firstly, understanding of biological neuron model is necessary for solving the connection logic of ANN. Then, advantages and possible
problem solving ability of ANN have been investigated. Finally, classification of ANN has been done and multilayer neural networks have been studied in this section.
2.2.1.1.1.1. ANN and Biological Neuron Model
Biological neuron in human brain is the important part of the nervous system so investigating the operation of biological neuron is useful to understand ANN. In human brain there are millions of neurons in different features and types (Basheer and Hajmeer 2000).
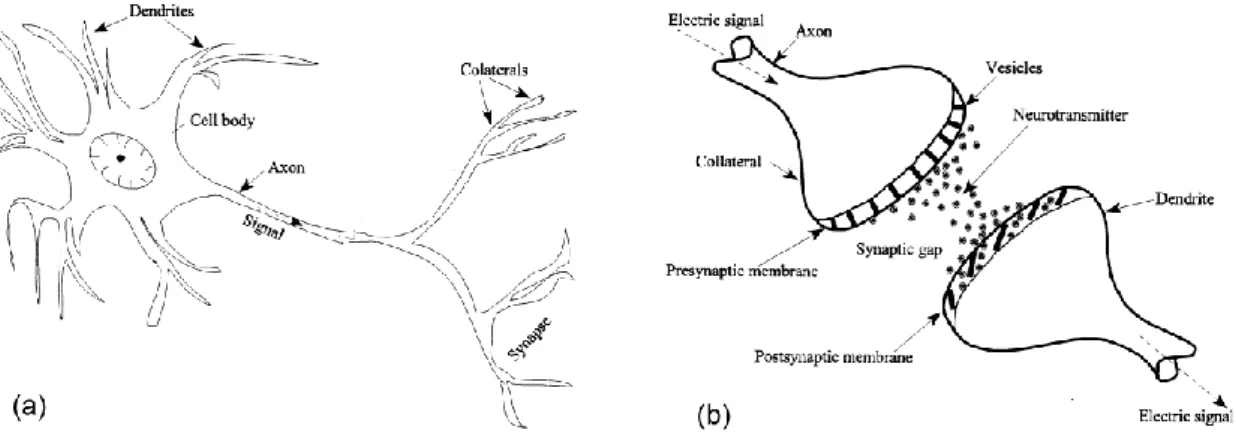
Figure 2.3a) Biological neuron, b) Mechanism of signal transfer between two biological neurons (Basheer and Hajmeer 2000)
In Figure 2.3 schematic representation of biological neuron is given in (a) and signal transfer mechanism between two biological neurons is given in (b). Main units of neuron are dendrites, axon, and cell body. Dendrites take signals from other neurons and transmit them to the cell body. Cell body contains information necessary for future uses and provides equipment for the neuron. Axon receives signals coming from cell body and transports them to the synapse (Basheer and Hajmeer 2000).
There is a significant similarity between biological neuron and artificial neuron that connection between the nodes in artificial neuron represents the dendrites and axons and the weights of connections are similar analogy with synapses (Basheer and Hajmeer 2000).
2.2.1.1.1.2. Advantages of ANN
Artificial neural network is one of the mostly used modelling techniques nowadays. It has many advantages when it‘s compared with traditional models because these models need known input data without any assumption (Gardner and Dorling 1998).With the help of suitable connecting weights and transfer functions, approximation of a multilayer function can be measurable function between input and output (Hornik et al. 1989, Gardner and Dorling 1998). Owing to its capability of using many variables and making connection between different variables, its‘ importance is getting increase.
Most of the parallel structured ANN models include intense interconnected adaptive units. The ANN models have very significant characteristic that is adaptivity of the network of highly nonlinear problems (Zurada 1997). In order to train any measurable function, the ANN modelling technique may be used properly (Simpson 1989, Hornik et al. 1989).
Moreover, ANN can train large amount of datasets, use parallel structure so that the proceeding time is decreasing drastically, and has capability of capturing nonlinear and complex underlying characteristics of any physical process (Basheer and Hajmeer 2000). ANN models show better results according to prediction and data fitting abilities than the classical statistical modelling methods especially for the data showing nonlinearity (Bourquin, Schmidli et al. 1998).
2.2.1.1.1.3. Problem solving capability of ANN
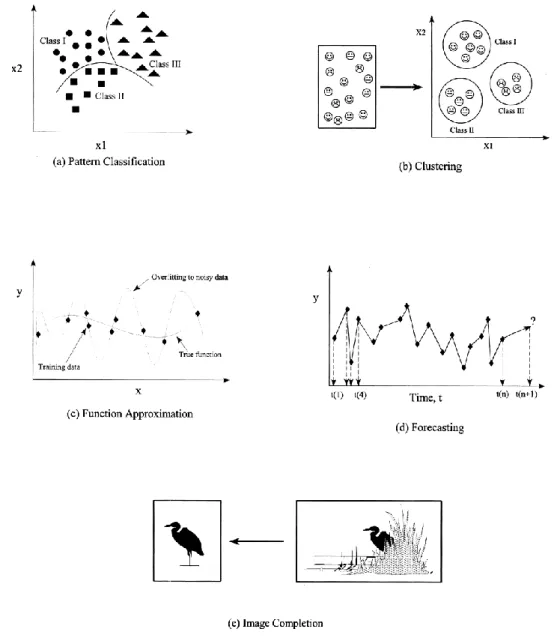
There are five main problems that can be observed during model development and ANN is capable of solving these problems efficiently. The problems solved by ANN are given in the Figure 2.4.
Figure 2.4 Solved problems by ANN a) pattern classification, b) clustring, c)function approximation,
d)forecasting, e)imege completion (Basheer and Hajmeer 2000)
Forecasting ability of ANN has been used in this thesis. Training of the given parameters provides the prediction of future data by using the given scenarios. Network predicts the target data by using historical datasets (Basheer and Hajmeer 2000).
2.2.1.1.1.4. Classification of ANN
According to the features of ANN, classification is made in many different ways. This classification is made with respect to consider the function related to modelling purpose, connectivity degree of the neurons, flow direction of the information, type of the learning algorithm, and learning rule required for training step of ANN modelling (Basheer and Hajmeer 2000). The mostly known ANN models are hopfield networks,
adaptive resonance theory networks, kohonen networks, backpropagation networks, counter propagation networks, and radial basis function networks. (Basheer and Hajmeer 2000)
Backpropagation ANN
Back propagation (BP) feedforward algorithm is the most famous learning algorithm used in ANN models. Networks in which BP is used for learning algorithm called backpropagation networks. Error is searched by back propagation using gradient descent points. Iterations in BP include forward step in which solution is provided and backward step in which error is computed for modifying weights (Basheer and Hajmeer 2000).
Back propagation algorithm is used for training the multilayer neural networks (Haykin 2001). The speed up or slow down of the error convergence are associated with the ‗η‘ and ‗μ‘ symbols respectively in back propagation training (Rumelhart et al. 1986). Moreover, the gradient descent method is used to compute the back-propagation algorithm which approximates to the trajectory in weight space (Battiti 1992). 0 and 1 or -1 and 1 is used to identify the ‗η‘ and ‗μ‘ (Rege and Tock 1996, Rumelhart and McClelland 1995). There are several guidelines for ‗η‘ and ‗μ‘ to determine their optimal values (Haykin 2001).
2.2.1.1.1.5. Multilayer Neural Networks
Multilayer neural networks include input layer, hidden layer and final layer consisting of neurons. Every connection in neural network is related to a weight that is a numeric number (Wang 2003). Output formula of neural network is given in the below;
: the output of i neuron in the hidden layer
: the activation function N: the number of input neurons
the weights
: inputs to the input neurons
threshold terms of hidden neurons
The activation function in this formula is used to bind the values of neurons in order to prevent collapse of the model because of divergent neurons. Moreover, it promotes the nonlinearity in the network model. One of the mostly used examples of activation factions is logistic function. The other probable ones are tangent and hyperbolic tangent that give the same response with logistic function but different output (Wang 2003).
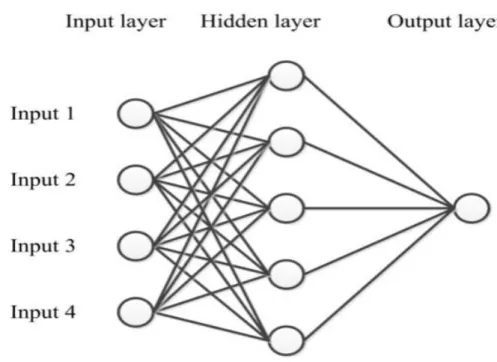
Moreover, the number of input neurons does not depend on the function while the output neurons depend on the activation function approximated by neural network. Also, the input and output variables in activation function can be represented with binary terms such yes or no. Also, they can be represented with symbols such as red or blue if the encoding of the data is appropriate. With this feature the feasibility of neural network increases (Wang 2003). In Figure 2.5 achitecture of simple multilayer neural network is given.
Figure 2.5 Architecture of multilayer neural network (Dehkordi 2012)
The input variables and the input layers are equal to each other with respect to number. The output layer includes only one neuron. In addition, the input/output neurons,
training patterns, network architecture, activation function type and training algorithm are affected by the neurons in hidden layer (Alsugair and Al-Qudrah 1998, Sarle 1997). In order to approximate any nonlinear function, one hidden layer is enough (Hornik et al. 1989). To determine the neuron number in the hidden layer is provided by training different networks and approximating the errors on the test data. If the neurons are fewer, the hidden layer gives results with high training and testing errors because of the statistical bias and under-fitting. On the other hand, if the neurons are greater, the errors in training procedure decreases while the ones in testing procedure increases because of the high variance and over fitting (Sarle 1997). In much study using ANN modelling the iterative approach is used to find hidden layer neurons.
In order to find the non-linear relationship between input and output variables, the activation function is needed. This function connects the corresponding parameters (Sarle 1997). To determine the appropriate activation function, the previous works should be examined and according to the environmental problem working on it, best resulting one should be selected. There are several activation functions such as linear, sigmoidal, hyperbolic tangent, squashing, and linear threshold in that mostly use done is logistic (sigmoid) function.
The initialization of weights and bias (free parameters) of neural network is necessary before training process is starting. The starting values of weights and free parameters contribute to the training process being fast. In order to initialize the free parameters and weight, the random numbers can be used and distributed within known range. It is suggested that the distribution range of free parameters should be smaller so that occurrence of the errors become less in the network (Wasserman 1989).
The mostly used training method for neural networks is the back-propagation learning algorithm. The input and output data supplied with an ordered form in this learning algorithm (Rumelhart and McClelland 1995). The weighting of network helps the model indicating the important parameters in the training data. This is provided with minimizing the errors of input and output data (Gardner and Dorling 1998). Moreover, the under and over training makes algorithm fail and produces high prediction errors (Gardner and Dorling 1998, 1999, Comrie 1997).
Thus, while deciding the number of training iterations, over and under training should be avoided. The data is divided into three parts named as training data set, test data set, and evaluation data set in BP algorithm. Majority of the data is used in the training data set for training purpose. The other data is used in the testing data set in which trained model performance is checked. When the model error is minimized on test data set, the training step is stopped. Lastly, predicted model is validated by evaluation data set (Gardner and Dorling 1998).
2.3. Previous studies using ANN for air pollution modelling
When the recent past is investigated, there are so many studies have been developed using artificial neural networks related to branches of environmental engineering. In these studies air quality and pollution is one of the mostly dwelled on subjects. Prediction of particulate matter, modelling of volatile organic compounds, predictions of nitrous oxides, methane, sulphur oxides are the mostly studied subjects.
First air modelling related to air quality was developed by Boznar in 1993. He and his team predicted SO2 concentration from stack gas of power plant for certain distance in complex topography. In this study as an input parameter SO2 concentrations measured in different locations in power plant and wind direction and speed, temperature and time was used. Results of this model was very good despite the complex topography of studying area (Boznar, Lesjak et al. 1993).
In 1994 studies related to models which can be used in air quality modelling and neural networks were made. Satisfactory results of the applicability of these models in air quality modelling in future were taken (Mlakar, Božnar et al. 1994).
Daily ozone concentration prediction was made using data of 8 cities of United States and compared the results of statistical regression model and artificial neural network (Comrie 1997).
Effects of seasonal climate change to atmospheric dissolved organic carbon and nitrogen amounts were modelled with artificial neural networks by using data gathered from 14 basins in North America and Canada (Clair and Ehrman 1998).
Multilayer perceptron modelling was applied to air pollution modelling and the features of this method were evaluated in 1998. Also, the strengths and advantages of ANN over other statistical modelling techniques in many scientific fields were investigated (Gardner and Dorling 1998).
Atmospheric hourly NOx and NO2 concentration was evaluated by using multilayer perceptron modelling in London. Results showed that there is a strong relationship between NOx and NO2 concentrations and meteorological factors and this relationship can modelled with artificial neural network very efficiently (Gardner and Dorling 1999).
For Delhi city in India SO2 concentrations modelled with artificial neural networks including wind speed, temperature, relative humidity, and the wind direction index as input parameters and good results were taken (Chelani et.al 2001).
Adaptive neuro-fuzzy inference system (ANFIS) was applied in order to predict effects of meteorological factors on SO2 concentrations for Erzurum city. Developed model had performance greater than 60 – 70% of prediction ability (Çelebi 2002).
In study done in Zonguldak city particulate matter (PM) and SO2 concentrations were predicted for two measurement stations by using ANN. During model development meteorological parameters are used as ınput parameters along with PM and SO2 data. As a result of the study, model developed with ANN gave successful results (Tecer 2007). Göztepe station was selected as measurement area for measuring SO2 concentration and meteorological data in İstanbul. Previous days SO2 concentration averages, daily temperature, relative humidity, cloudiness, average daily wind speed and dominant direction were indicated to the model as input parameters and next days‘ SO2 concentration was tried to be estimated by ANN. Performance of model was higher than 70% (Akkoyunlu et.al 2010).
ANN models were developed which predicts SO2, CO, CO2, NOX, O2 concentrations emitted from stacks of 16 brick and tile factories in Çorum city. In these models vent diameter, cross sectional area, fuel calorie, fuel amount, thermal power, stack height,
ambient temperature, gas temperature, average humidity, gas speed, gas flow, and dust concentrations of brick and tile factories were used as input parameters for prediction of SO2, CO, CO2, NOX, O2 concentrations. With respect to these parameters, experimental studies were conducted in three different period of a year and data was gathered for model development. Some part of gathered data was used for training purpose and rest of them was used for testing of the model. The model predicted SO2 concentrations gave R values 0.9915 and 0.9807 respectively for training and testing (Arabacı et. al 2010).
ANN model was developed for Malesia by considering SO2, CO, NO2, NO, temperature, relative humidity, and air velocity parameters. Performance of developed model was evaluated according to mean square error (MSE) and R2 values. Best prediction of this model was 0.57 R2 and 0.062 MSE (Ghazali 2012).
Moreover, SO2 concentrations in center of Konya city were modelled with indication meteorological parameters by ANN and adaptive neuro-fuzzy inference system (ANFIS). In this study ANFIS was found more successful than ANN model but both could be used for prediction of air quality (Dursun, Kunt et al. 2015).
3. MATERIAL AND METHOD
3.1. Working Area
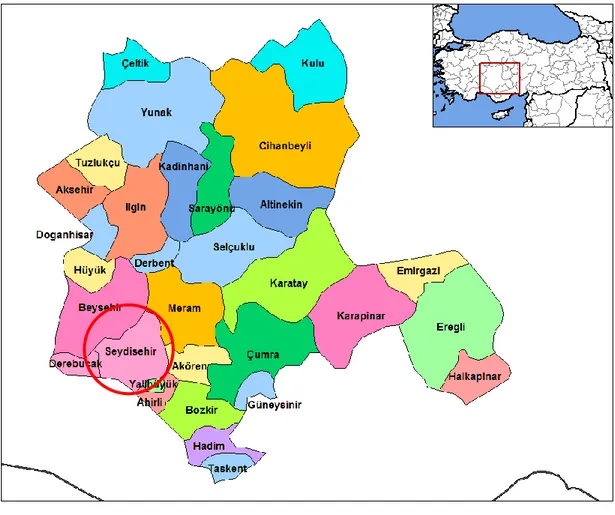
Working area of this study is Seydişehir town which is in south part of Konya City. It is the biggest city in Turkey with surface area of 40,814 km2. This amount covers 5% of total surface area of Turkey (URL 8). Surface area of Seydişehir town is 2207 km2 and it is surrounded with mountains. Average altitude of the town is 1113 m. Population of Seydişehir is 63773 at 2014. Half of the population lives in town center and rest lives in villages. In Figure 3.1 the map of Konya city and Seydişehir town is given.
Figure 3.1 Map of Konya and Seydişehir town (URL 9)
Seydişehir Eti Aluminium Facility is one of the biggest industrial factories of Konya. Bauxite and lignite are the main minerals extracted from this town and they are processed in Eti Aluminium Facility (URL 10).
3.1.1. Climate of working area
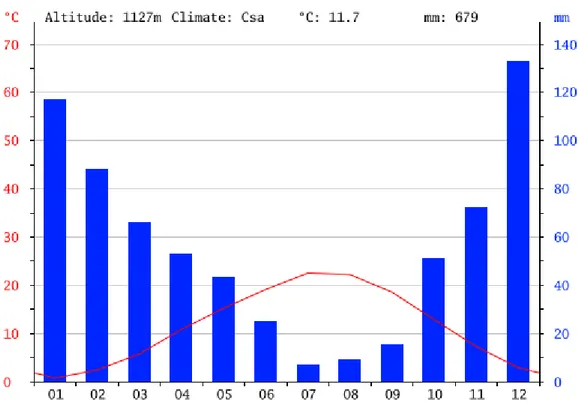
Climate of Seydişehir is warm and mild. Rainfall amount in winter months are higher than summer months. Yearly average temperature of Seydişehir is 11.7 oC and average rainfall amount of town is 750 mm. Rainfall difference between most arid and rainy month is 126 mm and average temperature changes around 21.8 degrees. (URL 11) Figure 3.2 shows the change in temperature and rainfall during one year period in Seydişehir town. According to this figure, high temperatures and minimum rainfall are seen in July month of year.
Figure 3.2 Change in temperature and rainfall during one year period in Seydişehir town (URL 11)
According to study done by Sarı and İnan (2011), climates of Seydişehir and Beyşehir towns were compared. Information related to climatic factors of Seydişehir town is given next sections by making use of this study. For developing ANN model, meteorological factors were integrated to the model as input parameters.
3.1.1.1. Temperature
Yearly average temperature of Seydişehir town is 11.8 °C and minimum average temperature happens on January, maximum average temperature happens on July months. The average temperature during spring is lower than fall season because winter and spring passes rainy, surface is covered with green plants, cloudiness increases in spring months while arid summer season increases fall temperature. Around Seydişehir, altitude increases between short distances so 5 – 6 °C temperature difference is seen in between bottom land and mountain areas. In Table 3.1 temperatures of seasons in Seydişehir town is given (Sarı and İnan 2011).
Table 3.1 Temperatures of seasons in Seydişehir town (°C) (Sarı and İnan 2011)
Winter Summer Spring Fall Average
1.1 22.4 10.7 12.9 11.8
In winter season inner parts of Turkey enters the effects of cold air masses coming from Siberia, therefore, very low temperatures can be seen in the town. For example, on February 1991 absolute minimum temperature of Seydişehir was measured as -27 °C. That kind of low temperatures may be harmful for agricultural activities, transportation, power transfer lines, and water supply networks. Absolute maximum temperatures reach to 39.2 °C in Seydişehir town (Sarı and İnan 2011).
3.1.1.2. Atmospheric Pressure
There is a sharp increase seen in the pressure values of fall season. Yearly average pressure of Seydişehir town is 887.3 mb. Monthly pressure between September and December is higher than yearly average pressure. Table 3.2 gives the distribution of yearly average pressure of Seydişehir (Sarı and İnan 2011).
Table 3.2 Distribution of yearly average pressure of Seydişehir (mb) (Sarı and İnan 2011)
Jan. Feb. March April May June July August Sept. Oct. Nov. Dec. Avg.
3.1.1.3. Wind
Average wind speed of Seydişehir town is 2.1 m/sec and average wind speeds of spring season in measurement stations is higher. Seydişehir town and closed settlements are affected from strong winds (Sarı and İnan 2011).
Figure 3.3 Dominant wind direction and frequencies of Seydişehir town (Sarı and İnan 2011)
Direction and frequency of wind is very important with respect to many activities. Especially for determining construction area of factories and city planning wind direction and frequency should be considered. Dominant wind direction and frequencies are determined according to Rubinstein formula. There are two dominant wind directions which are shown in Figure 3.3 for Seydişehir town. First one is N to 62.9 W with 40.7% frequency and second one from S to 24.3 E with 32.5% frequency (Sarı and İnan 2011).
3.1.1.4. Relative Humidity
Yearly average relative humidity of Seydişehir is 64.4%. Relative humidity of town is high in winter season because humid air masses coming from Mediterranean region enters easily to Seydişehir and its surroundings. Moreover, relative humidity decreases in summer season since frequency of humid air masses is low in this season. Table 3.3 represents distribution of yearly average relative humidity of Seydişehir (Sarı and İnan 2011).
Table 3.3 Distiribution of yearly average relative humidity of Seydişehir (%) (Sarı and İnan 2011)
Jan. Feb. March April May June July August Sept. Oct. Nov. Dec. Avg.
3.1.1.5. Rainfall
Yearly average rainfall amount of Seydişehir is 750.3 mm which is greater than Turkey‘s yearly average rainfall amount. Number of the rainfall events in winter season is higher than summer season for Seydişehir town (Sarı and İnan 2011).
In Seydişehir the highest yearly rainfall amount between 1975 and 2006 was 1126.6 mm and the lowest yearly rainfall amount between same years was 474.9 mm. Rainy days starts on the beginning of October and reaches its‘ maximum level on December. After January it starts to be decreasing regularly. Distribution of yearly rainfall according to the months is 46.9% for winter, 24.4% for spring, 6.2% for summer and 22.5% for fall season. Figure 3.4 shows this distribution (Sarı and İnan 2011).
Figure 3.4 Distribution of yearly rainfall of Seydişehir according to the months (Sarı and İnan 2011)
3.1.1.6. Cloudiness
Cloudiness reaches its‘ peak values on April and May months in Seydişehir. Increase in convectional movements and mobile depressions affect this increase. The number of cloudy day on May is 19.7. August is the month on which cloudiness is the lowest level around 8 days. On winter months cloudiness is in high degree. Table 3.4 shows the distribution of average cloudy day number in Seydişehir according to months (Sarı and İnan 2011).
Table 3.4 Distribution of average cloudy day number in Seydişehir according to months (day) (Sarı and
İnan 2011)
Jan. Feb. March April May June July August Sept. Oct. Nov. Dec. Avg.
3.1.2. Geographical situation of working area
Seydişehir town is in the central Anatolia region and ancillary of Konya city. It is 107 km far from Konya city center and in 37.7 north latitude, 31.57 degrees eastern longitude. Town is circulated by Beyşehir from north, by Yalıhöyük, Ahırlı, Akseki provinces and Antalya city from south, by Derebucak from west, by Akören from east.
Town which locates at Suğla plain that is a fertile valley extended with Çarşamba stream at north foot of Toros Mountains is surrounded by Küpe Mountain from west to south and by Gidengelmez Mountain from south which has very rich bauxite mineral deposits. On the other hand, Küpe Mountain has many natural water reserves. These huge mountains around Seydişehir create a different aesthetic silhouette. Besides, Pınarbaşı, Kuğulu, Beldibi ponds used for sporting and entertaining activities are natural beauties which are taking place in the city and fed from spring at Küpe Mountain. There is Beyşehir Lake at northwest and Suğla Lake at southeast part of the town.
In Seydişehir town there are 136,256 ha usable area encompassing 3.34% of Konya‘s usable area and 9.84% of lakes basin. This usable area of the town includes 45.64% of forest area, 29.6% of agricultural area, and 3.52% of forage-grass area. Forest area of Seydişehir generates 11.51% of Konya‘s forest area and 12.74% of lakes basin. Agricultural area of town comprises 9.81% of agricultural area of lakes basin while it comprises 11.79% of Konya‘s agricultural area.
Seydişehir has connection with every part of Turkey by highway of Ankara-Konya-Antalya. Town is 85 km far from Konya, 208 km from Antalya, 135 km from Manavgat. Also, there is 50 km to Bozkır, 37 km to Ahırlı, 31 km to Yalıhöyük, 36 km to Beyşehir from the town.
There is 217 km long village road network under responsibility of General Directorate of Rural Services. 31 village roads which are 156 km part of total roads are made by asphalt and 17 km of other roads used by neighbourhoods and pedestrian are stabilized, 38 km of them are levelling, 6 km of them are raw. Also, there is 135 km road network in all Seydişehir under responsibility of General Directorate of Highways (URL 1).
3.1.3. Air pollution sources of working area
Industry of Seydişehir town is very wide in variety of fields such as mining and manufacturing industry. Especially mining in this area has significant importance because of the minerals, bauxite, chromium and lignite, extracting from the area. Both extraction and manufacturing steps of minerals cause air pollution. Moreover, other manufacturing industries like chemical production, agricultural material production, and food production emits some air pollutants to the atmosphere (URL 1). Also, fossil fuel combustion from residential buildings and other institutions for heating purposes largely contributes to SO2 pollution in Seydişehir.
Eti Aluminium Facility is the biggest metal production and the only aluminium manufacturing facility of Turkey. It was constructed in closed area of 12,000,000 m² (URL 2). During aluminium production Sulphur in the anodes is oxidized, releasing SO2 from the potlines which is a row of electrolytic cells used in the production of aluminium as the anodes are consumed. SO2 is also released from the anode bake furnace as pitch used to help form the anodes are oxidized during the baking process (URL 3). As a result of this anode process during aluminium production, Eti Aluminium facility contributes SO2 pollution in Seydişehir town.
Furthermore, air pollution is transported long distances along with air movements so air pollution in Seydişehir can be increased by the effects of that kind of transportation mechanism.
3.2. Collection of data
Pollution data of thesis was gathered by SO2 analyser device which was positioned in Seydişehir town between 2012 and 2013 years. Detailed information related to this device is given in the next section.
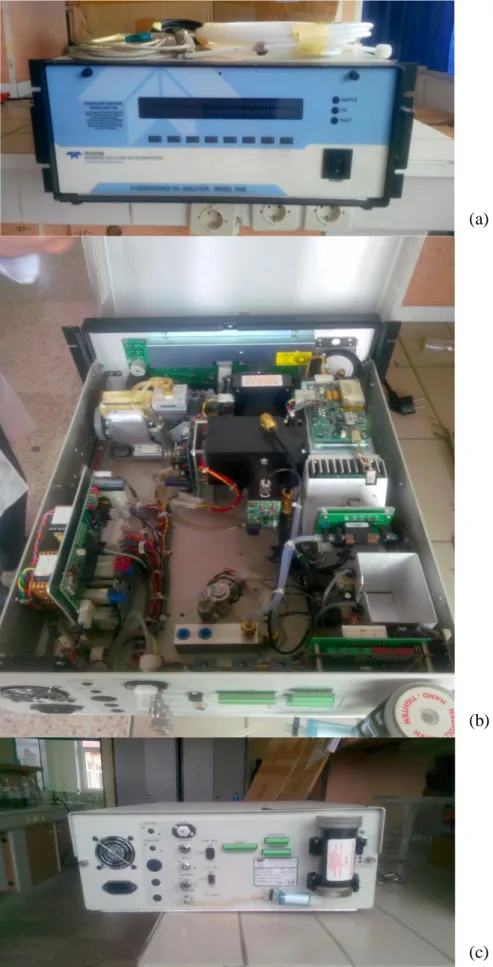
3.2.1. SO2 gas analyser device
M100E UV Fluorescence SO2 Analyser (Figure 3.5) was used for SO2 measurement in this area. The Model 100E uses the proven UV fluorescence principle, coupled with