DEMOGRAPHIC CHANGE ANALYSIS OF THE EUROPEAN UNION
AND FUTURE PROJECTIONS
Araştırma Makalesi / Research Article
Ultan, M. Ö. (2020). Demographic Change Analysis of the European Union and Future Projections. Nevşehir Hacı Bektaş Veli Üniversitesi SBE Dergisi, 10(1), 187-202.
Geliş Tarihi: 10.12.2019 Kabul Tarihi: 19.05.2020 E-ISSN: 2149-3871
Doç. Dr. Mehlika Özlem ULTAN
Kocaeli Üniversitesi, İktisadi ve İdari Bilimler Fakültesi, Uluslararası İlişkiler Bölümü [email protected]
ORCID No: 0000-0002-0718-9083
ABSTRACT
The European Union is an international organization which has 27 member states and 512.379.225 population according to the demographic data of 2018. The population of the Union has generally increased through the years. But new sociological researches show that the European Union will face a demographic change problem. The population structure of the European population has begun to change in a negative manner. Now it is well-known that especially Western Europe is one of the world’s oldest populations. This paper will analyze the demographic change of the EU from 1960 to 2100 in a manner of some important factors such as population, fertility, life expectancy, and future projections. Very detailed analysis is needed for demographic change of the population. However, the scope of this study will be based on general evaluation criteria and some suggestions. These proposals are thought to bring important solutions to the problem of aging the population of the Union. Since the study was written during the Brexit process, the UK was included in the overall statistics, but the answer was partly addressed to the question of how the European Union would be without the United Kingdom.
Keywords: The Ageing of Population, Fertility Rates, Life Expectancy Rates, Future Projections.
AVRUPA BİRLİĞİ’NİN DEMOGRAFİK DEĞİŞİM ANALİZİ VE GELECEK
PROJEKSİYONLARI
ÖZ
Avrupa Birliği, 2018 demografik verilerine göre 27 üye devlete sahip olan ve 512.379.225 nüfuslu uluslararası bir kuruluş olarak faaliyet göstermektedir. Birliğin nüfusu genel olarak yıllar içerisinde artmıştır. Ancak yeni sosyolojik araştırmalar, Avrupa Birliği’nin demografik bir dönüşüm problemiyle karşı karşıya kalacağını göstermektedir. Avrupa kıtasının nüfus yapısının olumsuz yönde değişmeye başladığı anlaşılmaktadır. Özellikle Batı Avrupa’nın dünyanın en yaşlı nüfusa sahip bölgelerinden biri olduğu bilinmektedir. Bu makale, AB'nin 1960'dan 2100'e kadarki demografik değişimini; nüfus, doğurganlık, beklenen yaşam süresi ve gelecek projeksiyonları gibi bazı önemli faktörler açısından analiz edecektir. Nüfusun demografik değişimi açısından çok detaylı analizler yapılması gerekmektedir. Ancak bu çalışma kapsamında genel değerlendirme ölçütleri baz alınacak, Avrupa kıtasının karşı karşıya kaldığı bu sorunun çözümü için de bazı öneriler öne sürülecektir. Bu önerilerin Birliğin nüfusunun yaşlanması sorununa önemli çözümler getireceği düşünülmektedir. Çalışma Brexit sürecinde yazıldığı için, istatistiklerin genelinde İngiltere de dahil edilmiş, ancak İngiltere’nin üyesi olmadığı Avrupa Birliği’nin nasıl olacağı sorusuna da kısmen cevap aranmıştır.
188
Anahtar Kelimeler: Nüfusun Yaşlanması, Doğum Oranları, Beklenen Yaşam Süresi, Gelecek Projeksiyonları.
1. INTRODUCTION
The population of the European Union (EU) was 512 million in 2018. Within the context of the world population, every 14 people of the population live in the EU. According to the largest populations list of “CIA the world factbook”, the EU is on the third rank, after China and India. (The World Factbook, 2019) But this large population will change through years because of some demographic problems. One of the main aims of this paper is to analyze the population change of the EU according to years and the number of member countries. While other researches focus on total population numbers, this paper’s purpose is to show ‘what if scenarios’. All of the tables will focus on the number of member countries during the European enlargement. Thus, the effects of new member countries population structures to the EU can be seen. This study will show the future age population of the EU, within the context of fertility and life expectancy rates.
2. DEMOGRAPHIC CHANGE OF THE EU MEMBER STATES
The structure of the population has been changed by fertility rates, mortality rates, and migratory flows. Scholars have been analyzing the main outcomes of both the past and the future levels of the EU-28 age population from economic, social and political perspectives.
Although demographic change is accepted as a global phenomenon, Europe has a pioneering role to play in it. (Hoßman, 2008: 3) The term of ‘demographic change’ indicates an age structure of a population that adjusting to changes in the composition of a society’s age structure and the results of social shifts. The main demographic problem, which the EU has faced to, is the demographic change, and this usually means the challenges that come with an ageing society. (Linz and Stula, 2010: 2)
The ageing of the population is accepted as a process by which older people begin to constitute the larger part of the total population. Population ageing is the result of low fertility and long life expectancy. It is also influenced by international migration flows. The future projections show that it seems to be permanent, so it becomes to be an important policy issue. (Bijak, Kupiszewska, Kupiszewski, Saczuk, and Kicinger, 2007: 3) Demographic change should be understood as an important problem which affects various areas such as pension, employment, family, education policies, and also immigration and integration policies. (Linz and Stula, 2010: 4)
United Nations (2002: 1–3) declared the most important side-effects of the population ageing process:
The growing number of elderly and of pensioners in the population can cause the increase of public expenditure on pensions, social security, and health services.
The percentage of people in the working age is decreasing and this cause shrinkage of the labour force and an increase in the overall burden on the working population in terms of taxes, family support etc.
The European pension system (pay-as-you-go) can fail.
The demand for medical care can grow and the public health patterns can change.
The changes in the patterns of resource distribution between the generations can increase the risk of the emergence of intergenerational conflicts.
As it can be seen from the United Nations report, the ageing population of European countries has so many implications for social and economic policies. (Walker and Maltby, 2012: 117) In order to understand the demographic change of the EU member states, it is needed to analyze the statistical tables of total population, proportions of the population by age, fertility rates, and life expectancy by age.
189
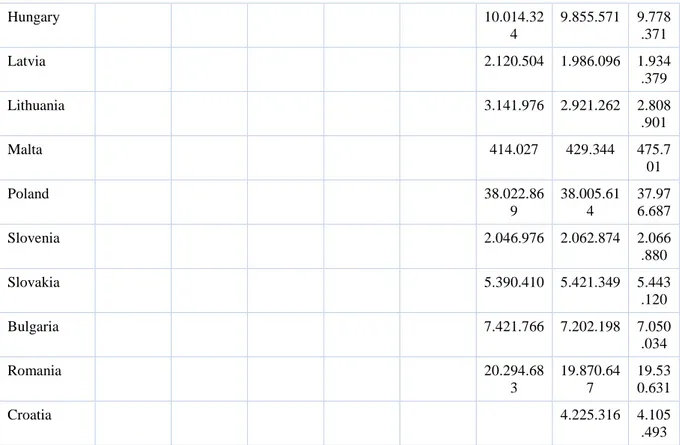
Table 1: Total Population: Countries and Years according to Enlargement GEO/YEAR S 1960 1973 1981 1986 1995 2007 2013 2018 EU (28 countries) 406.731.7 54 439.872.9 55 461.646.6 98 475.160.7 81 486.830.0 48 503.170.6 18 508.450.8 56 512.3 79.22 5 EU (Acc. to Enlargement ) 188.892.4 15 205.438.8 89 277.408.8 31 342.346.3 82 377.170.7 58 498.867.7 71 508.450.8 56 512.3 79.22 5 Belgium 9.128.824 9.660.154 9.855.110 9.947.782 10.239.08 5 10.839.90 5 11.258.43 4 11.39 8.589 Germany 72.542.99 0 78.269.09 5 78.179.66 2 79.112.83 1 82.163.47 5 81.802.25 7 81.197.53 7 82.79 2.351 France 45.464.79 7 50.528.21 9 53.731.38 7 56.577.00 0 60.545.02 2 64.658.85 6 66.415.16 1 66.92 6.166 Italy 50.025.50 0 53.685.30 0 56.388.48 0 56.694.36 0 56.923.52 4 59.190.14 3 60.795.61 2 60.48 3.973 Luxembourg 313.050 338.500 363.450 379.300 433.600 502.066 562.958 602.0 05 Netherlands 11.417.25 4 12.957.62 1 14.091.01 4 14.892.57 4 15.863.95 0 16.574.98 9 16.900.72 6 17.18 1.084 Denmark 5.122.065 5.135.409 5.330.020 5.534.738 5.659.715 5.781 .190 Ireland 3.392.800 3.506.970 3.777.565 4.549.428 4.628.949 4.830 .392 United Kingdom 56.284.86 3 57.156.97 2 58.785.24 6 62.510.19 7 64.875.16 5 66.27 3.576 Greece 10.120.89 2 10.775.62 7 11.119.28 9 10.858.01 8 10.74 1.165 Portugal 9.995.995 10.249.02 2 10.573.47 9 10.374.82 2 10.29 1.027 Spain 38.826.29 7 40.049.70 8 46.486.61 9 46.449.56 5 46.65 8.447 Austria 8.002.186 8.351.643 8.576.261 8.822 .267 Finland 5.171.302 5.351.427 5.471.753 5.513 .130 Sweden 8.861.426 9.340.682 9.747.355 10.12 0.242 Cyprus 819.140 847.008 864.2 36 Czechia 10.462.08 8 10.538.27 5 10.61 0.055 Estonia 1.333.290 1.313.271 1.319 .133
190 Hungary 10.014.32 4 9.855.571 9.778 .371 Latvia 2.120.504 1.986.096 1.934 .379 Lithuania 3.141.976 2.921.262 2.808 .901 Malta 414.027 429.344 475.7 01 Poland 38.022.86 9 38.005.61 4 37.97 6.687 Slovenia 2.046.976 2.062.874 2.066 .880 Slovakia 5.390.410 5.421.349 5.443 .120 Bulgaria 7.421.766 7.202.198 7.050 .034 Romania 20.294.68 3 19.870.64 7 19.53 0.631 Croatia 4.225.316 4.105 .493
Source: Own adjustment based on Eurostat data
The EU population has generally increased through years. But, the rate of this increase is decreasing with each passing year. The increase of population is both related to fertility rates and the population of new member states. This table aims to show the effects of enlargement process to the EU population. In 1960, the total population of the EU-6 was approximately 189 million. If the EU remained with the same countries, its population would be 237 million in 2015. It means that the founder countries have nearly the half of the EU population.
According to the statistical data of Eurostat, while women population of the EU-28 was %51, men population was %49 in 2018. From 1960 to 2018, women population had always been higher than men. When the member states were analyzed, it was seen that nearly all of the countries faced with the same situation. In Luxembourg, men population was a little higher than women. In Malta, men population was nearly as same as women population in 2018. Except these two countries, women were always at the top of the list. (Eurostat, 2019)
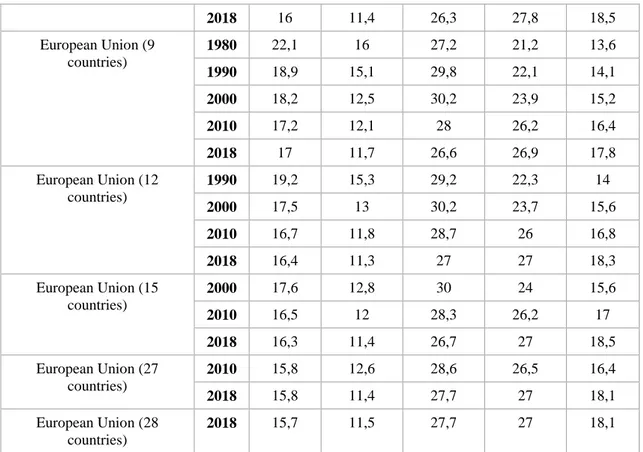
Table 2: Proportion of Population According to the Number of Member Countries and Years (Years and Age %)
Number of the Member Countries/Ages
Years 0-14 Age
15-24 Age 25-44 Age 45-64 Age 65 years and more European Union (6 countries) 1960 24,5 14,1 26,4 24,4 10,7 1970 24,3 15 26,6 22 12,2 1980 21 16 27,7 21,7 13,7 1990 17,7 14,8 30,4 23 14,1 2000 17,4 11,9 30,7 24,2 15,8 2010 16,4 11,7 27,7 26,9 17,4
191 2018 16 11,4 26,3 27,8 18,5 European Union (9 countries) 1980 22,1 16 27,2 21,2 13,6 1990 18,9 15,1 29,8 22,1 14,1 2000 18,2 12,5 30,2 23,9 15,2 2010 17,2 12,1 28 26,2 16,4 2018 17 11,7 26,6 26,9 17,8 European Union (12 countries) 1990 19,2 15,3 29,2 22,3 14 2000 17,5 13 30,2 23,7 15,6 2010 16,7 11,8 28,7 26 16,8 2018 16,4 11,3 27 27 18,3 European Union (15 countries) 2000 17,6 12,8 30 24 15,6 2010 16,5 12 28,3 26,2 17 2018 16,3 11,4 26,7 27 18,5 European Union (27 countries) 2010 15,8 12,6 28,6 26,5 16,4 2018 15,8 11,4 27,7 27 18,1 European Union (28 countries) 2018 15,7 11,5 27,7 27 18,1
Source: Own adjustment based on Eurostat data
Table 2 shows the relation between the proportion of population according to the number of member countries and years. It indicates the change in the proportion of population according to the age range of the EU-6 to the EU-28.1
The first part of the table aims to show how the proportion of the population was changed over the years if the EU remains with 6 countries. As it is seen in this part, the 0-14 age range of the six EU countries had the highest rate in 1960. After that time, it was continuously decreased through years. The most important inference from this table is that most of the people in 1960 were at the age range of 25-44, while most of the people in 2018 were at the age range of 45-64. The young population in the EU-6 gradually decreased during the period 1960 to 2018.
The second part of the table aims to show the change of the proportion of population according to the age range of the EU-9. It is nearly the same situation with the EU-6. The elderly
1 When the table is observed, it can be useful to give the list of the member countries according to membership years:
The EU-6 (Belgium, Germany, France, Italy, Luxembourg and Netherlands);
The EU-9 (Belgium, Germany, France, Italy, Luxembourg, Netherlands, Denmark, Ireland, and the United Kingdom);
The EU-12 (Belgium, Germany, France, Italy, Luxembourg, Netherlands, Denmark, Ireland, United Kingdom, Greece, Portugal and Spain);
The EU-15 (Belgium, Germany, France, Italy, Luxembourg, Netherlands, Denmark, Ireland, United Kingdom, Greece, Portugal, Spain, Austria, Finland and Sweden);
The EU-27 (Belgium, Germany, France, Italy, Luxembourg, Netherlands, Denmark, Ireland, United Kingdom, Greece, Portugal, Spain, Austria, Finland, Sweden, Cyprus, Czech Republic, Estonia, Hungary, Latvia, Lithuania, Malta, Poland, Slovenia, Slovakia, Bulgaria and Romania);
The EU-28 (Belgium, Germany, France, Italy, Luxembourg, Netherlands, Denmark, Ireland, United Kingdom, Greece, Portugal, Spain, Austria, Finland, Sweden, Cyprus, Czech Republic, Estonia, Hungary, Latvia, Lithuania, Malta, Poland, Slovenia, Slovakia, Bulgaria, Romania and Croatia).
192 population is increasing during the period 1980 to 2018. In the future, the population of 65 years and more will constitute the most important part of the population.
The third part of the table aims to indicate the change in the proportion of population according to the age range of the EU-12. With the EU-12, the situation is a little different. The 25-44 age range had the most rates in 1990, but 24-25-44 and 45-64 age range had the same rate in 2018. This means that new members, Greece, Spain and Portugal had a younger population than the EU-9.
The change in the population according to the age range of the EU-15 is shown in the fourth part of the table. As it can be seen from the table, the rate of 25-44 age range was decreased with the EU-15 in 2018. The 65 years and more age range were increasing as well.
The fifth part of the table presents the change in the proportion of population according to the age range of the EU-27. With the 2004 and 2007 enlargements, the 25-44 age range population rate increased both in 2010 and in 2018.
Finally, the last part of the table aims to show the change in the proportion of population according to the age range of the EU-28. This table indicates the current statistics of the Union’s population. According to the table, most of the population was at 25-44 age range and the 15-24 age range was at the end of the list. When the future projections are analyzed, the importance of the young population can really be understood.
When all of these proportions of age ranges have been analyzed, it can be seen that the difference of proportions between 1960 and 2018 is important for the future of the EU. 0-14 and 15-24 age ranges have been decreasing, while 45-64 and especially 65 years and more age ranges have been increasing. This situation shows that the future generation of the EU will mostly be at 25 and more age range.
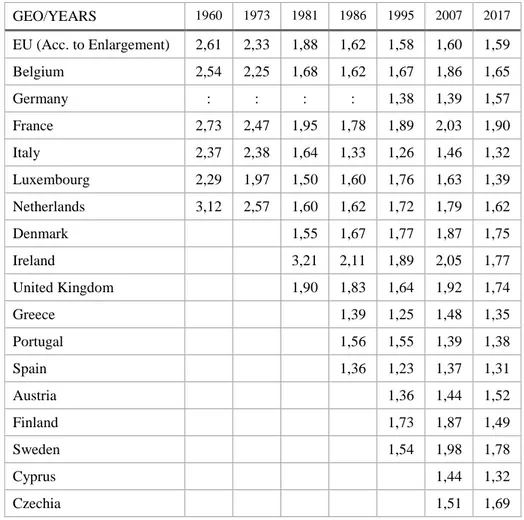
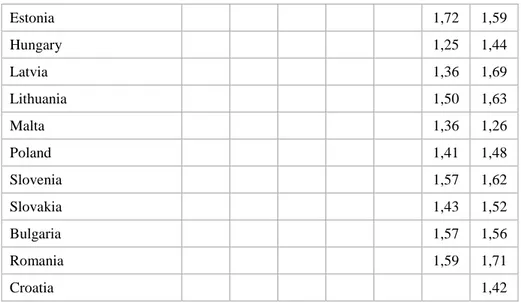
Table 3: Fertility Rates of the EU from 1960 to 2017
GEO/YEARS 1960 1973 1981 1986 1995 2007 2017 EU (Acc. to Enlargement) 2,61 2,33 1,88 1,62 1,58 1,60 1,59 Belgium 2,54 2,25 1,68 1,62 1,67 1,86 1,65 Germany : : : : 1,38 1,39 1,57 France 2,73 2,47 1,95 1,78 1,89 2,03 1,90 Italy 2,37 2,38 1,64 1,33 1,26 1,46 1,32 Luxembourg 2,29 1,97 1,50 1,60 1,76 1,63 1,39 Netherlands 3,12 2,57 1,60 1,62 1,72 1,79 1,62 Denmark 1,55 1,67 1,77 1,87 1,75 Ireland 3,21 2,11 1,89 2,05 1,77 United Kingdom 1,90 1,83 1,64 1,92 1,74 Greece 1,39 1,25 1,48 1,35 Portugal 1,56 1,55 1,39 1,38 Spain 1,36 1,23 1,37 1,31 Austria 1,36 1,44 1,52 Finland 1,73 1,87 1,49 Sweden 1,54 1,98 1,78 Cyprus 1,44 1,32 Czechia 1,51 1,69
193 Estonia 1,72 1,59 Hungary 1,25 1,44 Latvia 1,36 1,69 Lithuania 1,50 1,63 Malta 1,36 1,26 Poland 1,41 1,48 Slovenia 1,57 1,62 Slovakia 1,43 1,52 Bulgaria 1,57 1,56 Romania 1,59 1,71 Croatia 1,42
Source: Own adjustment based on Eurostat data
The EU population pyramids indicate that the two decades after the Second World War had high fertility rates. This situation was called as “baby boom”. However, since the 1970s, it has been observed negative trends in the European population structure. The “baby boomer” generation of the post-war period continues to be the major part of the working-age population. (Linz and Stula, 2010: 2) And they are now passing the threshold to retirement and representing the turning point in the demographic change of the EU. (Lesthaeghe, 2000: 8) The declining fertility rates are crucial for not only the EU member states but also for most of the world countries. According to the reports, in most of the developed countries fertility is below replacement level. (Muenz, 2007: 1)
In order to keep the population stable, a country should have a fertility rate of at least 1,7; to increase the population it is needed a fertility rate of at least 2.1. (Yılmaz Akın, 2008: 151) As it is seen from the table, since the 1990’s, the fertility rates began to be under this rate. In 2017, only France, the UK, Belgium, the Netherlands, Finland and Sweden can be accepted as countries which can keep their population stable. In eastern and southern Europe had low fertility rates. By contrast, fertility rates have decreased in Cyprus, Luxembourg, Malta, Poland and Portugal. (İçduygu, 2006: 84) The main solution for these countries is to increase migration. (Hoßman, 2008: 9)
Table 4: Life Expectancy by Age of the EU from 1960 to 2017
GEO/TIME 1960 1970 1980 1990 2000 2010 2017 EU (Acc. to Enlargement) 69,45 70,85 73,35 76,04 78,21 78,88 80.9 Belgium 69,7 71,0 73,3 76,2 77,9 80,3 81,6 Germany 69,2 70,7 73,1 75,4 78,3 80,5 81,1 France : : : 77,0 79,2 81,8 82,7 Italy : : : 77,1 79,9 82,2 83,1 Luxembourg : : 72,8 75,7 78,0 80,8 82,2 Netherlands : : : 77,1 78,2 81,0 81,7 Denmark 74,2 74,9 76,9 79,3 80,6 Ireland : 74,8 76,6 80,8 81,3 United Kingdom : : 78,0 80,6 81,3 Greece 77,1 78,2 80,6 81,4
194 Portugal 74,1 76,8 80,1 81,2 Spain 77,0 79,3 82,4 83,2 Austria 78,3 80,7 81,6 Finland 77,8 80,2 81,2 Sweden 79,8 81,6 82,2 Cyprus 81,5 82,7 Czech Republic 77,7 78,8 Estonia 76,0 77,3 Hungary 74,7 76,0 Latvia 73,1 74,4 Lithuania 73,3 74,6 Malta 81,5 82,1 Poland 76,4 77,7 Slovenia 79,8 81,1 Slovakia 75,6 77,0 Bulgaria 73,8 74,4 Romania 73,7 75,0 Croatia 77,8
Source: Own adjustment based on Eurostat data
The term of “Life Expectancy” means that the age of a person can expect to live at birth if subjected throughout the rest of his/her life to current mortality conditions. (EU Demographic Indicators, 2015: 2) According to the table, in 1960 people expect to die when they are 69 years old. But the life expectancy of these people increased and in 2017 they think that they can live longer.
The growth of older population can be explained by increased longevity, because of rising life expectancy. This situation is generally referred to as ‘ageing at the top’ of the population pyramid. The lower birth rates in the recent years can be the reason of the increasing life expectancy for European countries. If low birth rates continue, and mortality rates remain low, the ageing of societies will be inevitable.
3. FUTURE PROJECTIONS
Since the beginning of the EU, its population has grown through a combination of positive natural increase (births exceeding deaths), positive net migration (immigration exceeding emigration) and by the European enlargement. But the demographic structure is now very different from the past. (Lisiankova and Wright, 2005: 74) The age population structure of the EU will change drastically. The populations of member states are expected to be older over coming decades. (Jimeno, 2004: 2)
One of the most important future projections has been released by Eurostat in 2013. It provided a main scenario and variants for population developments from 2013 to 2080 across 28 EU member states. (People in the EU–Population Projections, 2018: 1) The projections should not be considered as forecasts; population projections are accepted as what-if scenarios which aim to find out how the likely future size and structure of the population will change. (Giannakouris, 2008: 1)
195 Low fertility rates, aging population, and an increasing number of migrants from other countries are factors that affect the European demographic structure in the coming decades. In order to understand the future of the EU population, the changes in the total population should be analyzed.
Table 5: Total Population of the EU from 2020 to 2100 (Million)
Source: Own adjustment based on Eurostat data
Table 5 shows that the population of the EU-28 will be increase by 22 million people between 2020 and 2100. The future projections suggest that there will be a natural decrease in population from 2020 to 2100. The population of the EU is expected to peak in 2040, reaching nearly 524 million people, an increase of %3 compared with the situation in 2020. The most important point of this increase is the fact that more people are living longer and longer, the reason is not related to fertility rates. In the EU-28, natural population decreases will be expected to slow down and by 2100 the change in population will stabilize at nearly zero.
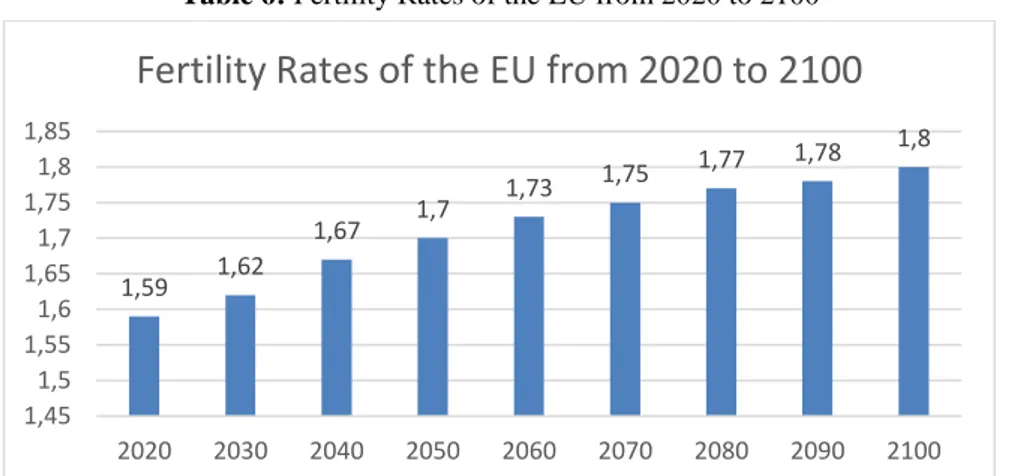
Table 6: Fertility Rates of the EU from 2020 to 2100
Source: Own adjustment based on Eurostat data
According to the assumptions, the fertility rates will increase till 2100. However, member states cannot reach the minimum rate which is needed to have a stable population. The total fertility rates will be under 2.1 and even 1.8.
514.293 520.712 524.655 523.708 517.098 509.548 504.019 498.790 492.945 475.000 480.000 485.000 490.000 495.000 500.000 505.000 510.000 515.000 520.000 525.000 530.000 2020 2030 2040 2050 2060 2070 2080 2090 2100
Total Population of the EU from 2020 to 2100 (Million)
1,59 1,62 1,67 1,7 1,73 1,75 1,77 1,78 1,8 1,45 1,5 1,55 1,6 1,65 1,7 1,75 1,8 1,85 2020 2030 2040 2050 2060 2070 2080 2090 2100
196 In the EU, there will be 48 million fewer people living between the age of 15 and 64 in 2050 compared with 2009. And, there will be 58 million more people over 65 years. (Linz and Stula, 2010: 3)
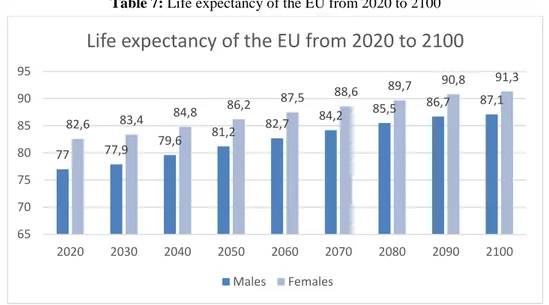
Table 7: Life expectancy of the EU from 2020 to 2100
Source: Own adjustment based on Eurostat data
As it is shown in the table 7, the life expectancy of the EU is still increasing. If we remember, the life expectancy in 1960 was 69. But from 2020, it begins to increase from 77 to 87 at male population, and from 82 to 91 at female population.
One of the main results of the population projections is the ageing of the population. The population projections show that ageing of the population will continue across all of the EU member states. The population will be higher but it is expected that the structure of the population will be old in 2100.There will be also a reduction in the number of working-age persons. (People in the EU– Population Projections, 2018: 1) Demographic change in various areas can have some consequences for the European societies. Thus, the ageing of population structure can require sociopolitical improvements. (Linz and Stula, 2010: 3-4)
The other result of the projections is the age dependency situation. The age dependency rates indicate the level of support of the young people who aged 0-14 years old or of the old people who aged 65 years or over by the 15-64 years old working age population. (Giannakouris, 2008: 4) Dividing the population aged 65 years or over by the working age population and expressing it in percent gives the old age dependency rate. Dividing the population aged 0-14 years old by the working age population and expressing it in percent gives the young age dependency rate. (Giannakouris, 2008: 11) According to the projections, in 2008 the dependency rate was 0.25. It means that for every person who is over 65, there are four people at a working age. However, in 2050, this rate is expected to be 2 to 1. It means that only the two people at a working age can represent the over 65 generation. (Linz and Stula, 2010: 3-4)
4. SUGGESTIONS AND CONSIDERATIONS
After analyzing all of these tables, some solutions can be suggested. Within the context of statistical data, migration from non-member states and improvement of the social policies can be accepted as major suggestions of a solution.
4.1. Migration 77 77,9 79,6 81,2 82,7 84,2 85,5 86,7 87,1 82,6 83,4 84,8 86,2 87,5 88,6 89,7 90,8 91,3 65 70 75 80 85 90 95 2020 2030 2040 2050 2060 2070 2080 2090 2100
Life expectancy of the EU from 2020 to 2100
197 Migration to Western Europe has increased since the 1950’s and continues at high levels. (Coleman, 2006: 405) After the Second World War, the European countries have gradually become a destination region for migrants. In 1990’s, the average entries to the EU are around 750,000 people per year. Generally, Germany, France, and the UK are the countries that face the largest number of arrivals of migrants. But in recent years, there was a rise of migration through Italy, Spain, and Ireland; they also become a destination country. (The 2015 Ageing Report, 2014: 13-14)
Although people cannot get enough children to replace themselves, the population of the EU will continue to grow for years. It is the result of net immigration to these countries. (Cruijsen, Eding, and Gjaltema, 2002: 5) According to the future projections, the net migration to the EU from 2015 to 2060 is expected to be about 55 million. In 2060, nearly %10 of the EU population will be migrants. According to the assumptions, these migration flows can be concentrated to some destination countries, such as Italy (15.5 million), the UK (9.2 million), Germany (7.0 million) and Spain (6.5 million). (The 2015 Ageing Report, 2014: 13-14)
Migration can be seen as a solution to the ageing of population process in some of the member states, but it may not be possible to estimate the population structures of the migrants. (People in the EU–Population Projections, 2018: 1)
When the reports are investigated, it can be seen that the migration from non-EU countries is still substantial. However, there is a declining trend of migration and the reason of it can be the economic situations of the Western countries. (EU Demographic Indicators, 2015: 9-10)
Nowadays, the EU has faced to illegal and irregular migration flows, but in the future, Europe can need to attract migrants in order to solve the ageing of the population issue. Especially the young and high-skilled migrants will be needed. If the unemployment remains high, it will be difficult to attract them because of the economic conditions.
4.2. Social Policy
Through the history, there has always been a close relation between older people and the development of welfare states because of the public pension systems. Pensions are the largest items of national social expenditures across the EU. Due to the pension system, an active social and public policy is required to create an effective ageing policy across the EU. (Walker and Maltby, 2012: 117-118)
The ageing population of the EU will be the main reason for the increase in the number of individuals of pension age and the decrease in the number of individuals of working age. (Lisiankova, and Wright, 2005: 74) As a result of the ageing population, the demand for public provision of age-related transfers and services, the expenses for pensions, long-term care and also health care will increase. The impact of the ageing population can change from region to region. Public expenditures of some countries in the EU will be higher, such as in Luxembourg, Greece, Slovenia, Malta, Netherlands, Romania, Spain and Ireland. (Linz and Stula, 2010: 3-4)
The demographic change of EU requires some social policy developments. The increasing retired population will need to be funded by a small workforce. (EU Demographic Indicators, 2015: 5) This situation can lead to an increase in the demand for healthcare, residential services, pensions, and other services which consumed by the elderly. The people of working age which are expected to pay for this increase will become smaller, not only in numbers but also in relative population share. It means that the demanding people will increase and the supplying people will decrease. (Lisiankova, and Wright, 2005: 74)
In the EU, women are mostly working, so they can have children at their later ages. Because of this situation, the birth rates are decreasing. If it continues, it will substantially contribute to a decline in population size. (Lutz, O'Neill, and Scherbov, 2003: 1991) Within this context, in order to solve the age dependency issue, countries can encourage fertility of its people by providing financial support for parents. But it is related to the welfare system of the country, so not every country can be able to provide financial support. (Hoßman, 2008: 9) It is inevitable that if there is not any change in age-specific employment rates, the rate of workers to non-workers will continue to be unbalanced. (Lisiankova, and Wright, 2005: 80)
198
4.3. Enlargement Process
The last but not least solution is the enlargement process of the EU. The population structures of the candidate countries can be very crucial for the ageing population issue. Montenegro, the Republic of North Macedonia, Albania, Serbia, and Turkey are currently candidate countries, while Bosnia and Herzegovina and Kosovo are potential candidates. On 12 March 2015, Iceland requested not to be regarded as a candidate country. (Enlargement Countries: Demographic Statistics, 2018: 2) As it is seen before, the population of the EU-28 in 2015 was approximately 508 million. The total population of the enlargement countries was expected to be over 95 million, which was equivalent to %18 of the EU-28. Turkey was the largest candidate country, with a population of 77 million in 2014, just lower than Germany with a population of 81 million in 2014. (Enlargement Countries - Population Statistics, 2018: 1) It is impossible to see any enlargement process as large as Turkey’s population as a single country in the EU history before. The enlargement process in 2004 includes 10 countries with 74 million people, while Turkey’s population is 72 million in 2007. (Uçak, 2002: 180)
The young generation of the candidate countries is also important. The higher proportion of the young population is in Turkey and Kosovo. The working-age population accounted for %66.2 of the total population in the EU-28 in 2015. The lowest share was %65.1 in Kosovo and the highest share was %70.8 in the Republic of North Macedonia. (Enlargement Countries: Demographic Statistics, 2018: 4)
Turkey and Kosovo have also the highest fertility rates among candidate countries. The fertility rates of these two countries averaged more than two children per woman in 2015. (Enlargement Countries - Population Statistics, 2018: 1) All of these data show that the young population and the fertility rates of the candidate countries are higher than the EU-28. The membership of these countries can be a solution for the ageing population issue of the EU.
5. CONCLUSION
Nowadays, the demographic change has become a global issue which results from declining fertility and increasing life expectancy. As a result of the demographic change, the ageing of the population has occurred. The total size of the European population is expected to be larger by 2080 but much older than it is now. In the EU member states, lower fertility rates and higher life expectancy rates will lead to a decrease in population size. The ageing of the population in the EU countries is faster than the other world regions. But the EU can solve the working age problem and the labour force issue by a variety of policies such as rising the retirement age, and the participation of migrants and women to the labour force.
After focusing on the population structure of the EU in general, the aging problem and the solutions, it is considered that the Brexit process should be evaluated. As it is known, the UK has decided to leave the EU with the referendum held on 23 June 2016. During the negotiations between the EU and the United Kingdom in 2017, they reached a preliminary agreement on a number of issues, including the payment of a substantial ‘separation fee’ stemming from the UK's commitments to the EU budget and the rights of citizens. Brexit, which should take place on 29 March 2019, was postponed to 22 May and then to 31 October. The British Prime Minister Johnson was forced to request a new postponement from the EU in accordance with the laws adopted in parliament to prevent leaving without a deal, and the EU decided to postpone Brexit to 31 January 2020.
In the case of Brexit, the number of EU member states will be reduced to 27. Therefore, the change in the population structure of the Union should be evaluated in general for the post-Brexit. After Germany and France, the most populous country of the Union is the United Kingdom. It is also the 4th country of the Union in terms of fertility rates. Therefore, it is seen that the population of the EU will decrease much more if the UK leaves the Union and there will be a decrease in the average fertility rates.
In addition to United Kingdom, which decided to leave the EU, the terms Frexit used for the possibility of France leaving the Union (Cicioğlu and Kalkan, 2019: 28) and Grexit used for the possibility of Greece's separation are frequently seen on the agenda. However, a population
199 projection has not been conducted within the framework of the possibility of the separation of these two countries.
Within the EU, there is a general problem of aging the population in European countries. Actually, the first solution to this situation is to increase the birth rates. However, the increase in female labor force participation rates and the decrease in income levels of families make it difficult to realize these proposals. Thus, in order to compensate the decline of the population, it should be seen essential that the EU should manage its migration policies, its social and public policies and should analyze the socio-demographic effects of the enlargement processes.
REFERENCES
(2002). World Population Ageing: 1950–2050, United Nations, New York: United Nations Population Division.
Bijak, J., Kupiszewska, D., Kupiszewski, M., Saczuk K., and Kicinger A. (2007). Population and Labour Force Projections for 27 European Countries, 2002–2052: Impact of International Migration on Population Ageing, European Journal of Population, 23, 1–31.
Cicioğlu, F. ve Kalkan D. (2019). De Gaulle’den Frexit Tartışmalarına: Fransa Avrupa Birliği’nin Neresinde?. Bilgi Sosyal Bilimler Dergisi, 21(1), 1-38.
Coleman, D. (2006). Immigration and Ethnic Change in Low-Fertility Countries: A Third Demographic Transition, Population and Development Review, 32(3), 401-446.
Cruijsen, H., Eding, H., and Gjaltema, T. (2002). “Demographic consequences of enlargement of the European Union with the 12 Candidate Countries”, Division of Social and Spatial Statistics, Statistics Netherlands, 1-63. European Parliament Briefing. (2015). EU Demographic Indicators, March 2015, pp. 1-10. Retrieved July 10,
2019 from the
http://www.europarl.europa.eu/RegData/etudes/BRIE/2015/551335/EPRS_BRI(2015)551335_EN.pdf. Eurostat. (2018). Enlargement Countries - Population Statistics, September 2018, Retrieved July 14, 2019 from the http://ec.europa.eu/eurostat/statistics-explained/index.php/Enlargement_countries_-_population_statistics. Eurostat. (2018). Enlargement Countries: Demographic Statistics, Retrieved July 16, 2019 from the http://ec.europa.eu/eurostat/documents/4031688/7101418/KS-04-15-589-EN-N.pdf/063d451e-c7ca-471e-a84c-da6896b655d1.
Eurostat. (2018). People in the EU–Population Projections, 2018, Retrieved June 16, 2019 from the
http://ec.europa.eu/eurostat/statistics-explained/index.php/People_in_the_EU_%E2%80%93_population_projections.
Giannakouris, K. (2008). Ageing Characterises the Demographic Perspectives of the European Societies, Eurostat Statistics in Focus, (72), 1-12.
Hoßman, I. et.al. (2008). Europe’s Demographic Future: Growing Imbalances, Berlin: The Berlin Institute for Population and Development.
Içduygu, A. (2006). Türkiye-Avrupa Birliği İlişkileri Bağlamında Uluslararası Göç Tartışmaları, İstanbul: Türk Sanayicileri ve İşadamları Derneği.
Ilgar, I. (2008). Yaşlı Adam Avrupa, İstanbul: IQ Kültür Sanat Yayıncılık.
Jimeno, J. F. (2004). Demographic Change, Immigration, and the Labour Market: A European Perspective, FEDEA, (18), 1-37.
Lesthaeghe, R. (2000). Europe’s Demographic Issues: Fertility, Household Formation and Replacement Migration, Population Division Department of Economic and Social Affairs United Nations Secretariat, New York.
Linz, K. and Stula S. (2010). Demographic Change in Europe - An Overview, Institut für Sozialarbeit und Sozialpädagogik, 1-18.
Lisiankova, K. and Wright R. E. (2005). Demographic Change and the European Union Labour Market, National Institute Economic Review, (194), 74-81.
200 Lutz, W., O'Neill B. C. and Scherbov S. (2003). Europe's Population at a Turning Point, Science, 299(5615), 1991-1992.
Muenz, R. (2007). Aging and Demographic Change in European Societies: Main Trends and Alternative Policy Options, Hamburg Institute for International Economics, Discussion Paper No. 0703.
The European Commision. (2014). The 2015 Ageing Report, Underlying Assumptions and Projection Methodologies, European Economy Series, Economic and Financial Affairs.
The World Factbook. (2019). Country Comparison: Population, 2019, Retrieved June 12, 2019 from the https://www.cia.gov/library/publications/the-world-factbook/rankorder/2119rank.html.
Uçak, H. (2011). Turkey’s Population Dynamics as a Candidate Country for EU Membership, International Journal of Economics and Financial Issues, 1(4), 180-198.
Walker, A. and Maltby T. (2012). Active Ageing: A Strategic Policy Solution to Demographic Ageing in the European Union, International Journal of Social Welfare, 21, 117-130.
Yılmaz Akın, B. G. (2008). Yaşlanan Avrupa Birliği, Ed. Akçay, B., Kahraman, S. ve Baykal S., Avrupa Birliği’nin Güncel Sorunları ve Gelişmeler, Ankara: Seçkin Yayıncılık, 149-184.
201 GENİŞLETİLMİŞ ÖZET
Amaç
Bu çalışmada, Avrupa Birliği üye ülkelerinin nüfusunun yaşlanma sorunu ele alınmaktadır. Nüfusun yaşlanması tüm dünyada önemli bir sorun olarak görülmekle birlikte, Avrupa Birliği ülkeleri için oldukça hayati bir konu olarak karşımıza çıkmaktadır. Bu çalışma kapsamında da sorunun belirlenmesi ve bazı çözümlerin önerilmesi amaçlanmaktadır. Bu bağlamda, Avrupa Birliği ülkelerinin nüfus yapısı Eurostat veri tabanında paylaşılan veriler kullanılarak analiz edilecek ve Birliğe yeni katılan ülkelerin Birliğin nüfusuna katkısı ülkelerin üyelik tarihleri çerçevesinde analiz edilecektir.
Metodoloji
Bu çalışmada araştırma yöntemleri içerisinde sıklıkla kullanılan nicel ve nitel araştırma yöntemlerinden faydalanılmıştır. Avrupa Birliği nüfus yapısını anlamak için iki araştırma yönteminin de kullanılması uygun bulunmuştur. Nitel yöntemler bağlamında, öncelikle bir literatür araştırması yapılmıştır. Avrupa Birliği'nin demografik olarak gösterdiği değişim anlaşıldıktan sonra, üye ülkelerdeki kadınların doğurganlık oranları, kişilerin beklenen ölüm yaşı çerçevesinde ele alınan yaşam beklentisi ve üye ülkelerde yaşayan genç ve yaşlı nüfusun yüzdelerine ilişkin Eurostat verileri nicel araştırma yöntemleri çerçevesinde analiz edilmiştir. Ayrıca, Avrupa Birliği tarafından yayınlanan raporlar kapsamında, Birlik ülkelerinin nüfusuna yönelik gelecekte olması beklenen tahminler de ortaya konulmuştur.
Bulgular
Çalışmanın alana yaptığı en önemli katkıların başında, Birliğin nüfus yapısının tüm genişleme dalgaları bağlamında ele alınması gelmektedir. Bu şekilde, her üye olan ülkenin nüfusunun Birliğin toplam nüfusuna katkısı net bir şekilde görülmüş olmaktadır. Ayrıca üye ülkelerdeki kadınların doğurganlık oranları, beklenen ölüm yaşı ve üye ülkelerde yaşayan genç ve yaşlı nüfusun yüzdeleri de çalışmanın kapsamına dahil edilmiştir. Eurostat veri tabanı üzerinden elde edilen bu istatistiksel veriler incelenerek, Birliğin nüfus yapısının genel olarak ortaya konulması hedeflenmiştir. Çalışmanın bir sonraki aşamasında Avrupa Birliği ülkelerinin gelecekteki nüfus projeksiyonları ele alınmıştır. Gelecek projeksiyonları çerçevesinde yayınlanan raporlara göre Birliğin genel nüfus yapısının 2020 yılından 2100 yılına gelindiğinde nasıl değişim göstereceği anlaşılmaya çalışılmıştır.
Nitel ve nicel araştırma yöntemleri kullanılarak yapılan çalışma sonucunda, Avrupa Birliği üyesi ülkelerdeki kadınların doğurganlık oranlarının her geçen yıl azaldığı anlaşılmaktadır. Bu durum aynı zamanda ölüm yaşının da artmasıyla nüfusun yaşlanmasına ve gelecek projeksiyonları kapsamında 2100 yılına kadar nüfusun yaşının artmasına yol açtığını ortaya koymaktadır. Günümüzde Birliğin nüfusunun yaşlanması sorunundan bahsederken, bundan 80 yıl sonra sorunun çok daha karmaşık hale geleceği öngörülmektedir. Avrupa kıtasının 2100 yılı itibariyle, beklenenden çok daha yaşlı bir nüfusa sahip olacağı düşünülmektedir. Çalışmanın ana unsurlarından biri, nüfusun yaşlandığını ortaya koymanın yanı sıra, bu yaşlanma problemine bazı çözümler önermektir. Birliğin göç politikasının yenilenmesi, sosyal politika bağlamında bazı iyileştirmeler yapılması ve nihayetinde Türkiye'nin katılım sürecine ilişkin genişleme politikasının sonuçlandırılması özellikle bu soruna birer öneri olarak kabul edilebilmektedir.
Sonuç ve Değerlendirme
Bu çalışmanın sonucunda, incelenen tüm raporların Avrupa Birliği’nin yaşlanan nüfusunun önemli bir sorun olacağını yansıttığı anlaşılmaktadır. Birliğin nüfusu bu hızla yaşlanmaya devam ederse, özellikle emeklilik, sağlık hizmetleri ve bakım hizmetleriyle ilgili ülkelerin mali harcamalarının önümüzdeki on yıllar boyunca sürekli bir şekilde artacağını söylemek yanlış olmayacaktır.
2018 yılında 512 milyon olan Avrupa Birliği'ne üye ülkelerin toplam nüfusunun, 2040 yılı itibariyle 524 milyona yükseleceği tahmin edilmektedir. Ancak bu yükseliş 2050 yılından itibaren yerini düşüşe bırakacaktır. 2100 yılı itibariyle Birliğin nüfusunun 492 milyona düşeceği
202 öngörülmektedir. Brexit süreciyle Birleşik Krallığın Birlikten çıkmasıyla bu nüfus durumunun daha da düşük olması beklenmektedir. Bunun yanı sıra, 15-64 yaş aralığındaki çalışma çağındaki nüfusun oranının da büyük ölçüde azalacağı görülmektedir. Bu durum, emeklilerin çalışan kesime bağımlılık oranlarının karşılanmasını da gittikçe zorlaştıran nitelik taşımaktadır.
Birliğin nüfus yapısındaki bu tür değişiklikler; kadınların doğurganlık oranları, beklenen ölüm yaşı ve aynı zamanda üye ülkelere gelecek olan göç akışları üzerine bazı varsayımları yansıtmaktadır. Günümüzde elde edilen veriler ve gelecek projeksiyonları ışığında, Avrupa kıtasının nüfusunun gittikçe yaşlanacağı anlaşılmakta ve herhangi bir önlem alınmazsa, Birliğin nüfusunun yaşlanmasının sonuçlarının uzun yıllar sonra ortaya çıkacağı ifade edilmektedir. Tüm bu değerlendirmeler kapsamında bu çalışmanın temel amacı, Avrupa Birliği’ne üye ülkelerin ve dolayısıyla Birliğin nüfusunun mevcut durumunu göstermek ve daha sonra nüfusun yaşlanmasıyla ilgili gelecekteki tahminleri ortaya koymaktır. Verilerin bu şekilde değerlendirilmesi sonucunda alınacak önlemlerin ve yapılan önerilerin dikkate alınması halinde Birliğin nüfusunun yaşlanma sorununun çözülmesi muhtemel olacaktır.
Sonuç olarak, bu çalışma ile Avrupa Birliği’ne üye ülkelerin nüfus yapısı ortaya çıkarılmış, dolayısıyla Birliğin genel olarak nüfus yapısı ortaya konmuştur. Araştırma kapsamında Birleşik Krallığın Birlikten ayrılma süreci olan Brexit sonrasındaki durum da katılmış ancak Brexit sonrası kapsamlı bir analiz yapılmamıştır. Nüfusun yaşlanması sorununa önerilen çözüm önerileri kapsamında Birliğin bazı sorunlarla karşılaşması da muhtemel gözükmektedir. Bu sorunlar arasında göçmen karşıtlığını sık sık propaganda unsuru olarak kullanan aşırı sağ partilerin varlığı ve yine bu partilerin sıklıkla kullandığı İslamofobik söylemler yer almaktadır. Ayrıca sosyal politikalar bağlamında özellikle iktidar partilerinin sosyal politikaların geliştirilmesindeki tutumların ve uygulayacakları politikaların da tartışılması söz konusu olacaktır. Bunun yanı sıra, Frexit ve Grexit gibi tartışmalar da Birliğin gündeminde yerini bulmaktadır. Bu gibi olasılıklar çözüm önerilerinin de güncellenmesini gerekli kılacaktır. Ancak Birlik nüfusunun yaşlanmasını önlemek için atılacak adımlara ek olarak, bu adımların hangi engellerle karşılaşacağı sorusu diğer araştırmaların konusudur.