NON AGRICULTURAL EMPLOYMENT HAS BEEN
STAGNATING FOR A YEAR
Seyfettin Gürsel
*Gökçe Uysal
∗∗ve Ayşenur Acar
∗∗∗Abstract
Seasonally adjusted labor market data shows that non-agricultural unemployment rate remained at 11.4 percent in
August 2012. Non-agricultural labor force increased by 78 thousand and non-agricultural employment increased by
65 thousand in the period of August 2012 compared to the period of July 2012. Hence, non-agricultural
unemployment rate remained stagnant. Although employment in manufacturing declined slightly, increases in
service and construction employment prevented an increase in the non-agricultural unemployment rate.
Declines in non-agricultural unemployment slowed down
According to the labor market statistics released by TurkStat on November 15
thnon-agricultural labor force
increased by 563 thousand (2.7 percent), non-agricultural employment by 623 thousand (3.4 percent) on a
year-on-year basis in August 2012 and the number of unemployed persons in non-agricultural decreased by 60 thousand to
2 million 395 thousand (Figure 1). Annual increases in non-agricultural labor force, which have been slower than
their trend, started to accelerate again. The number of unemployed persons decreased only by 60 thousand due to
the increases in both non-agricultural employment and non-agricultural labor force. In previous periods, we
observed rapid declines in the number of unemployed persons in non-agricultural sectors due to higher increase in
employment than increases in labor force. However, in this period, decline in the number of unemployment persons
in non-agricultural sectors slowed down parallel to stronger increase in the labor force. We think that the base
effect that brought about sharp declines in non-agricultural unemployment rates on a yearly basis has come to an
end.
Figure 1 Year-on-year changes in non-agricultural labor force, employment and unemployment
Source: TurkStat, Betam
* Prof. Dr. Seyfettin Gürsel, Betam, Director, [email protected]
∗∗ Asst. Prof. Gökçe Uysal, Betam, Vice Director, gokce.uysal @bahcesehir.edu.tr ∗∗∗ Ayşenur Acar, Betam, Research Assistant, [email protected]
Labor Market Outlook:
November 2012
Seasonally adjusted non-agricultural unemployment rate remained stagnant
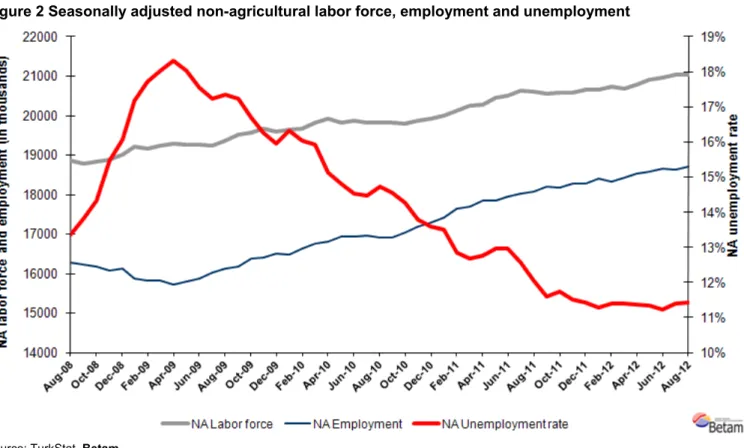
According to seasonally adjusted series, non-agricultural labor force increased by 78 thousand from 21 million 30
thousand to 21 million 108 thousand in the period of August 2012 compared to July 2012 (Figure 2, Table 1).
Non-agricultural employment increased by 65 thousand and reached to18 million 697 thousand. Consequently, the
number of unemployed persons in non-agricultural sectors increased by 13 thousand and non-agricultural
unemployment rate stagnated at 11.4 percent.
Figure 2 Seasonally adjusted non-agricultural labor force, employment and unemployment
Source: TurkStat, Betam
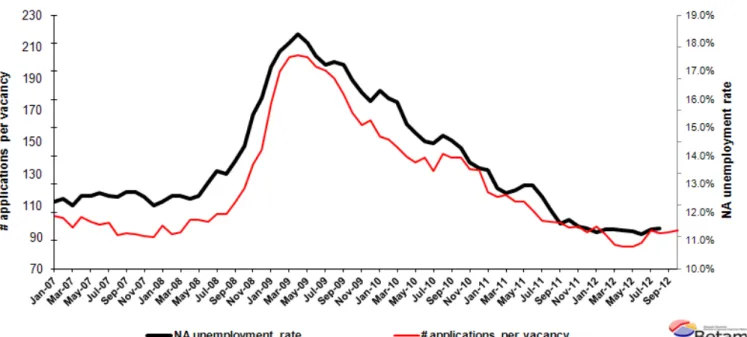
According to Kariyer.net series, non-agricultural unemployment will stagnate in the next period
Application per vacancy calculated by using series released by Kariyer.net indicates that non-agricultural
unemployment rate will stagnate in the period of September 2012.
1According to seasonally adjusted figures,
although there has decline in vacancies, application per vacancy remained the same due to a slowdown in
increase in applications.
1
Betam has been calculating application per vacancy using series released by Kariyer.net for a while. Seasonal and calendar adjustment procedure is applied to application per vacancy series. A decrease in applications per vacancy may be caused by an increase in vacancies or by a decrease in the number of applications. An increase in vacancies signals economic growth while decreasing number of applications indicates a decrease in number of people looking for a job.
Figure 3 Seasonally adjusted non-agricultural unemployment rate and application per vacancy
Data source: Kariyer.net, TurkStat, Betam
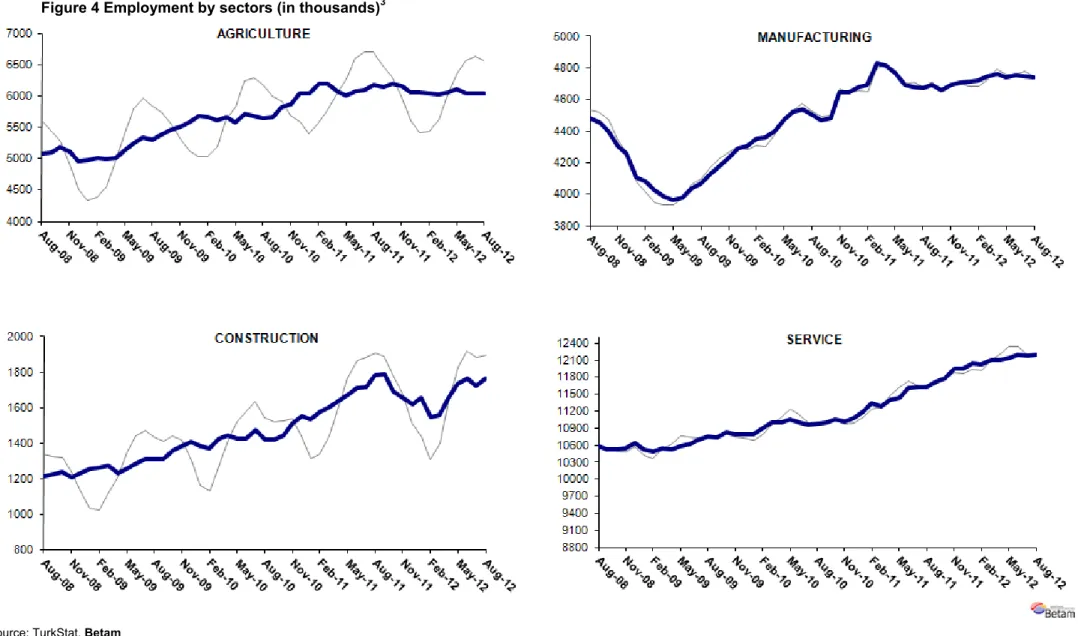
The increase in construction employment has been continuing
Seasonally adjusted series point to employment losses of 6 thousand in manufacturing in the period of August
2012 (Table 2, Figure 4).
2On the other hand, employment in services and in construction increased by 27
thousand and 45 thousand, respectively. Agricultural employment, which increased from the beginning of 2008 to
2011, has been stagnating for a year.
2 Seasonal adjustment procedure is applied to each sector of employment series separately. Hence the sum of these series may
differ from the seasonally adjusted series of total employment. The difference stems from the non-linearity of the seasonal adjustment process.
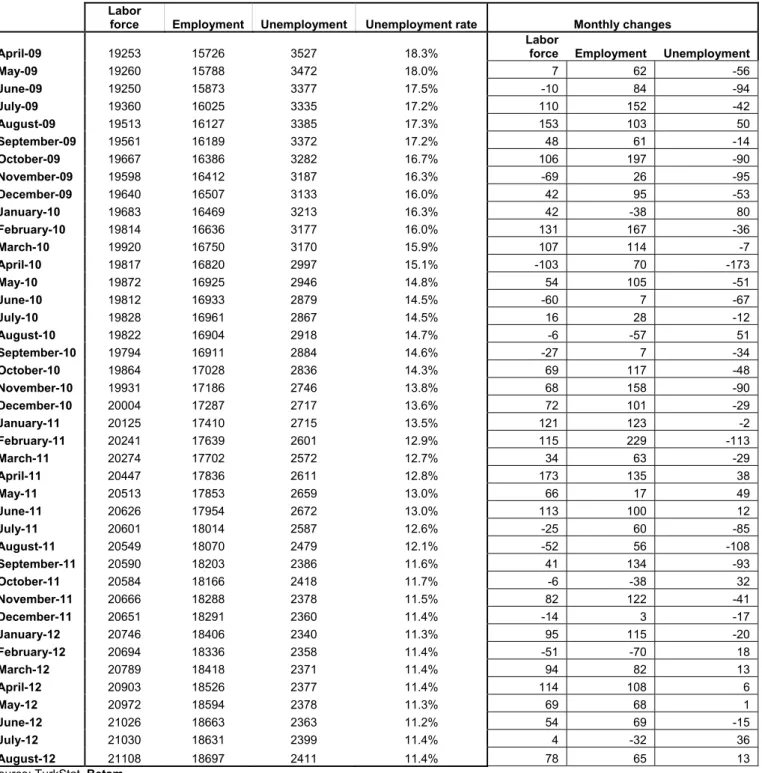
Table 1 Seasonally adjusted non-agricultural labor force indicators (in thousands)
Laborforce Employment Unemployment Unemployment rate Monthly changes
April-09 19253 15726 3527 18.3% Labor force Employment Unemployment
May-09 19260 15788 3472 18.0% 7 62 -56 June-09 19250 15873 3377 17.5% -10 84 -94 July-09 19360 16025 3335 17.2% 110 152 -42 August-09 19513 16127 3385 17.3% 153 103 50 September-09 19561 16189 3372 17.2% 48 61 -14 October-09 19667 16386 3282 16.7% 106 197 -90 November-09 19598 16412 3187 16.3% -69 26 -95 December-09 19640 16507 3133 16.0% 42 95 -53 January-10 19683 16469 3213 16.3% 42 -38 80 February-10 19814 16636 3177 16.0% 131 167 -36 March-10 19920 16750 3170 15.9% 107 114 -7 April-10 19817 16820 2997 15.1% -103 70 -173 May-10 19872 16925 2946 14.8% 54 105 -51 June-10 19812 16933 2879 14.5% -60 7 -67 July-10 19828 16961 2867 14.5% 16 28 -12 August-10 19822 16904 2918 14.7% -6 -57 51 September-10 19794 16911 2884 14.6% -27 7 -34 October-10 19864 17028 2836 14.3% 69 117 -48 November-10 19931 17186 2746 13.8% 68 158 -90 December-10 20004 17287 2717 13.6% 72 101 -29 January-11 20125 17410 2715 13.5% 121 123 -2 February-11 20241 17639 2601 12.9% 115 229 -113 March-11 20274 17702 2572 12.7% 34 63 -29 April-11 20447 17836 2611 12.8% 173 135 38 May-11 20513 17853 2659 13.0% 66 17 49 June-11 20626 17954 2672 13.0% 113 100 12 July-11 20601 18014 2587 12.6% -25 60 -85 August-11 20549 18070 2479 12.1% -52 56 -108 September-11 20590 18203 2386 11.6% 41 134 -93 October-11 20584 18166 2418 11.7% -6 -38 32 November-11 20666 18288 2378 11.5% 82 122 -41 December-11 20651 18291 2360 11.4% -14 3 -17 January-12 20746 18406 2340 11.3% 95 115 -20 February-12 20694 18336 2358 11.4% -51 -70 18 March-12 20789 18418 2371 11.4% 94 82 13 April-12 20903 18526 2377 11.4% 114 108 6 May-12 20972 18594 2378 11.3% 69 68 1 June-12 21026 18663 2363 11.2% 54 69 -15 July-12 21030 18631 2399 11.4% 4 -32 36 August-12 21108 18697 2411 11.4% 78 65 13
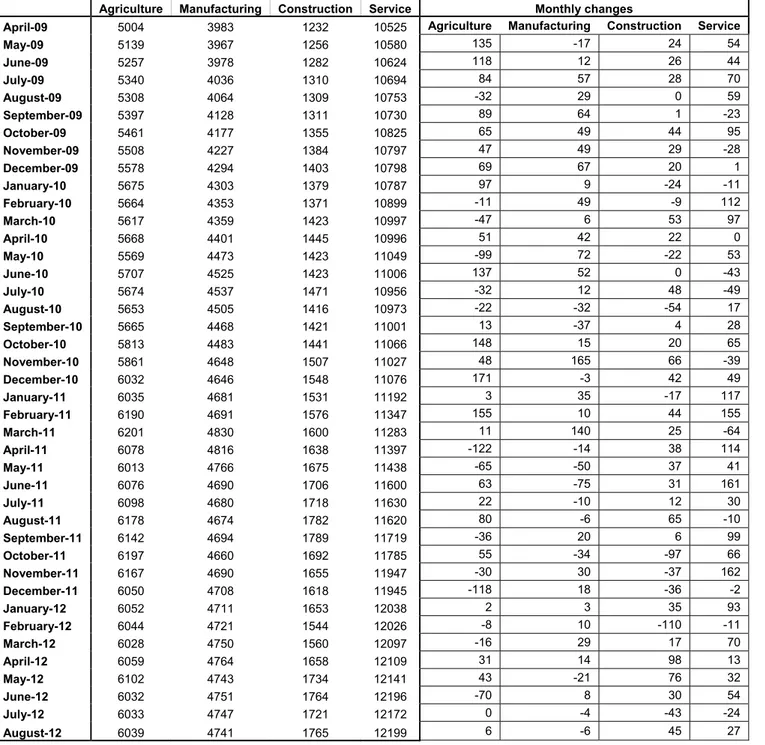
Table 2 Seasonally adjusted employment by sector (in thousands)
Agriculture Manufacturing Construction Service Monthly changes
April-09 5004 3983 1232 10525 Agriculture Manufacturing Construction Service
May-09 5139 3967 1256 10580 135 -17 24 54 June-09 5257 3978 1282 10624 118 12 26 44 July-09 5340 4036 1310 10694 84 57 28 70 August-09 5308 4064 1309 10753 -32 29 0 59 September-09 5397 4128 1311 10730 89 64 1 -23 October-09 5461 4177 1355 10825 65 49 44 95 November-09 5508 4227 1384 10797 47 49 29 -28 December-09 5578 4294 1403 10798 69 67 20 1 January-10 5675 4303 1379 10787 97 9 -24 -11 February-10 5664 4353 1371 10899 -11 49 -9 112 March-10 5617 4359 1423 10997 -47 6 53 97 April-10 5668 4401 1445 10996 51 42 22 0 May-10 5569 4473 1423 11049 -99 72 -22 53 June-10 5707 4525 1423 11006 137 52 0 -43 July-10 5674 4537 1471 10956 -32 12 48 -49 August-10 5653 4505 1416 10973 -22 -32 -54 17 September-10 5665 4468 1421 11001 13 -37 4 28 October-10 5813 4483 1441 11066 148 15 20 65 November-10 5861 4648 1507 11027 48 165 66 -39 December-10 6032 4646 1548 11076 171 -3 42 49 January-11 6035 4681 1531 11192 3 35 -17 117 February-11 6190 4691 1576 11347 155 10 44 155 March-11 6201 4830 1600 11283 11 140 25 -64 April-11 6078 4816 1638 11397 -122 -14 38 114 May-11 6013 4766 1675 11438 -65 -50 37 41 June-11 6076 4690 1706 11600 63 -75 31 161 July-11 6098 4680 1718 11630 22 -10 12 30 August-11 6178 4674 1782 11620 80 -6 65 -10 September-11 6142 4694 1789 11719 -36 20 6 99 October-11 6197 4660 1692 11785 55 -34 -97 66 November-11 6167 4690 1655 11947 -30 30 -37 162 December-11 6050 4708 1618 11945 -118 18 -36 -2 January-12 6052 4711 1653 12038 2 3 35 93 February-12 6044 4721 1544 12026 -8 10 -110 -11 March-12 6028 4750 1560 12097 -16 29 17 70 April-12 6059 4764 1658 12109 31 14 98 13 May-12 6102 4743 1734 12141 43 -21 76 32 June-12 6032 4751 1764 12196 -70 8 30 54 July-12 6033 4747 1721 12172 0 -4 -43 -24 August-12 6039 4741 1765 12199 6 -6 45 27
Figure 4 Employment by sectors (in thousands)
3Source: TurkStat, Betam