1
Carbon Emissions and the Trilemma of Trade Policy, Migration Policy and Healthcare in the US
Andrew Adewale ALOLA
Istanbul Gelisim Univ, Dept Econ & Finance, Istanbul, Turkey.
Abstract
Although the United States has consistently experienced a declining growth in carbon dioxide emissions in recent time, the country is currently the largest emitter of CO2 after China and suffers biocapacity reserve deficit. Against the backdrop of further identifying the determinants of carbon emissions in the United States, this study employed the dynamic ARDL approach to observing the tripartite impact of the trade policy, migration index, and health care on carbon emission over the period 1990:Q1-2018: Q2. By incorporating renewable energy consumption and the real GDP to control for unobserved factors, the study found that migration and carbon emissions are positively related in the long-run and short-run. The trade policy is only significant in the short-run but with negative linkage with carbon emission. There is no significant evidence of health on carbon emission in either long-run or short-run. Also, both impacts of renewable energy consumption and the real GDP are significant in both terms on carbon emission. With the series of robustness and diagnostic tests employed, the study indicate significant valid results. Additionally, policy framework toward the cutting back of carbon dioxide emissions to ensuring sustainable development are carefully provided in the study.
2 1. Introduction
Unrelenting efforts toward mitigating global warming and the adverse of climate change, desertification and land degradation are directly targeted at reducing carbon emissions. Carbon emissions have persistently become the world’s most threatening issue facing the natural ecosystem and human development. In spite efforts toward addressing this global challenge, the Intergovernmental Panel on Climate Change (IPCC, 2014) reported that carbon emission has undesirably increased from 9434.4 million tons in 1961 to 34649.4 million tons in 2011. Carbon dioxide (CO2) is a primary component (consisting about 81%) of the greenhouse gases (GHGs).
These GHG emissions and the priority air pollutants are known the main constituents of the atmospheric indicator (Sarkodie & Strezov, 2018a). The emitted C02 traps heat in the
atmosphere and thereby responsible for the aforementioned global issues. The British Petroleum (BP) Statistical Review of World Energy (BP, June 2018) indicated that carbon dioxide emissions have continued to increase from 29714.2 million tons in 2009 to 33444.0 million tons in 2017. In the report, and in spite of the Paris Agreement of 20151’s policy toward reducing carbon emission by countries, the global carbon dioxide emissions increased by 1.3% between 2006 and 2016, and also increased to 1.6% in the previous year (2017). Also, between 2007 and 2017, the growth rate of carbon dioxide emissions in the Middle East countries is observed to be the highest with 2.9% and followed by the European region with a growth rate of 2.5%. The next is the Asia Pacific, the growth rate in carbon dioxide emissions is revealed to be 2.3% and followed by Africa with 1.9%, CIS (Commonwealth of Independent States) with 0.3%, North
1
Paris agreement is United Nations Framework Convention on Climate Change (UNFCC) of 2015. More details relating to the Paris Agreement of 2015 is contained is available at:
https://unfccc.int/process/conferences/pastconferences/paris-climate-change-conference-november-2015/paris-agreement.
3
America with -0.4%, and Southern and Central America with -0.1%. Additionally, it is observed that although developed countries experienced a declining growth rate between the same periods, the volume of carbon dioxide emitted by these countries is significantly robust. For instance, 9232.6 million tons (highest volume) of carbon dioxide is emitted by China in the same period while the United States (US) is ranked the second emitter of carbon dioxide with a volume of 5087.7 million tons. Like other developed nations, the dilemma of attaining an effective and secure energy amidst climate change mitigation is still crucial to the US. The disruption of the carbon cycle as caused by human activities have consistently contributed to the increasing volume of carbon emissions in the US. For instance, drastic industrial revolution increased consumption of fossil fuels for human needs (like transportation, cooking, e.t.c), changes in land usage, and among other constitute the means carbon is mainly emitted in the US.
But, painstakingly looking at the recent policies of the government that include trade, immigration and related frameworks, there is/are concern question(s) that suggestively associate the policies with climate change. Recently, the US reviewed trade policies (mostly imposed restrictions) with its trading partners like China, the European countries, and the North American Free Trade Agreement (NAFTA) partners. It is believed that there are adequate and prior economic plans to ameliorate the consequence of such trade restrictions. Notwithstanding, the huge sanctions such as on chemicals, solar panels, primary metals, and other inputs have raised potential concerns. For instance, a previous study shows that the share of imported inputs to the US industrial sectors significantly contributed to the decline in CO2 emissions between 1997 and
2007 (Feng, et., 2015). The announcement by the US president to discontinue the Paris Agreement 2015 (The White House, 2017) is not unconnected with the aforementioned concern of trade restriction.
4
Also, while there have been divergent political arguments on the country’s immigration policy, less concern is being paid to its potential impact on climate change. For instance, the recent study of Earl, Hickey and Rieder (2017) re-echoed the work of Kolankiewicz and Camarota (2008) which hint on the dynamics of immigration policy in the context of GHG emissions and infertility debacle. Earl, Hickey and Rieder (2017) note that the introduction of policies that encourage the migration of younger population (especially from developing nations) to advance nations could effectively aid the decline of GHG emissions.
However, having experienced enormous economic growth in the last forty-five years, the US has remarkably reduced it pollutions (EPA, 2018). Among the main policy instrument employed by the government to achieve a record milestone is the Clean Air Act (CAA). Deployed in partnership with the regulatory programs, the CAA reduce conventional atmospheric pollutant, GHG emissions, and improve energy efficiency. Notwithstanding, incessant studies have revealed several factors and policy frameworks that have significantly continued to contribute to the volume of CO2 emissions in the country (Dogan & Turkekul,
2016; Apergis & Payne, 2017; Fitzgerald, Schor & Jorgenson, 2018).
In light of the above motivation and concerns, this study hypothesized a careful dynamic examination of the trilemma impacts of trade policy, migration policy and health care on carbon emissions in the US. Due to the intrinsic nature of the policies and stemming from divergent arguments, the investigation offers a further information especially considering the contemporary US. And, reflecting on the dynamic impacts of the country’s renewable energy consumption and the real Gross Domestic Product, the study is conducted to cover the period of 1990: Q1 to 2018:
5
Q2. Hence, the study is novel and importantly contribute (significantly) to extant literature in few dimensions. Firstly, it offers a simultaneous consideration of the examined policies to underpinning its tripartite impacts on carbon emissions in the United States. To the best of author’s knowledge, the examined factors have not been employed in like manner in the extant literature. Considering the recent health care debacle, trade and the immigration policies of the United State policies, the adopted approach (the ARDL-bound test) offers a dynamic examination of short-run and long-run relationships. Secondly, for the first time, the current study employs the indexes of the main factors (trade, migration and healthcare) from the news categories of the Access World News database of over 2,000 US newspapers which were categorically normalized into series of the mean of 100 from 1985-2010 (http://www.policyuncertainty.com/categorical_epu.html). Similar studies in the past had employed trade openness for trade policy, migration stock or urbanization in lieu of migration policy, and health expenditure of health policy. Lastly, having considerably incorporated an up-to-date time frame for this investigation, the current study outlived existing related literature by presenting a current policy framework for addressing carbon dioxide emissions and environmental concern in the US.
The rest of the sections are in part. An overview of the supposed determinants of carbon emissions is discussed in section 2. Data description and methodology are presented in section 3 while the results are discussed in section 4. Section 5 offers concluding remarks that include policy implications and recommendation for future study.
2 Carbon emissions: An overview of the determinants
Several extant literature have consistently noted several determinants of carbon dioxide emissions (Wei, Liu, Fan & Wu, 2007; Alola, A. & Alola, U. 2018; Al-Mulali & Che Sab, 2018;
6
Emir & Bekun, 2018; Zhou, Wang & Feng, 2018; Zhu et al., 2018). Jiang, Wang and Li (2018) used a spatial heterogeneity perspective to investigate the drivers of carbon emission in China and the US. The study noted that population and energy intensity are the key factors toward achieving a low-carbon emission in the United States. Specifically, in the case of the United State, and while testing the EKC (environmental Kuznets curve) hypothesis, Dogan and Turkekul (2016) observed that financial development is not a significant determinant of carbon dioxide emissions (in the long-run). Instead, the study revealed that real output, energy consumption, urbanization, and trade plays a significant role in the emission of carbon dioxide. And, in many previous studies, carbon emissions causatives has been investigated in the context of not only economic growth but energy consumption, health, trade, and population dynamics.
Importantly, energy consumption has continued to primarily contribute to carbon dioxide emissions in the US. Arguably, energy and residential sector fuel consumption are responsible for about 18% of the world CO2 emissions. Overall, 97.7 quadrillions Btu (British Thermal
Units) of primary energy was equivalently consumed in the country in 2017 (reported by the US Energy Information Administration, 2018). The mix of energy sources in the US is mainly grouped as primary, secondary, renewables, nonrenewable, and fossil fuels. And, about 9.6% of the total domestic primary energy production in the US is renewables. In fact, again in 2017, overall renewable energy production and consumption attained a record climax of about 11 quadrillions Btu. Hence, Dogan and Ozturk (2017) examined that renewable energy consumption mitigates environmental degradation. In the same study, it is observed that non-renewable energy consumption contributes to environmental degradation. Moreover, in the investigation and similar to Dogan and Turkekul (2016) and Sarkodie and Strezov (2018b) rejects the environmental Kuznets curve (EKC) hypothesis in the US.
7
Regarding health, the presumed danger of the expansion of GHG emissions to the environment and human health are being carefully considered in the use of healthcare facilities. Further research on climate change in the developed countries (like the US) revealed that healthcare facilities are known to account for about 3% to 8% of the climate change footprints (World Health Organization-WHO, 2015). In the United States, the health sector component is about $3.2 trillion of the economy, i.e about 18% of the GDP in 2017. Also, in advance countries, pharmaceuticals, health facility use of water and transport services, and other healthcare procedures account for the carbon footprints (generate other greenhouse gases). Hence, an improved management of health facilities and procedures with minimal health care debacle in the United States are as good as the reducing carbon dioxide and other GHG emissions. In a recent study, Apergis, Jebli and Youssef (2018) opined that health expenditure is a significant determinant of carbon emissions in a panel of African countries.
Furthermore, studies have significantly shown the linkage between trade and carbon emissions in the US (Dogan & Turkekul, 2016). The investigation reveals that trade openness causes a positive and significant impact on CO2 in the short-run. In the long-run, significant
evidence show that trade openness reduces CO2 emission thus reducing environmental
degradation. But, the recent US government trade policy could not have caused a more intricate dilemma in the link between carbon emission and trade. Irrespective of some renegotiation or suspension of some trade agreements (like the NAFTA, KORUSFTA, FTAs, BITs, e.t.c)2, the US currently has trade agreements in force with 20 countries as a way of opening up foreign markets to US exporters. Also, trade obviously enhances the country to specialize in the production of good and services that it benefits from comparative advantage. In that case, carbon
2
NAFTA is North America Free Trade Agreement, KORUSFTA is the US-Korea Free Trade Agreement, FTAs is the Free Trade Agreements, and BITs is the Bilateral Investment Treaties).
8
emission would depend on whether more energy is needed in the production chain of the sector where a country now produces more due to its comparative advantage.
Lastly, like migration, Population and urbanization are known to impacts carbon emissions especially in advance nations (Chandia et al., 2018; Jiang, Wang & Li, 2018; Zhou, Wang & Feng, 2018). The US Department of State (DOS) acknowledges the importance of migrants to the United States. It maintained that about 13% of the entire population of the US (approximately about 40 million) are foreign-born individuals and currently resides in the country. Also, DOS mentioned that more than 40% of the US high-tech companies were established by immigrants or their family members. A larger component (about 65%) of the United States construction and agricultural workers (which are mostly connected with renewable energy development and CO2 emissions) are migrants. In the submission, the US has recorded
over 6.6 million immigrants that are currently the United States citizens for the past 10 years. In spite the assertion of the United State Department of State, the country’s Immigration Policy contends that “America has reaped tremendous benefits from opening its doors to immigrants, as well as to students, skilled employees and others who may only live in the country for shorter periods of time. But it warns that the continued inability of the United States to develop and enforce a workable system of immigration laws threatens to undermine these achievements.” Moreover, a comprehensive study of the link between migration and carbon dioxide emission in the US, Kolankiewicz and Camarota (2008) highlighted the positive impact of migration and the decomposition of migrants on the carbon dioxide emissions. This result of the investigation corroborates the recent study on immigration and CO2 emissions in the US by Earl, Hickey and
Rieder (2017). Earl, Hickey and Rieder (2017) suggest that young migrants from developing countries to a developed country like the US could compliment the adverse effect of infertility on
9
the economy. But, the study equally noted the impact of such migration policy of environmental degradation in the country.
3. Data and Methodology 3.1 Data description
In this study, a multivariate approach is adopted by incorporating five explanatory variables of quarterly dataset spanning from 1990: Q1 to 2018: Q2. The three main independent variables deployed are: the trade policy index (trade, this proxy the US trade policy/approach with trade partners across the globe), the migration index (migration, it is a proxy for the magnitude of movement in and out of the US), and the healthcare index (health, this proxy for the availability and accessibility of quality health program for the people of the US). The aforesaid indices are the US policy categories3 which comprise the ranges of sub-indexes from news data. Information from the employed news categories is derived from the Access World News database of over 2,000 US newspapers which were categorically normalized into series of the mean of 100 from 1985-2010 and made available online (http://www.policyuncertainty.com/categorical_epu.html). Other independent variable of interest are the total Renewable energy consumption (REN) (it proxy for energy consumption) from the US Energy Information Administration (EIA, 2018) which are measured in Trillion of British Thermal Units (Btu) and the real Gross Domestic Product (RGDP is seasonally adjusted to the annual rate of 2012 and proxy for economic growth) from the Federal Reserve Bank of ST. Louis (FRED, 2018). These variables, ren, and rgdp are appropriately employed in this investigation to account for other unobserved factors to avoid possible biases caused by omitted variable bias. Also, the US Energy Information Administration (EIA, 2018) is the source of the dependent variable i.e. the carbon emission
3
More details on the US Policy categorical indices are available at http://www.policyuncertainty.com/categorical_epu.html.
10
(proxy by CO2 emissions) in the US (an equivalent of Million Metric Tons of Carbon Dioxide).
The descriptive statistics are implied in Table 1. <Table 1> 3.2 Empirical method
In extant literature, several methodologies which include customer lifestyle approach, (Intergovernmental Panel on Climate Change) IPCC 2007 guideline for estimating household direct C02 emissions, approach for estimating CO2 emissions from electricity, and among others
have been applied in the study of carbon dioxide emission over time (Bin & Dowlatabadi, 2005; Al-Mulali, Tang & Ozturk, 2015; Farhani & Ozturk, 2015; Li, Huang, Chuai, Li, Qu & Zhang, 2016; Dong & Zhao, 201). However, the recent work of Apergis, Jebli and Ben Youssef (2018) considered dynamic causality model between carbon dioxide emissions (C02), real Gross Domestic Product (rgdp), renewable energy consumption (ren) and health expenditure. Hence, in addition to the empirical expression investigated by Apergis, Jebli and Ben Youssef (2018, our study incorporates migration factor (migration) and trade policy (trade) to give a dynamic nexus model that is developed as:
Co2 t = f (rgdpt, rent, tradet, migrationt, healtht) (1)
Then, the natural logarithmic transformation of the above expression (equation 1) is given by:
lCo2 t = α + β1lrgdpt + β2 lrent + β3l tradet t + β4lmigrationt + β5lhealtht + εt (2)
for all t = 1990: Q1, …, 2018: Q2, C02 is the carbon dioxide emissions in by source in the US, βs are the degree of response of the logarithms of the explanatory variables and εis iiid ~ N (µ, σ2). 3.2.1 The Dynamic ARDL approach
11
The study employs the superiority of the ARDL model developed by Pesaran, Shin and Smith (PSS, 2001) especially the bound testing properties of the long-run relationship in lieu of other estimation techniques for this investigation. This approach, PSS (2001) is preferably adapted to investigate potential cointegration because of its advantages over other cointegration estimators like the Johansen and Juselius (1990). First, one of the main advantages is its appropriateness for a dataset of the mixed order of integration (i.e. either purely I (0) or I (1) of mutual cointegration). The unit root is estimated by using the Dickey and Fuller (1979) and Kwiatkowski, Phillips, Schmidt and Shin (1992) and the result shown in the lower part of Table 1. On a second note, the ARDL is considered because it effectively models smaller sample sizes. Lastly, specifically for the ARDL-bounds testing approach, it distinguishes between the explanatory and dependent variables. Importantly, we investigate structural breaks specifically due to the potential impact of policy implementations and to complement the weakness of the employed normal unit root test. As such, we employ the unit root for a single break test by Zivot and Andrews (ZA) (1992). The ZA test result is presented in Table 2.
<Insert Table 2>
And, the ARDL model is relatively efficient in estimating the short-run and long-run dynamics. In the estimation procedure, the appropriate maximum lag selection is considered from the common lag length criteria (Akaike Information Criteria –AIC is reported selected in lieu of the Schwarz Information Criteria-SIC) for both the dependent and independent variables. Hence, the model deployed is given as:
∆lCO2 t = ϕ ECt + ∑ β, t Δ X t − j + ∑ λ j Δ 2 t − j + ε t (3)
where ECt = lCO2t-1 – X t θ is the error correction term, ϕ is the adjustment coefficients and β is
12
which is iiid ~ N(µ, σ2),the dependent variable CO2t is examined in response to the independent variables Xt = f (lren, lrgdp, ltrade, lmigration, lhealth) using the above model (represented as equation 3). The estimation output of the long-run model specifications is ARDL (5, 1, 1, 4, 2) and the result is contained in Table 3.
<Insert Table 3> 3.2.2 Additional estimations
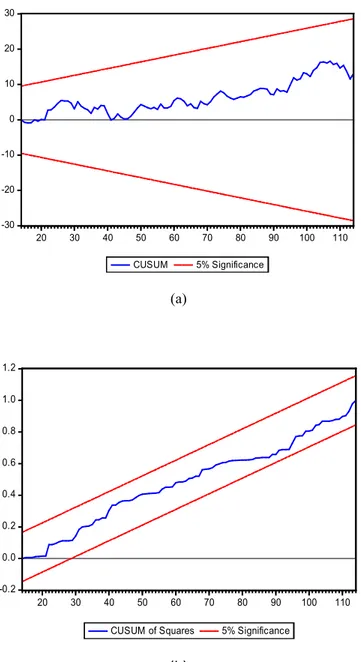
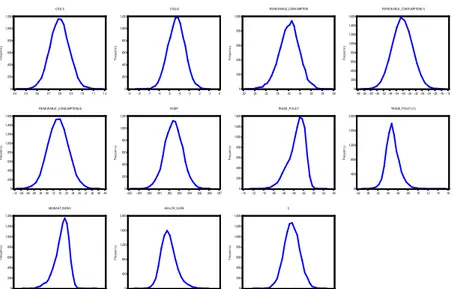
In addition to the dynamic estimation reported above, the bound test that further reveals the long-run relationships and the Wald test which showcases the short-long-run nexus, especially in aggregate term were performed. Also, series of diagnostic tests and robustness check that include the Breusch-Godfrey Serial correlation Langrage Multiplier test, Breusch-Pagan-Godfrey Heteroskedasticity test, residual diagnostic (results included in Table 3), and stability tests (see Figure 1) were performed. A normality test by Jarque-Bera which is visually supported by the Bootstrapped standard error estimate is indicated in Figure 2. In addition, the time series Granger causality further suggests the direction of impacts (the result is not supplied in the text because of page restriction).
<Figure 1> <Figure 2> 4. Empirical results and discussion
Insight from the descriptive statistics of Table 1 reflects the significant change in the examined policies during the period under investigation. Carbon dioxide emissions, renewable energy consumption, and the real GDP did not change as much as the three policy indicators. As observed in the difference between their maximum and minimum values, there have been significant changes in these policies over the period of 1990: Q1 to 2018: Q2. For instance, there
13
are significant differences between the means and medians, and between the maximum and minimum values of the policy indicators. Also, the policies exhibit leptokurtic distribution, thus the US is susceptible to policy direction through the framework of trade, immigration and health. Obviously, the statistical evidence of the common statistics suggests more inferential interpretation from the subsequent estimations. Revelation from the Zivot-Andrew unit root test (see Table 2) indicate a strong statistical significance for structural breaks in specific quarters within the period 1995Q3-2008Q1. This evidence corroborates the distinct observations prior to 2007 and after 2007 events in the study of Earl, Hickey and Rieder (2017. Also, the discussion on climate change took a center-stage in this period. For instance, the period is marked with the publication of consensus report on climate change science, international commitment to drafting a successor to the Kyoto protocol, and other significant structural change. Giving the empirical evidence of cointegration by Johansen and Juselius (1990) (see Table A in the appendix), we perform the ARDL estimations. Hence, we found empirical evidence of quarterly correction of the model (ECT is significant and adjust faster at 60.6%). This statistical evidence implies that the US Carbon dioxide emissions respond in the long-run (with elasticity) by 0.3235, 0.1089, 0.0113, 0.0001, and 0.0117 to the renewable energy consumption, real gross domestic product, trade policy, migration policy, and healthcare respectively. The aforesaid responsiveness of the carbon dioxide emission to the observed change in the dependent variables are all positive. The short-run relationships are also positive except between carbon dioxide emission and trade policy. In both short and long-run relationships, although positive in impact, healthcare policy is not a significant indicator of carbon emission in the US. For trade policy, the impact is significant in the immediate period but the relationship is not significant in the long-run. In another word, the relationship is time-variant and which could depend on other factors as earlier
14
indicated by Feng et. (2015). However, the result implies that economic growth (GDP) and immigration policy rather causes environmental degradation in both the short and long-run. This result is consistent with the US income per capita and CO2 nexus in Soytas et al. (2007) and
Sarkodie & Strezov (2018b), and the immigration-CO2 dynamics in Earl, Hickey and Rieder (2017). Additionally, the bound testing indicates statistical significance with F-statistic of 8.8270 (rejecting the null hypothesis of no cointegration) beyond the upper bound value. On the other hand, the Wald test (for short-run evidence) corroborates short-run evidence earlier indicated i.e F-statistic and chi-square are 28.1407 and 140.7036 at 1% significant level respectively.
Importantly, statistical evidence indicates that there is no evidence of potential spurious estimation associated with the model that is usually caused by serial correlation and heteroskedasticity. Giving that the chi-square values of Table 3 for the Breusch-Godfrey Serial correlation Lagrange Multiplier test and Breusch-Pagan-Godfrey H test are 0.9142 and 0.1737 respectively, it then suffices that there is no serial correlation and heteroskedasticity problem in the investigation. Also, the residual diagnostic (i.e skewness = 0.0177 and normal by Jarque-Bera = 1.8310) of Table 3 is desirable. Lastly, using the time series Granger causality test, statistical evidence reveals that there is Granger causality from RE consumption by industrial and transportation sector to real disposable personal income with feedback. The same is observed from the real disposable personal income to the electric and power sector but without feedback. 5. Concluding remarks
Like it is on the global environmental outlook, environmental issues in the United States are of increasing importance especially with linkage with a handful of the country’s policy frameworks. On this note, this study investigates the dynamic impacts of trade policy, migration index and the health care on carbon dioxide emissions in the US during the period 1990: Q1 to 2018: Q2.
15
Notwithstanding, renewable energy consumption and real gross domestic product were additionally incorporated in the model to measure the dynamic response of carbon dioxide emissions.
Although there exist contrasting views on the environmental Kuznets curve hypothesis in regard to the poor and rich countries (Dasgupta, Laplante Wang & Wheeler, 2002; Prakash & Potoski, 2006; Koo & Kim, 2018, Sarkodie & Strezov, 2018b), the current study has added strong significant evidence in the case of the US. The supporting evidence of this study posits positive interactions between the real gross domestic product (economic growth) and the carbon dioxide emissions in the US for the long-run and short-run circumstances. Similar to the study of Ang (2009) on China which is also a developed country and Apergis, Jebli & Youssef, (2018), the current study indicates that GDP leads to more CO2 emissions. Also, Dogan & Turkekul (2016)
which employed old time period (1960-2010) compare to the current one (1990:Q1-2018: Q2) found an inverse relationship between the duo. Their result is similar to Sarkodie & Strezov, 2018b which also failed to establish evidence of environmental Kuznets curve (EKC) hypothesis in the United States. The account of the positive relationship between the real GDP and CO2
emissions in the US as applied in this study could strongly be associated with the persistent growth in the country’s GDP especially in recent times as it is also the case for China (Ang, 2009). In the same light, Dogan and Turkekul (2016) found a positive and long-run relationship between carbon dioxide emissions and energy consumption. Although this study employed renewable energy consumption as a sub-energy classification, the long-run evidence is positive and significant, the same as its short-run relationship. A contrasting evidence from a panel of sub-Saharan African countries by Apergis, Jebli and Youssef (2018) show that renewable energy consumption is observed to cause a reduction in the carbon dioxide emissions in the long-run.
16
This account of sub-Saharan African countries is expected due to lower utilization especially of renewable sources for mega purposes like in the industrial and production sectors in the case of the United States.
Additionally, the current study posits an insignificant positive dynamic (and long-run) relationship between CO2 emissions and trade policy in the US. The indicative short-run
relationship implies that improved trade policy leads to a better environment, but the long-run assertion negates Dogan and Turkekul (2016). Also, although the World development indicator implies that the USA is one of the top countries with trade openness, the recent development in the country’s trade policy could have caused the paradigm shift in its trade-environmental relationship.
In this study, the long-run and short-run relationship between the CO2 emissions and the
migration index are positive and significant. The evidence which does not deviate from extant literature also corroborates Dogan and Turkekul (2016) which opined that urbanization increases environmental degradation in the United States. Also, although the health care of the United States is positively related to carbon dioxide emissions in the long-run and short-run, the evidence is insignificant.
Very recently, the policies of the current government of the United States, especially on trade and migration, has continued to generate concerns among interest groups. Policy on trade is observed to impact the country’s sectors especially the manufacturing, industrial, transportation, and production. Hence, the desirable short-run empirical observation should be sustained such that the country’s trade policy is tailored toward the reduction of CO2 emissions. For instance, in
New Mexico, the Senate Bill 43 mandates investor-owned electric utilities to generate or increasingly purchase amounts of renewable energy (Mozumder, Vasquez & Marathe, 2011).
17
Also, the current Trade Policy and Negotiations (TPN) of the United States which advances the country’s trade policy to the advantage of American workers, farmers, and businesses are believed to be consistent with the US national security and foreign policy priorities (US Department of State, 2018). In addition to opening up the economy, the sustainability of such a policy will cause a continued reduction in carbon dioxide emissions. Also, in cutting back carbon dioxide emissions in the United States, the country’s policy on migration is a significant instrument. The complexity associated with migration pattern especially in the case of the US should be engaged using a holistic approach. Such an effective policy will potentially address the current imbalance between the biocapacity per person and the ecological footprint per person in the country, thus leading to sustainable development. Although the implementation of some of the policies could generate a backlash, the direction of such policies would justify the original intention of the government and possibly correct any associated misconception.
For future study, the investigation could underpin a state-level or metropolitan statistical areas (MSA) of the United States since policy direction could vary across the states. Another econometric approach, such as examining possible asymmetric relationship or regime inference would further underpin the significance of the research idea.
Funding
I hereby declare that there is no form of funding received for this study.
Compliance with Ethical Standards
The author wishes to disclose here that there are no potential conflicts of interest at any level of this study Reference
Al-Mulali, U., & Che Sab, C. N. B. (2018). Electricity consumption, C02 emission, and economic growth in the Middle East. Energy Sources, Part B. Economic, Planning, and Policy, 13(5), 257-263. doi.org/10.1080/15567249.2012.658958.
18
Al-Mulali, U., Tang, C. F., & Ozturk, I. (2015). Does financial development reduce environmental degradation? Evidence from a panel study of 129 countries. Environmental Science and Pollution Research, 22(19), 14891-14900.
Alola, A. A., & Alola, U. V. (2018). Agricultural land usage and tourism impact on renewable energy consumption among Coastline Mediterranean Countries. Energy & Environment, 0958305X18779577. doi.org/10.1177/0958305X18779577.
Ang, J. B. (2009). CO2 emissions, research, and technology transfer in China. Ecological Economics, 68(10), 2658-2665.
Apergis, N., Jebli, M. B., & Youssef, S. B. (2018). Does renewable energy consumption and health expenditures decrease carbon dioxide emissions? Evidence for sub-Saharan Africa countries. Renewable Energy, 127, 1011-1016.
Apergis, N., & Payne, J. E. (2017). Per capita carbon dioxide emissions across US states by sector and fossil fuel source: Evidence from club convergence tests. Energy Economics, 63, 365-372.
Chandia, K. E., Gul, I., Aziz, S., Sarwar, B., & Zulfiqar, S. (2018). An analysis of the association among carbon dioxide emissions, energy consumption and economic performance: an econometric model. Carbon Management, 1-15.
Bin, S., & Dowlatabadi, H. (2005). Consumer lifestyle approach to US energy use and the related CO2 emissions. Energy policy, 33(2), 197-208. doi.org/10.1016/S0301-4215 (03)00210-6.
British Petroleum (BP, 2018). BP Statistical Review of World Energy. https://www.bp.com/en/global/corporate/energy-economics/statistical-review-of-world-energy/downloads.html. (Accessed 1st September 2018).
19
Camarota, S. A., & Kolankiewicz, L. (2008). Immigration to the United States and worldwide greenhouse gas emissions. Center for Immigration Studies Backgrounder, 1-11.
Dasgupta, S., Laplante, B., Wang, H., & Wheeler, D. (2002). Confronting the environmental Kuznets curve. Journal of economic perspectives, 16(1), 147-168.
Department of States (US, 2018). Trade Policy and Negotiations. https://www.state.gov/e/eb/tpn/. (Accessed 1st September 2018).
Dickey, D. A., & Fuller, W. A. (1979). Distribution of the estimators for autoregressive time series with a unit root. Journal of the American statistical association, 74(366a), 427-431.
Dogan, E., & Turkekul, B. (2016). CO 2 emissions, real output, energy consumption, trade, urbanization, and financial development: testing the EKC hypothesis for the USA. Environmental Science and Pollution Research, 23(2), 1203-1213.
Dogan, E., & Ozturk, I. (2017). The influence of renewable and non-renewable energy consumption and real income on CO 2 emissions in the USA: evidence from structural break tests. Environmental Science and Pollution Research, 24(11), 10846-10854.
Dong, Y., & Zhao, T. (2017). Difference analysis of the relationship between household per capita income, per capita expenditure and per capita CO2 emissions in China: 1997– 2014. Atmospheric Pollution Research, 8(2), 310-319.
Earl, J., Hickey, C., & Rieder, T. N. (2017). Fertility, immigration, and the fight against climate change. Bioethics, 31(8), 582-589.
Emir, F., & Bekun, F. V. (2018). Energy intensity, carbon emissions, renewable energy, and economic growth nexus: New insights from Romania. Energy & Environment, 0958305X18793108.
20
Energy Information Administration (US EIA, 2018). The United States energy consumption by sources, 2017. https://www.eia.gov/energyexplained/index.php?page=about_home. Economic Policy Categorical Index (2018). http://www.policyuncertainty.com/ .
Farhani, S., & Ozturk, I. (2015). The causal relationship between CO 2 emissions, real GDP, energy consumption, financial development, trade openness, and urbanization in Tunisia. Environmental Science and Pollution Research, 22(20), 15663-15676.
Feng, K., Davis, S. J., Sun, L., & Hubacek, K. (2015). Drivers of the US CO 2 emissions 1997– 2013. Nature communications, 6, 7714.
Fitzgerald, J. B., Schor, J. B., & Jorgenson, A. K. (2018). Working Hours and Carbon Dioxide Emissions in the United States, 2007–2013. Social Forces, 96(4), 1851-1874.
FRED, (2018). Federal Reserve Bank of St. Louis. https://fred.stlouisfed.org/series/DSPIC96. (Accessed 2nd September 2018).
International Renewable Energy Agency, (2018). Renewable Capacity Statistics 2018. http://www.irena.org/publications/2018/Mar/Renewable-Capacity-Statistics-2018.
(Accessed 2nd September 2018).
Jiang, X. T., Wang, Q., & Li, R. (2018). Investigating factors affecting carbon emissions in China and the USA: A perspective of stratified heterogeneity. Journal of Cleaner Production, 199, 85-92.
Johansen, S., & Juselius, K. (1990). Maximum likelihood estimation and inference on cointegration—with applications to the demand for money. Oxford Bulletin of Economics and statistics, 52(2), 169-210.
Kolankiewicz, L. J., & Camarota, S. A. (2008). Immigration to the United States and World-Wide Greenhouse Gas Emissions. Washington, DC: Center for Immigration Studies.
21
Koo, M. G., & Kim, S. Y. (2018). The east Asian way of linking the Environment to trade in free trade agreements. The journal of environment and development, 1070496518794234. Kwiatkowski, D., Phillips, P. C., Schmidt, P., & Shin, Y. (1992). Testing the null hypothesis of
stationarity against the alternative of a unit root: How sure are we that economic time series have a unit root? Journal of Econometrics, 54(1-3), 159-178. doi.org/10.1016/0304-4076 (92)90104-Y.
Li, J., Huang, X., Yang, H., Chuai, X., Li, Y., Qu, J., & Zhang, Z. (2016). Situation and determinants of household carbon emissions in Northwest China. Habitat international, 51, 178-187.
Mozumder, P., Vasquez, W. F.., & Marathe, A. (2011). Consumer’s preference for renewable energy in the Southwest USA. Energy Economics, 33(66): 1119-1126. doi.org/10.1016/j.eneco.2011.08.003.
Sarkodie, S. A., & Strezov, V. (2018a). A review on Environmental Kuznets Curve hypothesis using bibliometric and meta-analysis. Science of The Total Environment.
Sarkodie, S. A., & Strezov, V. (2018b). Empirical study of the Environmental Kuznets curve and Environmental Sustainability curve hypothesis for Australia, China, Ghana and USA. Journal of Cleaner Production, 201, 98-110.
Soytas, U., Sari, R., & Ewing, B. T. (2007). Energy consumption, income, and carbon emissions in the United States. Ecological Economics, 62(3-4), 482-489.
Pesaran, M. H., Shin, Y., & Smith, R. J. (2001). Bounds testing approaches to the analysis of level relationships. Journal of applied econometrics, 16(3), 289-326.
Prakash, A., & Potoski, M. (2006). Racing to the bottom? Trade, environment governance, and ISO 14001. American Journal of political science, 50(2), 350-364.
22
The White House (TWH). (2017). Statement by President Trump on the Paris Climate Accord. https://www.whitehouse.gov/briefings-statements/statement-president-trump-paris-climate-accord/. (Accessed 2 November 2018).
UNFCC, C. (2015). Paris agreement. FCCCC/CP/2015/L. 9/Rev.1. (Accessed 2nd September 2018).
The United States Environmental Protection Agency (EPA). (2018). Progress Cleaning the Air and Improving People’s Health. https://www.epa.gov/clean-air-act-overview/progress-cleaning-air-and-improving-peoples-health. (Accessed 2 November 2018).
World Health Organization (WHO, 2015). Health in the Green Economy: Co-benefits to Health of Climate Change Mitigation: Household Energy Sector in Developing Countries. http://www.who.int/hia/green_economy/en/. (Accessed 2nd September 2018).
Wei, Y. M., Liu, L. C., Fan, Y., & Wu, G. (2007). The impact of lifestyle on energy use and C02 emission. An empirical analysis of China’s residents. Energy policy, 35(1), 247-257. doi.org/10.1016/j.enpol.2005.11.020.
Zivot, E. & D. W. K. Andrews, (1992). “Further evidence on the Great Crash, the oil-price shock, and the unit root hypothesis.” Journal of Business and Economic Statistics 10, 251-270
Zhou, C., Wang, S., & Feng, K. (2018). Examining the socioeconomic determinants of CO2 emissions in China: A historical and prospective analysis. Resources, Conservation and Recycling, 130, 1-11.
Zhu, H., Tang, Y., Peng, C., & Yu, K. (2018). The heterogeneous response of the stock market to emission allowance price: evidence from quantile regression. Carbon Management, 1-13.
23
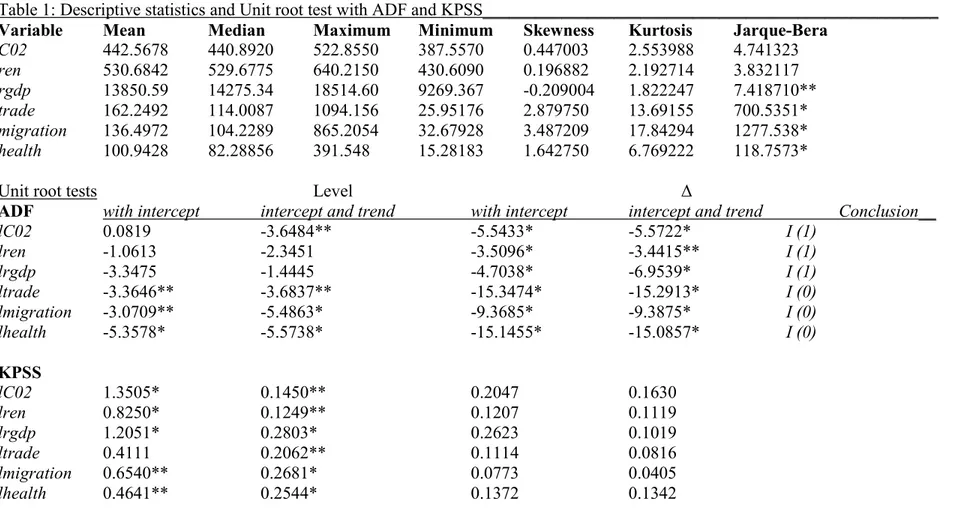
Table 1: Descriptive statistics and Unit root test with ADF and KPSS____________________________________________________ Variable Mean Median Maximum Minimum Skewness Kurtosis Jarque-Bera
C02 442.5678 440.8920 522.8550 387.5570 0.447003 2.553988 4.741323 ren 530.6842 529.6775 640.2150 430.6090 0.196882 2.192714 3.832117 rgdp 13850.59 14275.34 18514.60 9269.367 -0.209004 1.822247 7.418710** trade 162.2492 114.0087 1094.156 25.95176 2.879750 13.69155 700.5351* migration 136.4972 104.2289 865.2054 32.67928 3.487209 17.84294 1277.538* health 100.9428 82.28856 391.548 15.28183 1.642750 6.769222 118.7573*
Unit root tests Level ∆
ADF with intercept intercept and trend with intercept intercept and trend Conclusion__
lC02 0.0819 -3.6484** -5.5433* -5.5722* I (1) lren -1.0613 -2.3451 -3.5096* -3.4415** I (1) lrgdp -3.3475 -1.4445 -4.7038* -6.9539* I (1) ltrade -3.3646** -3.6837** -15.3474* -15.2913* I (0) lmigration -3.0709** -5.4863* -9.3685* -9.3875* I (0) lhealth -5.3578* -5.5738* -15.1455* -15.0857* I (0) KPSS lC02 1.3505* 0.1450** 0.2047 0.1630 lren 0.8250* 0.1249** 0.1207 0.1119 lrgdp 1.2051* 0.2803* 0.2623 0.1019 ltrade 0.4111 0.2062** 0.1114 0.0816 lmigration 0.6540** 0.2681* 0.0773 0.0405 lhealth 0.4641** 0.2544* 0.1372 0.1342
Note: Level and ∆ respectively indicates estimates at the level and the first difference with automatic lag selection by SIC (maxlag=13) for the ADF (Augmented Dickey-Fuller) and KPSS () unit root test. * and ** are statistical significance at 1% and 5% level. Number of observation is 181
24
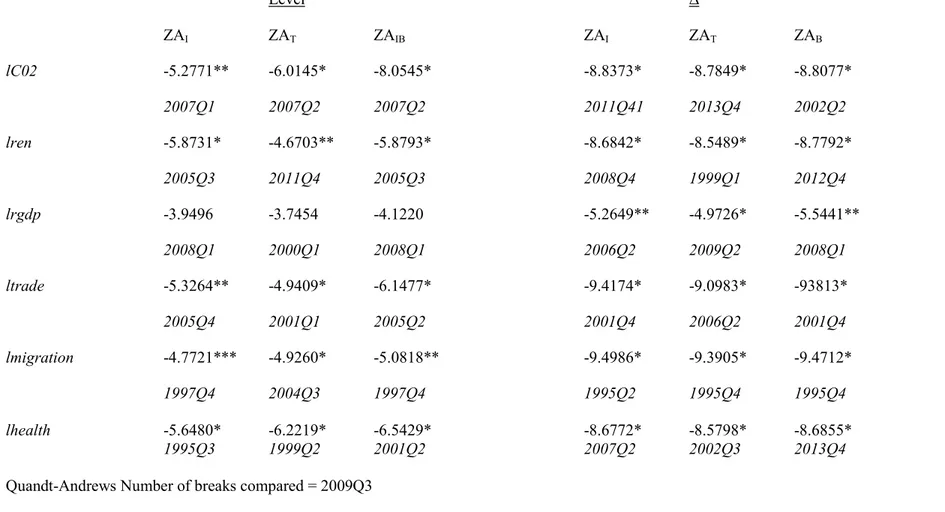
Table 2: Zivot-Andrew (ZA) unit root test under single structural break____________________________________________________________
Level ∆ ZAI ZAT ZAIB ZAI ZAT ZAB lC02 -5.2771** -6.0145* -8.0545* -8.8373* -8.7849* -8.8077* 2007Q1 2007Q2 2007Q2 2011Q41 2013Q4 2002Q2 lren -5.8731* -4.6703** -5.8793* -8.6842* -8.5489* -8.7792* 2005Q3 2011Q4 2005Q3 2008Q4 1999Q1 2012Q4 lrgdp -3.9496 -3.7454 -4.1220 -5.2649** -4.9726* -5.5441** 2008Q1 2000Q1 2008Q1 2006Q2 2009Q2 2008Q1 ltrade -5.3264** -4.9409* -6.1477* -9.4174* -9.0983* -93813* 2005Q4 2001Q1 2005Q2 2001Q4 2006Q2 2001Q4 lmigration -4.7721*** -4.9260* -5.0818** -9.4986* -9.3905* -9.4712* 1997Q4 2004Q3 1997Q4 1995Q2 1995Q4 1995Q4 lhealth -5.6480* -6.2219* -6.5429* -8.6772* -8.5798* -8.6855* 1995Q3 1999Q2 2001Q2 2007Q2 2002Q3 2013Q4
Quandt-Andrews Number of breaks compared = 2009Q3
Note: Level and ∆ respectively indicates estimates at the level and first difference. Automatic lag selection by SIC (maxlag=24) for unit root test and maxlag=4 for ZA). ZA is the Zivot & Andrews (1992) for a unit root structural break test where ZAI, ZAT & ZAB are an intercept, trend and intercept with the trend of ZA estimates.
25
Table 3: Dynamic ARDL estimate__________________________________________________ Long-run
lren lrgdp ltrade lmigration lhealth c_____
β 0. 3235 0.1089 0.0113 0.0001 0.0117 2.9000 p-val. 0.005* 0.008* 0.322 0.015** 0.283 0.000* Short-run β 0. 4743 0.0660 -0.0127 0.00008 0.0071 p-val. 0.000* 0.015** 0.062*** 0.016** 0.283 ECT (-1) -0.6061 p-value 0.0000*
R 0.7564 Sum error of regression = 0.0374
R-square 0.7323 F-statistic = 31.3603 (0.0000)
Bound test (long-run evidence)
I0 I1
1% 3.41 4.68
F-statistics = 8.8270*
Wald test (short-run estimate) F-statistic 28.1407*
p-value 0.0000
χ2 140.7036*
p-value 0.0000
Residual diagnostics
Breusch-Godfrey SR LM test Breusch-Pagan-Godfrey H test
χ2 (p-value) 0.9142 0.1737
Normal (Jarque-Bera) 1.8310 (0.400)
Skewness 0.0177
Kurtosis 2.3746
Note: Autoregressive Distributed Lad (ARDL) model employed is (2, 2, 0, 1, 0, 0), β is the coefficient of the regressors, the p-value is the probability value and ECT is the Error Correction Term also known as the adjustment parameter. The I0 and I1 are lower and upper bound of the bound test respectively, χ2 is the Chi-square, SR LM is Serial correlation Lagrange Multiplier and H is Heteroskedasticity.
26 -30 -20 -10 0 10 20 30 20 30 40 50 60 70 80 90 100 110 CUSUM 5% Significance (a) -0.2 0.0 0.2 0.4 0.6 0.8 1.0 1.2 20 30 40 50 60 70 80 90 100 110
CUSUM of Squares 5% Significance
(b)
27 0 200 400 600 800 1,000 1,200 0.4 0.5 0.6 0.7 0.8 0.9 1.0 1.1 1.2 F re q u en c y CO2(-1) 0 200 400 600 800 1,000 1,200 -.9 -.8 -.7 -.6 -.5 -.4 -.3 -.2 -.1 .0 F re q u en c y CO2(-2) 0 200 400 600 800 1,000 .20 .25 .30 .35 .40 .45 .50 .55 .60 F re q u en c y RENE WABLE_CONSUMPTION 0 200 400 600 800 1,000 1,200 1,400 1,600 -.68 -.64 -.60 -.56 -.52 -.48 -.44 -.40 -.36 -.32 -.28 -.24 -.20 -.16 -.12 F re q u en c y
RENEWAB LE_CONS UMPTION(-1)
0 200 400 600 800 1,000 1,200 1,400 1,600 -.12 -.08 -.04 .00 .04 .08 .12 .16 .20 .24 .28 .32 .36 .40 .44 F re q u e nc y RENEWABLE _CONSUMPTION(-2) 0 200 400 600 800 1,000 1,200 -.002-.001.000.001.002.003.004.005.006.007 F re q u e nc y RGDP 0 200 400 600 800 1,000 1,200 1,400 -.14 -.12 -.10 -.08 -.06 -.04 -.02 .00 .02 .04 F re q u e nc y TRADE _POLICY 0 400 800 1,200 1,600 2,000 -.02 .00 .02 .04 .06 .08 .10 .12 .14 .16 F re q u e nc y TRADE_POLICY(-1) 0 200 400 600 800 1,000 1,200 1,400 -.08-.06-.04-.02.00.02.04.06 .08.10.12.14 F re qu e n cy MIGRANT_INDEX 0 400 800 1,200 1,600 2,000 -.12 -.08 -.04 .00 .04 .08 .12 .16 .20 F re qu e n cy HEA LTH_CA RE 0 200 400 600 800 1,000 1,200 1,400 -40 0 40 80 120 160 200 240 280 320 F re qu e n cy C
28 Appendix
Table A. Johansen Cointegration test________________________________________________ No. of cointegration equation Trace test Maximum Eigenvalue test__
None 162.0891* 54.8194* (0.0000) (0.0005) At most 1 107.2697* 47.8442* (0.0000) (0.0068) At most 2 59.4255* 30.9484* (0.0005) (0.0067) _____________________________________________________________________________ Note: The estimate adopts the SIC (maximum lag = 1). * indicate statistical significance level of 1%.