https://dergipark.org.tr/tr/pub/bursauludagziraat http://www.uludag.edu.tr/ziraatdergi
Haziran/2020, 34(1), s. 167-184
ARAŞTIRMA MAKALESİ RESEARCH ARTICLE
Geliş Tarihi (Received): 23.07.2019 Kabul Tarihi (Accepted): 11.02.2020
Regional Energy Production with Small Wind Turbines with
Concentrator Systems in Nort-West Turkey
Tuğba BİÇEN
1, Ali VARDAR
2*Abstract: In this study, Eastern Thrace located in the northwest of Turkey, the southern regions of the Marmara Sea, and Istanbul were selected as the research area. Current energy potential analyzes were performed with the wind speed data in 13 stations determined in the region and the wind characteristics of the region formed the material of the study. In this research, especially small wind turbines and condensing systems that can be integrated into these turbines were discussed. On the basis of regional wind characteristics, the energy quantities of small wind turbines integrated with condensing and without condensing systems were determined. In this context, while a regional average of 252 to 1852 kWh/year energy can be generated from a 2 kW wind turbines with a non-condensing system integrated, it has been determined that 513 to 2085 kWh/year of energy can be generated from wind turbines integrated with A-type condensing systems. 1686 to 3684 kWh/year energy could be generated from wind turbines integrated with B-type condensing systems was determined. A similar situation exists for wind turbines with different power ratings.
Keywords: Renewable energy, wind energy; concentrator systems, Turkey.
*
Sorumlu yazar/Corresponding Author:2Ali VARDAR, Bursa Uludağ University, Faculty of Agriculture, Department of Biosystems Engineering, 16059 Bursa, Turkey, [email protected], OrcID: 0000-0001-6349-9687
1
Tuğba BİÇEN, Bursa Uludağ University, Institute of Natural and Applied Science, Department of Biosystems Engineering, 16059 Bursa, Turkey, [email protected], OrcID: 0000-0001-6826-2494
Atıf/Citation: Biçen, T. ve Vardar, A. 2020. Regional Energy Production with Small Wind Turbines with Concentrator Systems in Nort-West Turkey. Bursa Uludag Üniv. Ziraat Fak. Derg., 34(1), s. 167-184.
Kuzey-
Batı Türkiye'de Yoğunlaştırma Sistemli Küçük Rüzgâr Türbinleri ile
Bölgesel Enerji Üretimi
Öz: Bu çalışmada, Türkiye’nin kuzey batısında yer alan doğu Trakya, Marmara denizinin güney bölgeleri ve İstanbul araştırma bölgesi olarak seçilmiştir. Bölgede belirlenen 13 istasyonda rüzgâr hızı verileri ile mevcut enerji potansiyeli analizleri yapılmış ve bölgenin rüzgâr karakteristikleri çalışmanın materyalini oluşturmuştur. Araştırmada özellikle küçük rüzgar türbinleri ve bu türbinlere entegre edilebilecek yoğunlaştırma sistemleri ele alınmıştır. Bölgesel rüzgar karakteristikleri temelinde, yoğunlaştırma sistemleri entegre edilmiş ve entegre edilmemiş durumdaki küçük rüzgar türbinlerinin üretebilecekleri enerji miktarları saptanmıştır. Bu çerçevede yoğunlaştırma sistemi entegre edilmemiş 2 kW gücünde bir rüzgar türbinlerinden bölgesel ortalama olarak 252 ile 1852 kWh/yıl enerji üretilebilirken A-tipi yoğunlaştırma sistemleri ile entegre edilmiş bir rüzgar türbinlerinden 513 ile 2085 kWh/yıl ve B-tipi yoğunlaştırma sistemleri ile entegre edilmiş bir rüzgar türbinlerinden ise 1686 ile 3684 kWh/yıl enerji üretilebileceği tespit edilmiştir. Farklı güç değerlerine sahip rüzgâr türbinleri için de benzer bir durum söz konusudur.
Keywords: Yenilenebilir enerji, rüzgar enerjisi, yoğunlaştırma sistemleri, Türkiye.
Introduction
Today's technology is developing at an incredible pace. With the developing technology, more energy demand is on the agenda. Nowadays, the commonly used energies are fossil fuel based energies. The uncontrolled use of such energy sources also leads to various environmental problems and all living things in nature are adversely affected by this situation. In order to minimize these problems, intensive studies are needed to use cleaner energy sources and to ensure the more efficient use of fossil fuels.
Although energy demand can be met from fossil-based energy sources in today's conditions, it is inevitable to turn to natural energy sources that can be considered as inexhaustible. Because the speed of development of technology will exceed the speed of production of fossil-based energies and will cause a limited amount of reserves to be insufficient. World countries have to provide diversity in energy production, taking into account this fact.
Meeting the energy needs with renewable energy technologies and particularly wind energy is an advantage in terms of both a sustainable environment and energy costs. Nowadays, wind turbines with different characteristics which are generally horizontal axis wind turbines and vertical axis wind turbines are used for commercial purposes.
Wind turbines, which produce electricity directly and are especially small-scale, are available for many purposes in commercial enterprises. These areas of use can be considered as all activities in which electrical use, such as heating, cooling, lighting, etc. are concerned.
Increasing energy production with wind turbine rotor diameter increases (Karameldin et al. 2002) is an indisputable reality. This situation can be seen easily by examining the power curves (Seo et al. 2019). However, this increase in rotor diameter will also increase the investment cost, resulting in more power per unit area than the cost per unit area. In this context, energy costs in wind turbines (Samal and Tripathy 2019; Clark et al. 2019) and studies to minimize these costs are also included in the literature (Chen et al. 2018).
Another function of the increase in energy production in wind turbines is the wind speed potential in the location (Lui et al. 2019; Bencuya İpekçioğlu and Vardar 2017). When we examine Turkey; Although the wind potential is high, this potential is not distributed to all regions regularly. While Turkey's wind power potential is concentrated in some areas, in many areas there is not the potential for a favorable wind for large wind turbines. Turkey's only 2% portion, has a high potential for wind speed (Acaroğlu 2003; Vardar et al. 2015). Therefore, especially in order to meet their own energy needs from wind energy, commercial enterprises need to develop wind turbine systems that can benefit from low wind potentials (Darwish et al. 2019). One of the technologies that can meet this requirement is the integration of wind turbines and wind condensation systems.
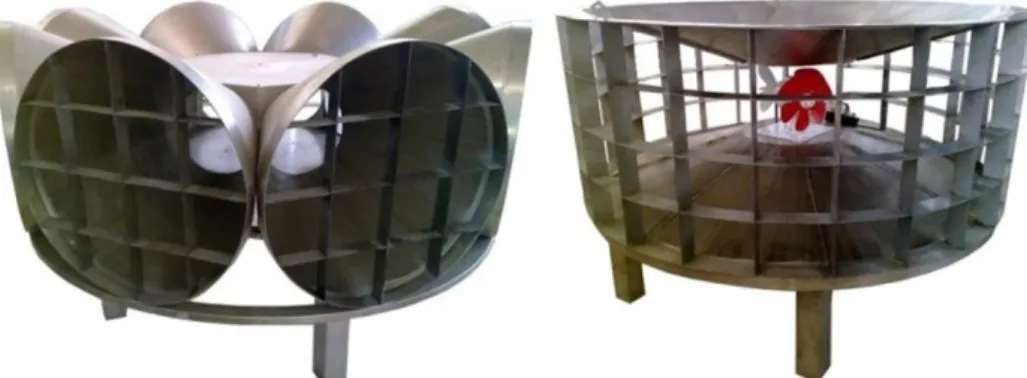
In concentrator wind turbines; The wind velocity and power in the inlet cross-sectional area of the condensation system and the wind speed and power on the wind turbine has a statistically significant relationship. This relationship is in the direction of the increase of wind speed and wind power on the wind turbine with the increase of wind speed in the input cross-section. According to Vardar et al. (2015) the wind rate on the wind turbine, depending on the wind speed in the entrance section, has been calculated on the average of the rate of increase (efficiency). Approximately 81% of the conic wind condensation system, 71% of the paneled wind condensing system and 90% of the windless condensation system without panels are given (Fig. 1).
Fig. 1: A-Type wind condensation system (Vardar et al. 2015)
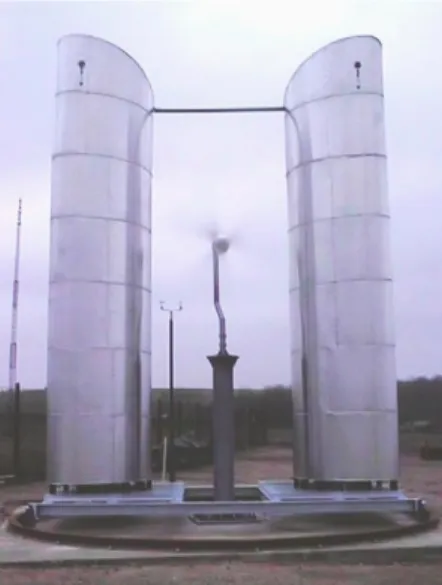
The yields for a different condensing system (Figs. 2-3); in another study, 1 to 1,2 times for HAWT (Horizontal Axis Wind Turbine) and 2 times for VAWT (Vertical Axis Wind Turbine) is given as a power
increase (Energy Research Unit 2001). The power increase in condensation systems depends on the amount of contraction between the input cross-section of the condensing system and the cross-section near the wind turbine.
Fig. 2:B-Type wind condensation system
Fig. 3:B-Type wind condensation systems (Dörner 2019)
In this study, wind energy potential and wind characteristics have been determined by considering previous studies. Wind potential and wind characteristics of the selected region constitute the material of the research. As wind energy potential from ground level 2 and 30 m high, wind speed and wind power density values were taken into consideration. As wind characteristics, wind speed, wind power density, wind speed and wind power density changes as from years and months, frequency (%) distribution of wind speed and the prevailing wind directions are taken into consideration.
Another material of the research is especially small wind turbines and that can be integrated into condensation systems these turbines.
The main objective of this study is to determine the amount of energy that small wind turbines can produce by integrated and non-integrated with wind condensation systems on the basis of regional wind characteristics. In this context, it is aimed to reveal the effect of wind condensation systems on energy production.
Material and Method
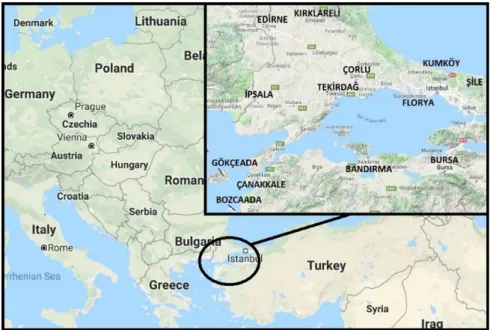
Site and Data DescriptionResearch for the selected region is located in north western Turkey. To the northwest of the region is Bulgaria, to the west with Greece and the Aegean Sea and in north the Black Sea. The region is located to the east and south interior regions of Turkey.
This work has utilised from meteorological data obtained from 13 meteorological stations in Turkey in the northwest. These stations are Edirne, Ipsala, Kirklareli, Tekirdag, Corlu, Kumkoy, Florya, Sile, Bursa, Bandirma, Canakkale, Bozcaada and Gokceada meteorological stations. The locations of the stations on the map are shown in Fig. 4.
Fig. 4:The positions of thirteen stations in North-West Turkey on the map (Google Maps 2019)
The 43-year measurements between 1975 and 2017 were taken into consideration in all of the designated stations except Bursa and Şile. In Bursa, 58-year measurements between 1960 and 2017 and 41-year measurements between 1977 and 2017 were evaluated in Şile (TSMS 2018). In the study, the measurements taken to evaluate are the values of wind speed and wind direction as daily average values.
Methodology
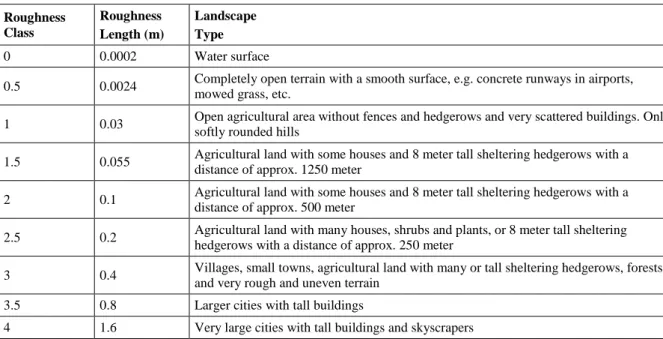
Firstly, 30 m high wind speed values of the stations were calculated. In calculations, the Von Karman constant (Gasch and Twele 2011) was taken as 0.4. Table 1 was taken into account in determining the surface roughness coefficient.
Table 1. Roughness Classes and Roughness Length Table (Vindmolleindustrien 2019)
Roughness Class Roughness Length (m) Landscape Type 0 0.0002 Water surface
0.5 0.0024 Completely open terrain with a smooth surface, e.g. concrete runways in airports, mowed grass, etc.
1 0.03 Open agricultural area without fences and hedgerows and very scattered buildings. Only softly rounded hills
1.5 0.055 Agricultural land with some houses and 8 meter tall sheltering hedgerows with a distance of approx. 1250 meter
2 0.1 Agricultural land with some houses and 8 meter tall sheltering hedgerows with a distance of approx. 500 meter
2.5 0.2 Agricultural land with many houses, shrubs and plants, or 8 meter tall sheltering hedgerows with a distance of approx. 250 meter
3 0.4 Villages, small towns, agricultural land with many or tall sheltering hedgerows, forests and very rough and uneven terrain
3.5 0.8 Larger cities with tall buildings
4 1.6 Very large cities with tall buildings and skyscrapers
The following equation (1) was used in the adaptation of wind speed to 30 m above ground level (Pelletier 2006; Klug 2001).
𝑣(ℎ) =𝑢𝑘∗∙ 𝑙𝑛𝑧ℎ
0 (1)
The changes in the wind speed values, which are adapted to the height of 30 m from the surface of the ground, have been demonstrated. It was also analyzed whether the changes in wind speed values over the years were statistically significant. Correlation coefficients were established for significant changes and the relationship between wind speed and years was modeled mathematically.
In this study, monthly average wind speeds on the basis of years and months, wind power density values on the basis of years and months, frequency (%) distribution of wind speed and direction of wind blowing were made.
In meteorological stations, the average daily recorded measurement values were converted to monthly and yearly average values, the equation (2) and Equation (3) were used (Soysal 2000).
𝑀𝑚=∑ 𝑥𝑛 =𝑥1+𝑥2+𝑥𝑛3+⋯+𝑥𝑛 (2)
With the results of the above mentioned wind potential and characteristics, the annual amount of energy that can be produced with small wind turbines in integrated and non-integrated concencing systems has been designated. The properties of wind turbines and condensing systems discussed in the research are given below.
General information about wind turbines discussed in the scope of the research is given in Table 2. Wind speeds of 10 m height were taken into consideration for turbines with 2 and 10 kW power. For other turbines, wind speeds of 30 m height were used.
Table 2. Wind turbine specifications (Hummer 2019)
Wind Turbine Kode WT-2 WT-10 WT-50 WT-100 WT-200
Power (kW) 2 10 50 100 200
Hub hight (m) 10 10 30 30 30
Cut-in wind speed (ms-1) 3 3 3,5 2,5 2,5
Cut-out wind speed (ms-1) 25 25 20 20 20
Working wind speed (ms-1) 3-25 3-25 1,5-20 1,5-20 1,5-20
In the scope of the research, in condensing systems, especially for wind turbines with 2 and 10 kW power, wind speeds at ground level (2 m) were calculated by taking into consideration. The use of these turbines with A-type and B-type condensing systems was calculated separately. For other wind turbines, it is assumed that the larger size (B-Type) condensation systems are used. The efficiency of condensation systems was accepted (Vardar et al. 2015) as 71%. Power increase in condensation systems depends on the amount of contraction between the input cross-section of the condensing system and near section the wind turbine. In this study, section narrowing was considered as 2:1.
Results and Discussion
Wind speed analysis
When the average wind speed values of the stations in the region at 30 m above ground level are examined the data obtained from Kırklareli and Edirne are below the value of 5 m/s wind speed. The highest annual average wind velocities were 9 m/s, 8.7 m/s and 8.3 m/s in Bozcaada, Bandırma and Çanakkale stations, respectively.
"Turkey Wind Atlas" study was conducted by Turkey Electrical Power Resources Survey and Development Administration. The average wind speeds; 5 m/s in Bursa, 6 m/s in Edirne and Kırklareli, 7 m/s in İpsala, Tekirdağ, Kumköy and Şile, and 7,5 m/s in Çorlu and Florya, Bandırma, Çanakkale, in Bozcaada and Gökçeada, 9 m/s is given (EIE 2005).
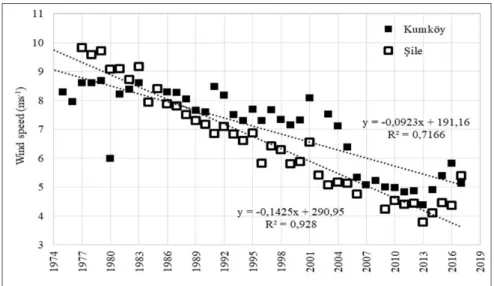
According to the results of the research is another point; The average annual wind speed values in the entire research region are approximately horizontal while the wind speeds in Kumköy and Şile are decreasing with time. As a result of the statistical analysis on the decrease of the wind speed over time, the correlation coefficient
was also remarkable. Correlation coefficient values and mathematical decrease models related to decreasing wind speed over time are given in Fig. 5. This decrease in wind speed averages is considered to be due to the building in the region.
Fig. 5:Variation of annual mean wind speed at 30 m above ground level by Şile and Kumköy
When the literature is examined (Tian et al. 2019), in a study covering the years 1979-2016, found that superficial wind velocities in most northern Hemisphere regions, including North America, Europe and Asia, decreased in the last 40 years. According to the study; Approximately 30%, 50% and 80% of the stations considered have lost 30% of the wind energy potential in North America, Europe and Asia since 1979, respectively. Weber et al. (2018) supports similar results in the study. Santos et al. (2015) discussed changes in wind energy potentials in Iberia. Wang et al. (2004) and Jiang et al. (2013) reported that the wind speed in China has decreased in the last 50 years. Shi et al. (2015), the study of the different regions of China has discussed the change of wind speed. In the article, it is evaluated that the change in wind speed is related to factors such as climate change, decrease of forests and increase in general temperature.
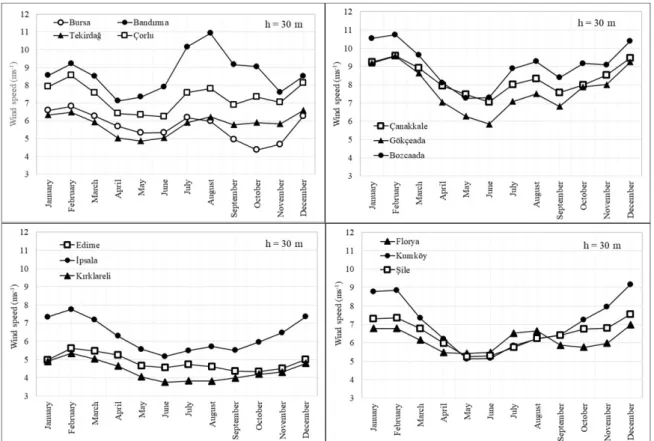
Fig. 6 shows the seasonal variation of wind speed values. As can be seen from the figure, the highest average wind speed values in autumn, winter, and spring months were determined in Bozcaada and the highest wind speed values in summer months were designed in Bandırma.
In the literature, it is possible to find different results seasonally. Rehman et al. (2007), did not notice a difference between months in their study in Rafha (Saudi Arabia). Marciukaits et al. (2008), in their study in the Klaipeda region of Lithuania, in April, May, June and July have found lower wind speeds compared to other months.
Wind speed frequency distribution
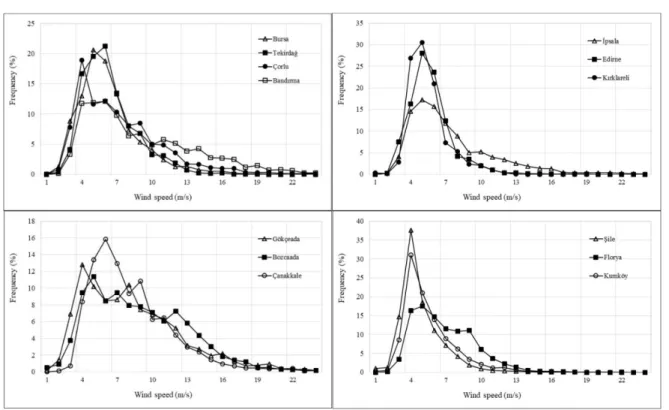
Fig. 7 shows the wind velocity frequency distributions at a height of 30 m above ground level, respectively. In Bursa, 52.4% of the wind speed data at a height of 30 m above ground level was found between 4.00-6.99 m/s. 10.1% of the data is in the range 0-3.99 m/s and 37.5% is above 7 m/s. In Edirne, 68% of the wind speed data and 78.3% at Kırklareli, 30 m above ground level were contributed between 4.00-6.99 m/s. In İpsala, the wind speed frequency below 4 m/s remained at 4.3%. The wind speed frequency above 7 m/s is 48.2%. The wind speed frequencies of 7 m/s at a height of 30 m above ground level in Tekirdağ, Çorlu, Çanakkale, Gökçeada, Bozcaada and Bandırma were 37.9%, 48.6%, 61.5%, 60%, 65.5%, 48%, and 60.8%, respectively. In Şile and Kumköy, 67.2% and 66% of the wind speed data were fixed to be between 4.00-6.99 m/s.
Fig. 7:Seasonal variation of wind speed depending on months
In the literature; Rehman et al. (2007) according to 24-year data, 35% of the wind speed data obtained in their study is distributed between 0 and 3.5 m/s and 65% of the wind speed values are higher than 3.5 m/s. In addition, 20% of the obtained wind speed data is composed of higher wind speed values than 6.5 m/s. Carta and Mentado (2007) found that wind speed values were more intense in the range of 6-8 m / s for the first station and 10-11 m / s for the second station. Zhou et al. (2006) in their study in China on the island of Shang Chuan 2.5-3 m/s, 5 m/s in Waglan and Cheung islands and on the island of Zhe Gu more frequent 4 m/s have determined that the wind blows. Montes and Martin (2007) reported in their study in Spain that the wind often blows at 6.5 m/s.
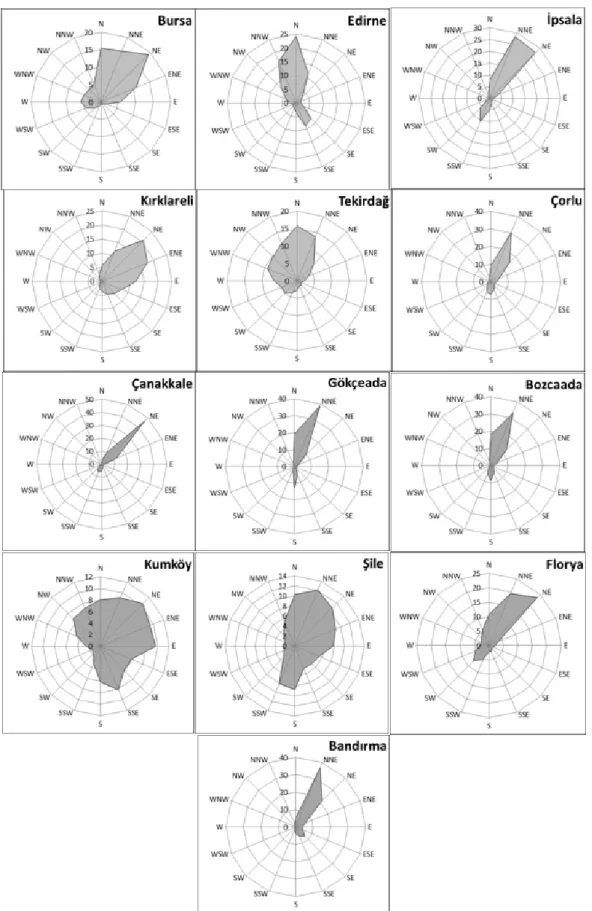
Wind direction distributions
In Fig. 8, the stations studied in the research area show predominant wind direction where the wind blows for many years. When the distribution of windblown directions are examined; it is seen that wind blows from N, NNE and NE directions in all stations. In the Edirne station, the direction of the wind dominated by the wind can also shift from N to NNW. In Kumköy station, the direction of wind deflection was determined as very scattered.
Wind power density and energy potantial analysis
Fig. 9 shows the average energy potential and wind power density changes at a height of 30 m. In all stations except Bandırma, the energy potential and power density in winter were higher than in other seasons. The lowest energy potential and power density were observed in Tekirdağ, Çorlu, Bozcaada, Florya and Bandırma in the spring months. In Ipsala, Kırklareli, Gökçeada, Kumköy and Şile, the lowest energy potential and power density were found in the summer months. The lowest energy potential and power density were determined in Bursa and Edirne. However, it also was observed in Çanakkale during the autumn months. Numerically, the lowest energy potential was 50 kWh/m2 and the lowest power density was 69 W/m2at Kırklareli in June. The highest energy potential was 1137 kWh/m2 and the highest power density was 1528 w/m2in Bandırma in August.
In the literature; Fadai (2007) study which was done in a given map for the whole world to the north-west Turkey is 200-400 W/m2 reported a wind power density. Zhou et al. (2006) in their research on Shang Chuan, Waglan, Cheung and Zhe Gu islands, they determined power values between 100 W/m2 and 800 W/m2. Khadem and Hussain (2006) in their study in Bangladesh obtained power values between 165 W/m2 and 250 W/m2. Carta and Mentado (2007) achieved up to 500 W/m2 of power in their study in the Canary Islands of Spain. Rehman et al. (2007), in their study in Rafha (Saudi Arabia) have found wind power up to 173 W/m2.
Energy production analysis
The energy (kWh/year) values that can be produced with the wind turbines using the A / B-type condensing system and without condensing wind turbines system are presented in Figure 10. In Figure 10, the “WT” symbol represents a wind turbine, while the “CWT” symbol represents the use of the same wind turbine in conjunction with the A-Type condenser system, and the “CBWT” represents the use of the same wind turbine in conjunction with the B-Type condenser system. The numbers after the symbol indicate the power of the wind turbine. The wind turbines indicated by WT-2 and WT-10 were installed at a tower height of 10 m, while the wind turbines indicated with CAWT and used in conjunction with the A-Type condensing system were hight 2 m. For wind turbines that are shown with “WT-50”, “WT-100”, “WT-200” and “CBWT” and used in conjunction with the B-type condensation system, the height was taken 30 m.
Fig. 10; It is observed that the A-Type condensing system does not cause an increase in energy production in stations with low wind potential such as Kırklareli, Edirne, Bursa and Florya. In contrast, the use of A-Type condensation system; In the Şile station, 103-104%, Kumköy station 84% and in Bozcaada station 53-55% energy production increased.
Fig. 10:Amount of energy produced by the use of condensers and wind turbines
without condensing system (kWh/year)
The use of the B-Type condensing system leads to an increase in energy production in all stations and all wind turbines. However, the energy generation surplus from the regions with high wind potential is less compared to the regions with low wind potential. For example, in the case of the use of the WT-50 wind turbine with the condensation system (CBWT-50), energy production increased by 17%. On the other hand, the same wind turbine and densification system provided an increase of 170% in Edirne and 180% in Kırklareli.
In the calculations related to the energy production of wind turbines, power curves of wind turbines are taken as the basis. Regional wind speed distributions (frequencies), tower heights, wind turbines' cut-in and cut-out wind speeds are the influential elements here. Because of these factors, the energy production surplus between the wind turbines (WT) and the wind turbines (CAWT/CBWT) used together with the condensing systems could be too high or too low. However, the data used in this study are actual data from the region.
Conclusion
In this study, the changes in the wind speed values, which are adapted to the height of 30 m from the ground surface, have been shown. In addition, average wind speeds on the basis of years and months, also wind power density values on the basis of years and months, frequency (%) distribution of wind speed and direction of wind blowing were made. Finally, the amount of annual energy that can be produced by small wind turbines with integrated and non-integrated condensing systems has been determined.
According to the results of the research; The average annual wind speed values in the entire research region are approximately horizontal while the wind speeds in Kumköy and Şile are decreasing with time. In a study by Vardar and Taşkın (2015), a similar situation was found with different data sets for the same regions. It is considered that this decrease in wind speed averages is caused by the structuring in the region.
The highest average wind speed values in autumn, winter and spring months were determined in Bozcaada and the highest wind speed values in summer months were established in Bandırma. In these two regions, the wind velocity frequencies which are over 30 m high and 7 m/s were found as 48% and 60.8%, respectively.
When the distribution of wind blow direction is examined; wind is seen in all stations mainly from N, NNE and NE directions.
In almost all stations, the energy potential and power density during the winter months were found to be higher than in other seasons. Numerically, The lowest energy potential in the research area was 50 kWh/m2 and the lowest power density was 69 W/m2. The highest energy potential in the region was 1137 kWh/m2 and the highest power density is 1528 W/m2.
It is seen that the A-Type condensing system does not cause an increase in energy production at very low wind potential stations. In contrast, the use of A-Type condensation system; In regions with higher wind speed potential, 53-104% energy production increased.
The use of the B-Type condensing system leads to an increase in energy production in all stations and all wind turbines. However, the energy generation surplus from the regions with high wind potential is less compared to the regions with low wind potential. The use of the B-Type condensation system was caused a 17-180% increase in energy production in the research region.
NOMENCLATURE
v : Wind speed, ms-1 h : Height of Wind speed, m u* : Wind speed altitude factor k : Von Karman constatnt (0,4) Mm :Monthly mean value My : Yearly mean value
n : Days in the month m : Days in the year Z0 : Roughness length born of obstacles on earth surface, m
Reference
Acaroğlu, M. 2003. Alternatif Enerji Kaynakları (Alternative Energy Resources), Atlas Publications, Istanbul, Turkey.
Bencuya İpekçioğlu, R.G. and Vardar, A. 2017. Turkey’s 2017 Actual Wind Energy Appearance. Uludağ
Üniversitesi Ziraat Fakültesi Dergisi, 31 (2), 177-181.
Carta, J.A. and Mentado, D. 2007. A continuous bivariate model for wind power density and wind turbine energy output estimations. Energy Conversion and Management 48(2): 420-432. https://doi.org/10.1016/j.enconman.2006.06.019.
Chen, J., Wang, F. and Stelson, K.A. 2018.A mathematical approach to minimizing the cost of energy for large utility wind turbines. Applied Energy 228: 1413-1422.https://doi.org/10.1016/j.apenergy.2018.06.150. Clark, C.E., Miller, A. and DuPont, B. 2019.An analytical cost model for co-located floating wind-wave energy
arrays. Renewable Energy 132: 885-897. https://doi.org/10.1016/j.renene.2018.08.043.
Darwish, A.S., Shaaban, S., Marsillac, E. and Mahmood, N.M. 2019. A methodology for improving wind energy production in low speed regions, with a case study application in Iraq. Computers & Industrial Engineering; 127: 89-102.https://doi.org/10.1016/j.cie.2018.11.049.
Dörner, H.H. 2019. Concentrating Windsystems - Sense or Nonsense, http://www.heiner-doerner-windenergie.de/Hausrotor4.jpg.(Accessed 10.01.2019).
EIE, 2005. Elektrical Power Resources Survey and Development Administration.
http://www.eie.gov.tr/turkce/ruzgar/ruzgar_ruzgar_atlas.html. (Accessed 15.12.2018).
Energy Research Unit, 2001. Wind energy for the built environmental (WEB),
http://www.eru.rl.ac.uk/web.htm.(Accessed 18.01.2019).
Fadai, D. 2007. The feasibility of manufacturing wind turbines in Iran. Renewable and Sustainable Energy
Reviews 11(3): 536-542. https://doi.org/10.1016/j.rser.2005.01.012.
Gasch, R. and Twele, J. 2011. Windkraftanlagen, Vieweg+Teubner Verlag, Springer Fachmedien, Wiesbaden, Germany.
Google Maps, 2019. http://www.google.com/maps/ (Accessed 1.01.2019).
Hummer, 2019. Anhui Hummer Dynamo Co., Ltd. http://www.chinahummer.cn/index.php/. (Accessed 26.02.2019).
Jiang, Y., Luo, Y. and Zhao, Z. 2013. Maximum wind speed changes over China. Acta Meteorologica Sinica 27(1): 63-74. https://doi.org/10.1007/s13351-013.
Karameldin, A., Lotfy, A. and Mekhemar, S. 2002. The Red Sea area wind-driven mechanical vapor compression desalination system. Desalination 153(1-3): 47-53. https://doi.org/10.1016/S0011-9164(02)01092-5.
Khadem, S.K. and Hussain, M. 2006. A pre-feasibility study of wind resources in Kutubdai Island, Bangladesh.
Renewable Energy 31(14): 2329-2341. https://doi.org/10.1016/j.renene.2006.02.011.
Klug, H. 2001. Basic Course in Wind Energy, German Wind Energy Institute (DEWI), Istanbul, Turkey.
Lui, F., Sun, F., Liu, W., Wang, T., Wang, H., Wang, X. and Lim, W. 2019.On wind speed pattern and energy potential in China. Applied Energy 236: 867-876. https://doi.org/10.1016/j.apenergy.2018.12.056.
Marciukaitis, M., Katinas, V. and Kavaliauskas, A. 2008. Wind power usage and prediction prospects in
Lithuania. Renewable and Sustainable Energy Reviews 12(1): 265-277.
https://doi.org/10.1016/j.rser.2006.05.012.
Montes, G.M. and Martin, E.P. 2007. Profitability of wind energy: Short-term risk factors and possible
improvements. Renewable and Sustainable Energy Reviews 11(9): 2191-2200.
https://doi.org/10.1016/j.rser.2006.03.009.
Pelletier, J.D. 2006.Sensitivity of playa windblown-dust emissions to climatic and anthropogenic change.
Journal of Arid Environments 66(1): 62-75. https://doi.org/10.1016/j.jaridenv.2005.10.010.
Rehman, S., El-Amin, I.M., Ahmad, F., Shaahid, S.M., Al-Shehri, A.M. and Bakhashwain, J.M. 2007. Wind power resource assessment for Rafha, Saudi Arabia. Renewable and Sustainable Energy Reviews 11(5): 937-950. https://doi.org/10.1016/j.rser.2005.07.003.
Samal, R.K. and Tripathy, M. 2019. Cost and emission additionality of wind energy in power systems.
Sustainable Energy, Grids and Networks 17: 100179. https://doi.org/10.1016/j.segan.2018.12.001.
Santos, J.A., Rochinha, C., Liberato, M.L.R., Reyes, M. and Pinto, J.G. 2015.Projected changes in wind energy potentials over Iberia. Renewable Energy 75: 68-80. https://doi.org/10.1016/j.renene.2014.09.026.
Seo, S., Oh, S.D. and Kwak, H.Y. 2019. Wind türbine power curve modeling using maximum likelihood estimation method. Renewable Energy 136: 1164-1169. https://doi.org/10.1016/j.renene.2018.09.087.
Shi, P.J., Zhang, G.F., Kong, F. and Ye, Q. 2015. Wind speed change regionalization in China (1961-2012).
Advances in Climate Change Research 6(2): 151-158. https://doi.org/10.1016/j.accre.2015.09.006.
Soysal, M.İ. 2000. Principles of Biometry, Trakya University Faculty of Agriculture Paper No: 95. Tekirdağ, Turkey.
Tian, Q., Huang, G., Hu, K. and Niyogi, D. 2019. Observed and global climate model based changes in wind power potential over the Northern Hemisphere during 1979-2016. Energy 167: 1224-1235. https://doi.org/10.1016/j.energy.2018.11.027.
TSMS, 2018. Turkish State Meteorological Service. http://www.meteor.gov.tr (Accessed 15.12.2018).
Vardar, A., Eker, B., Kurtulmuş, F. and Taşkın, O. 2015. Developing Wind-Concentrator Systems for the Use of Wind Turbines in Areas with Low Wind-Speed Potentials. Energy Technology 3: 1260-1270. https://doi.org/10.1002/ente.201500197.
Vardar, A. and Taşkın, O. 2015.Technical and economic evaluation of energy production from wind in Istanbul and surrounds. Journal of Energy in Southern Africa 26(4): 64-69. https://doi.org/10.17159/2413-3051/2016/v26i4a2112.
Vindmolleindustrien (2019).Danish Wind Industry Association. The Guide Tour, http://xn--drmstrre-64ad.dk/wp-content/wind/miller/windpower%20web/en/stat/unitsw.htm. (Accessed 22.01.2019).
Wang, Z.Y., Ding, Y.H., He, J.H. and Yu, J. 2004.An updating analysis of the climate change in China in recent 50 years. Acta Meteorologica Sinica 62(2): 228-236.
Weber, J., Gotzens, F. and Witthaut, D. 2018.Impact of strong climate change on the statistics of wind power generation in Europe. Energy Procedia 153: 22-28. https://doi.org/10.1016/j.egypro.2018.10.004.
Zhou, W., Yang, H. and Fang, Z. 2006. Wind power potential and characteristic analysis of the Pearl River Delta region, China. Renewable Energy 31(6): 739-753. https://doi.org/10.1016/j.renene.2005.05.006.