doi: 10.1111/jwas.12448
Acute Toxicity of Ammonia and Nitrite to Sea Bream, Sparus aurata
(Linnaeus, 1758), in Relation to Salinity
Mehmet Kir1and Murat C. Sunar
Faculty of Fisheries, Mugla Sitki Kocman University, 48000, Kotekli, Mugla, Turkey
Abstract
Sea bream, Sparus aurata, is one of the most important fish species that is commonly cultured in the Mediterranean and the eastern coasts of the Atlantic Ocean. The life cycle of sea bream in its natural habitat passes through hyposaline and hypersaline lagoons. It is important to determine the tolerance of the fish to nitrogenous compounds for aquaculture at maximum stocking densities. In the present study, a series of acute experiments were performed to evaluate the effect of salinity on ammonia and nitrite toxicity to sea bream. The fish were exposed to different ammonia and nitrite concentrations according to the static renewal methodology at three different salinities (10, 20, and 30 ppt) and at a temperature of 20 C and a pH of 8.2. The toxic effect of total ammonia nitrogen (TAN) and nitrite nitrogen (NO2-N) decreased with increasing salinity levels (P< 0.001). Acute toxicity (96-h lethal concentration 50 [LC50]) values of TAN were determined to be 5.93, 11.72, and 19.38 mg/L at 10, 20, and 30 ppt salinity, respectively. The 96-h LC50values of NO2-N were determined to be 370.80, 619.47, and 806.33 mg/L at 10, 20, and 30 ppt salinity, respectively. Results indicate that sea bream is less tolerant to ammonia but more tolerant to nitrite compared with some other fish species.
KEYWORDS
ammonia, LC50, nitrite, salinity, Sparus aurata
Ammonia and nitrite can concentrate in aqua-culture systems and cause commonly known water-quality problems (Frias-Espericueta et al. 1999). However, high densities of ammonia and nitrite concentration may increase to levels that reduce fish growth or even cause death. The toxic effect of ammonia on aquatic animals is ascribed to the unionized form of total ammo-nia nitrogen (TAN) (NH3-N). The ionized form (NH4+-N) is considered nontoxic because it
can-not pass through cell membranes. The NH3-N
that penetrates cell membrane destroys cell func-tions and causes death in fish (Jeney et al. 1992). Nitrite spreads into red blood cells and oxidizes hemoglobin to methemoglobin, which does not carry oxygen in blood, causing fish to die from anoxia (Lewis and Morris 1986; Jensen 1995).
Regarding the toxic effect of nitrogenous com-pounds in marine fish, salinity is one of the most important environmental variables that must be
1Correspondence to: [email protected]
considered. High salinity levels increase toler-ance of most aquatic organisms to ammonia and nitrite (Saroglia et al. 1981; Kır and Öz 2015). It has been reported that the toxic effect of nitrite on fish constantly decreases with increasing salinity (Saroglia et al. 1981; Wise and Tomasso 1989). Ammonia toxicity also decreases with increasing salinity up to levels of 30–40 ppt but then increases at higher salinity levels (Herbert and Shurben 1965; Harader and Allen 1983).
Sea bream, Sparus aurata, is a euryhaline fish species that is widely distributed in hyposaline and hypersaline lagoons around the Mediter-ranean and the eastern Atlantic Ocean (Polo et al. 1991; Vargas-Chacoff et al. 2009; Geor-gakopoulou et al. 2010). Various salinity lev-els are necessary in sea bream reproductive life cycles to keep larvae alive and to main-tain homoeostasis. Gonadal growth and matu-ration of sea bream take place in estuaries and coastal waters (Arias 1976). In the winter sea-son, mature sea bream migrate from lagoons and
© Copyright by the World Aquaculture Society 2017
coastal waters to open seas for spawning where salinity conditions are unknown (Barbaro and Francescon 1986).
The culture of sea bream from the larval stage to juvenile size is mainly carried out in recirculating aquaculture systems. The accu-mulation of ammonia and nitrite needs to be considered in recirculating aquaculture systems along with salinity influences on the toxic effect of the nitrogenous compounds. It is important to measure the tolerance of fish to nitrogenous sub-stances related to salinity. Although there have been some studies about the toxicity of ammonia and nitrite on sea bream related to temperature and pH (Wajsbrot et al. 1991, 1993; Parra and Yufera 1999), there is not much information on the harmful effects of nitrogenous compounds on sea bream at different salinity levels. The objective of this study was to determine the toxic effects of ammonia and nitrite on sea bream in relation to salinity. The present study estimated the median lethal time (LT50) and the median
lethal concentration (LC50) of ammonia and
nitrite for sea bream at different salinity levels in acute toxicity experiments.
Materials and Methods
Experimental Fish and Adaptation Procedure A total of 720 (1.1 ± 0.2 g) juvenile sea bream were obtained for this study from the fish farm of Kılıç Holding near Bafa Lake in Turkey. Fish were transferred in water at a tempera-ture of 20 C and 30 ppt salinity. Experiments were performed in the laboratory of the Aqua-culture Department of the Faculty of Fisheries at Mugla Sitki Kocman University. After trans-fer to the laboratory, ambient salinity levels were reduced from 30 to 20 ppt at a rate of 5 ppt per day by adding fresh water. Fish were stocked in a 250-L tank that was part of a recirculat-ing system at a stockrecirculat-ing density of 1 kg/ton, and fish were maintained for 1 wk in this con-dition. Fish were then divided randomly into three groups, and each group was assigned to a 100-L fiberglass tank at 20 C. The salinity in the three tanks was increased or decreased at a rate of 2 ppt per day by adding fresh water or salt water until the desired final salinity levels
(10, 20, and 30 ppt) were reached. Each group of fish was maintained at these different salinity levels for 2 wk and fed ad libitum with commer-cial feed pellets containing 45% protein. Acute ammonia and nitrite toxicity experiments were then performed to determine the LT50and LC50 of the fish at different exposure times (24, 48, 72, and 96 h).
Toxicity Experiments
Ammonia and nitrite stock solutions (30 g/L)
were prepared with ammonium chloride
(NH4Cl; Merck, Darmstadt, Germany) and sodium nitrite (NaNO2; Merck) according to Chen and Lei (1990). The stock solutions were then diluted to the predicted TAN and NO2-N concentrations with 10, 20, and 30 ppt seawater. The experimental TAN concentrations in the test solutions were 6, 8, 10, 12, 14, 16, 20, and 24 mg/L. Nominal concentrations of NO2-N
were 600, 700, 800, 900, 1000, 1100, and 1200 mg/L. The actual concentration levels of TAN and NO2-N in test solutions were checked
using methods reported by Parsons et al. (1985) and Bendschneider and Robinson (1952), respectively. The NH3-N concentration in the
TAN was calculated as described by Bower and Bidwell (1978) based on a pH of 8.2 with salinities of 10, 20, and 30 ppt at a temperature of 20 C. The salinity and pH of the test solutions were regularly controlled using an HQ40d mul-tiparameter meter (Hach, Loveland, CO, USA).
The acute toxicity experiments were per-formed as described by APHA (1989). Ten fish were randomly sampled from each salinity group and were allocated to polyethylene test aquariums. Each aquarium contained 5 L of test solution. Bioassay experiments were con-ducted in two replicates. Each test aquarium was aerated continuously. The test solution in each test aquarium was changed daily according to the static renewal methodology (Buikema et al. 1982). The fish were starved for 8 h before experimental trials and not fed during the exper-iment (96 h). The test fish were observed at 12-h intervals until the end of the trial. Fish that were motionless and without opercular movement were presumed dead. The LT50and LC50values
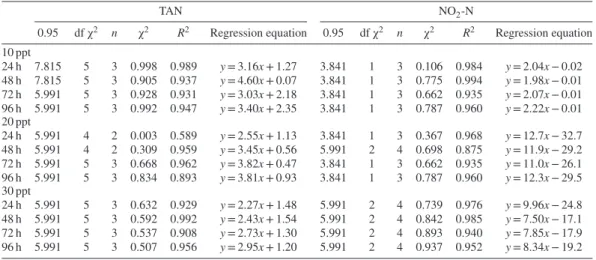
Table 1. The relationship between probit mortality (y) and the log of NO2-N and total ammonia nitrogen (TAN)
concentrations in mg/L (x) at various exposure times and salinity levels for Sparus aurata.
TAN NO2-N
0.95 df χ2 n χ2 R2 Regression equation 0.95 df χ2 n χ2 R2 Regression equation
10 ppt 24 h 7.815 5 3 0.998 0.989 y = 3.16x + 1.27 3.841 1 3 0.106 0.984 y = 2.04x − 0.02 48 h 7.815 5 3 0.905 0.937 y = 4.60x + 0.07 3.841 1 3 0.775 0.994 y = 1.98x − 0.01 72 h 5.991 5 3 0.928 0.931 y = 3.03x + 2.18 3.841 1 3 0.662 0.935 y = 2.07x − 0.01 96 h 5.991 5 3 0.992 0.947 y = 3.40x + 2.35 3.841 1 3 0.787 0.960 y = 2.22x − 0.01 20 ppt 24 h 5.991 4 2 0.003 0.589 y = 2.55x + 1.13 3.841 1 3 0.367 0.968 y = 12.7x − 32.7 48 h 5.991 4 2 0.309 0.959 y = 3.45x + 0.56 5.991 2 4 0.698 0.875 y = 11.9x − 29.2 72 h 5.991 5 3 0.668 0.962 y = 3.82x + 0.47 3.841 1 3 0.662 0.935 y = 11.0x − 26.1 96 h 5.991 5 3 0.834 0.893 y = 3.81x + 0.93 3.841 1 3 0.787 0.960 y = 12.3x − 29.5 30 ppt 24 h 5.991 5 3 0.632 0.929 y = 2.27x + 1.48 5.991 2 4 0.739 0.976 y = 9.96x − 24.8 48 h 5.991 5 3 0.592 0.992 y = 2.43x + 1.54 5.991 2 4 0.842 0.985 y = 7.50x − 17.1 72 h 5.991 5 3 0.537 0.908 y = 2.73x + 1.30 5.991 2 4 0.893 0.940 y = 7.85x − 17.9 96 h 5.991 5 3 0.507 0.956 y = 2.95x + 1.20 5.991 2 4 0.937 0.952 y = 8.34x − 19.2
of ammonia and nitrite concentrations were calculated according to the Bliss Probit Method. The 95% confidence limits of the LT50 and LC50 values were estimated (Sprague 1969). The probit mortality line, which is a function of the log of TAN and NO2-N concentrations,
was determined, and a chi-square (χ2) test was
performed to determine the goodness of fit. Statistical Analysis
The SPSS 22 statistical software (IBM, New York, NY) was used for two-way ANOVA testing to compare differences between groups based on salinity, survival, concentrations of toxic substances, and exposure time. Duncan’s multiple range tests were performed to compare the mean values of LC50 among salinities and exposure times. Regression analyses were used to determine relationships of TAN and NO2-N
concentrations and exposure time on LT50 and
LC50values.
Results
Throughout the ammonia and nitrite toxicity experiments, no deaths occurred in the control solutions at any salinity levels. Low levels of nitrogen compounds were not toxic to the fish, whereas high concentrations had a lethal effect at even 12 h of exposure. The estimated pro-bit mortalities are illustrated in Table 1. It was
determined from the results of the χ2
analy-sis that there is a positive linear relationship between the log of ammonia and nitrite concen-trations and probit mortality. The LC50 values
of the toxic substances used in the study and their calculated 95% confidence limits for juve-nile sea bream at different salinity levels and exposure times are summarized in Table 2. The LC50values for TAN and NO2-N were 2.7 and 1.7 times higher, on average, at 30 ppt salinity than at 10 ppt salinity, respectively, at 24, 48, 72, and 96 h of exposure time.
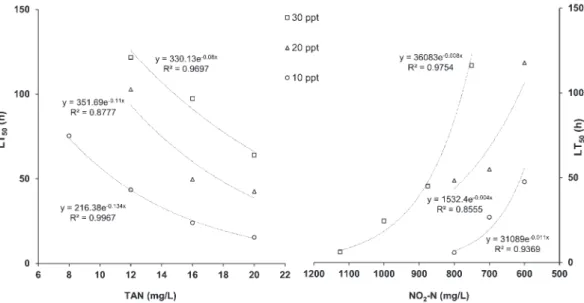
The LT50 values estimated at different TAN
and NO2-N concentrations in the toxicity
exper-iments are illustrated in Figure 1. The regression analyses performed in the study demonstrated a negative exponential relationship between the LT50value and TAN and NO2-N concentrations. The LT50 values varied depending on concen-trations of TAN from 75.3 to 15.39 h and 175.3 to 36.02 h at 8–16 and 12–20 mg/L and 10 and 30 ppt salinity, respectively. The LT50values
var-ied depending on concentrations of NO2-N from
47.5 to 5.7 h and 116.1 to 6.05 h at 600– 800 and 800–1200 mg/L and 10 and 30 ppt salinity, respectively.
Discussion
The results of the present study clearly demonstrated that the tolerance of fish to toxic
Table 2. Lethal dose 50 (LC50) (mg/L) of total ammonia nitrogen (TAN), NH3, and NO2-N for Sparus aurata and 95%
confidence limits (in parenthesis) at three salinity levels and various exposure times.a
Salinity (ppt) TAN LC50 NH3-N LC50 NO2-N LC50 10 ppt 24 h 15.36 (14.0–16.7) 0.65 (0.60–0.71) 674.42 (673.3–675.5) 48 h 11.66 (10.4–12.9) 0.50 (0.44–0.55) 573.34 (572.2–574.5) 72 h 8.49 (7.13–9.84) 0.36 (0.30–0.42) 496.26 (496.3–497.4) 96 h 5.93 (4.54–7.32) 0.25 (0.19–0.31) 370.80 (369.5–372.1) 20 ppt 24 h 33.39 (31.9–34.8) 1.42 (1.36–1.48) 921.26 (920.2–922.3) 48 h 19.23 (17.9–20.5) 0.82 (0.76–0.87) 748.92 (747.8–750.0) 72 h 15.21 (14.0–16.5) 0.65 (0.59–0.70) 656.07 (655.0–657.2) 96 h 11.72 (10.5–13.0) 0.50 (0.45–0.55) 619.47 (618.4–620.6) 30 ppt 24 h 42.68 (41.0–44.3) 1.66 (1.60–1.73) 990.27 (989.2–991.4) 48 h 26.32 (24.9–27.7) 1.03 (0.97–1.08) 887.16 (886.0–888.3) 72 h 22.52 (21.2–23.9) 0.88 (0.82–0.93) 836.02 (834.9–837.1) 96 h 19.38 (18.0–20.7) 0.76 (0.70–0.81) 806.33 (805.2–807.4) aThe LC
50value in the same column and row are different from each other (P< 0.001).
Figure 1. Lethal time (LT50) (h) values for Sparus aurata exposed to different concentrations of total ammonia nitrogen
(TAN) and NO2-N at a salinity of 10, 20, and 30 ppt.
substances increases as salinity levels increase (P< 0.001). Similar results related to salinity have also been reported in studies on the Euro-pean eel, Anquilla anquilla (Saroglia et al. 1981) and the grey mullet, Mugil planatus (Sampaio et al. 2002).
There are some previous studies on the toxic effects of ammonia on sea bream at various salinity levels and at various temperatures with respect to size or developmental stage. For
example, a 57-mg/L 96-h LC50 value of TAN was reported for sea bream at 6–160 g in weight at 34 ppt salinity, 18 C, and a pH of 8.1 (Le Ruyet et al. 1995). For 12-d-old larvae of sea bream, the 24-h LC50values of NH3-N was reported as 0.24 mg/L at 33 ppt salinity, 19.5 C, and a pH of 8.2 (Parra and Yufera 1999). While the 96-h LC50value for sea bream of 1.1 g was calculated as 19.38 mg/L for TAN, the 24-h LC50value of NH3-N was calculated as 1.66 mg/L at 30 ppt
salinity, 20 C, and a pH of 8.2 in the current study. The results of the studies carried out previ-ously on sea bream and the results obtained from this study demonstrate that large fish have a high tolerance to ammonia compared to small fish.
The 96-h LC50value of meagre, Argyrosomus regius, with a weight of 3.0 g, has been reported as 10.39 mg/L TAN at 30 ppt salinity, 22 C, and a pH of 8.2 (Kır et al. 2016). European sea bass, Dicentrarchus labrax, and turbot, Scopthalmus maximus, with weights ranging from 6 to 160 g, have 96-h LC50values of 40 and 59 mg/L TAN,
respectively, at similar salinity, temperature, and pH (34 ppt, 18 C, and 8.1) (Le Ruyet et al. 1995). At a salinity of 30 ppt, temperature of 20 C, and pH of 8.2, the 96-h LC50value of TAN for sea bream (at 1.1 g) was calculated as 19.38 mg/L in the current study. Temperature, salinity, and the size or development stage of fish may affect the response of fish to ammonia (Kır et al. 2016). In addition, it has been suggested that ammonia may interact with other environmental variables, such as nitrite, oxygen, and carbon dioxide (Randall and Wright 1987; Wajsbrot et al. 1991; Foss et al. 2003; Lemarie et al. 2004). The results of previous studies on other fish species and the results of the current study indicate that sea bream is a fish that is less tolerant to ammonia than some other fish species cultured in the Mediterranean and eastern Atlantic, such as European sea bass and turbot, but sea bream is more tolerant than meagre.
The 96-h LC50 values of NO2-N for
juve-nile sea bream were calculated as 370, 619, and 806 mg/L at 10, 20, and 30 ppt salinity, respectively, at a temperature of 20 C and a pH of 8.2 in the current study (Table 2). Kır et al. (2015) reported a 96-h LC50 value of NO2-N for 5.4-cm meagre as 139.5 mg/L at 22 C and 30 ppt salinity. For European sea bass, with a length of 5 cm, a 96-h LC50value was reported as 220 mg/L NO2-N at 23 C. In the same study, a 96-h LC50value for European eel, with a length of 7 cm, was reported as 812 mg/L NO2-N
at 30 ppt salinity (Saroglia et al. 1981). Such significant differences in the 96-h LC50 value
of NO2-N among fish species indicate that each
fish has species-specific regulatory mechanisms for nitrite (Wise and Tomasso 1989). In all
conditions, the present study demonstrated that sea bream has nitrite sensitivity that is similar to the European eel, but sea bream is more tolerant than European sea bass and meagre.
The 24-h LC50value of NO2-N for 12-d-old sea bream larvae has been reported as 1997 mg/L at 33 ppt salinity, a temperature of 19.5 C, and a pH of 8.2 (Parra and Yufera 1999). In the current study, the 24-h LC50value of NO2-N was calcu-lated as 990 mg/L for juvenile sea bream at salin-ity of 30 ppt, temperature of 20 C, and pH of 8.2. Studies have shown that small fish and larvae are less tolerant to nitrite compared with large fish of the same species (Lewis and Morris 1986). However, the LC50 value estimated in the pre-vious study for sea bream larvae is higher than the LC50 value calculated in the current study for juvenile sea bream at 1.1 g. In both studies, toxicity experiments were performed at similar temperatures and pH. Because there were salin-ity differences, it is thought the LC50 value of larvae is higher than the LC50value of juveniles. A safe level is defined as an amount of toxic substance that has no adverse effect on aquatic organisms, and it is calculated by dividing a 96-h LC50 by a factor of 10 (Sprague 1971). Safe
levels are generally considered safe concentra-tions in which organisms can remain alive and grow. The safe levels of TAN for sea bream were estimated to be 0.5, 1.1, and 1.9 mg/L at 10, 20, and 30 ppt salinity, respectively. The NO2-N
safe levels were estimated to be 37, 61, and 80 mg/L at 10, 20, and 30 ppt salinity, respec-tively (P< 0.001). From the current data, the toxic effects of TAN and NO2-N on sea bream
appear to be 4.5 and 2.2 times higher, respec-tively, at a salinity of 10 ppt compared with 30 ppt. The safe levels estimated in this study are important factors to be considered for bet-ter management of sea bream culture, particu-larly when considering different salinities. It is necessary to prevent the accumulation of these nitrogenous compounds at concentrations higher than safe levels in production systems.
Conclusions
The toxic effect of ammonia and nitrite on sea bream juveniles decreases with increasing
salinity. When a comparison is made among fish species cultured in the Mediterranean and eastern Atlantic coasts, sea bream is a less tolerant fish species to ammonia compared with European sea bass, but it is more tolerant than meagre. Regarding nitrite toxicity, sea bream has more tolerance compared with the other two fish species.
Literature Cited
APHA (American Public Health Association). 1989. Stan-dard methods for the examination of waters and wastew-aters, 17th edition. APHA, Washington, District of Columbia, USA.
Arias, A. 1976. Sobre la biologia de la dorada, Sparus
aurata, L., de los esteros de la provincia de Cadiz.
Investigación Pesquera 40:201–222.
Barbaro, A. and A. Francescon. 1986. L’orata (Sparus
aurata): importante risorsa dell’ambiente acquatico.
Ambiente e Risorse l(1):71–74.
Bendschneider, K. and R. J. Robinson. 1952. A new spectrometric method for the determination of nitrite in the sea water. Journal of Marine Research 11:87–96.
Bower, E. C. and P. J. Bidwell.1978. Ionisation of ammonia in seawater in seawater: effects of temperature, pH, and salinity. Journal of the Fisheries Research Board of Canada 35:1012–1016.
Buikema, A. L. J., R. R. Niedertehner, and J. CairnsJr. 1982. Biological monitoring: Part IV. Toxicity testing. Water Research 16:239–262.
Chen, J. C. and S. C. Lei.1990. Toxicities of ammonia and nitrite to Penaeus monodon juveniles. Journal of the World Aquaculture Society 21:300–306.
Foss, A., T. Vollen, and V. Øiestad.2003. Growth and oxygen consumption in normal and O2supersaturated
water, and interactive effects of O2 saturation and
ammonia on growth in spotted wolffish (Anarhichas
minor Olafsen). Aquaculture 224:105–116.
Frias-Espericueta, M. G., M. Harfush-Melendez, J. I. Osuna-Lopez, and F. Paez-Osuna.1999. Acute tox-icity of ammonia to juvenile shrimp Penaeus vannamei Boone. Bulletin of Environmental Contamination and Toxicology 62:646–652.
Georgakopoulou, E., P. Katharios, P. Divanach, and G. Koumoundouros.2010. Effect of temperature on the development of skeletal deformities in Gilthead seabream (Sparus aurata Linnaeus, 1758). Aquaculture 308(1):13–19.
Harader, R. R. and G. H. Allen.1983. Ammonia toxicity to chinook salmon parr: reduction in saline water. Transac-tions of the American Fisheries Society 112:834–837.
Herbert, D. W. M. and D. S. Shurben.1965. The suscepti-bility of salmonid fish to poisons under estuarine condi-tions II. Ammonium chloride. International Journal of Air and Water Pollution 9:89–91.
Jeney, G., J. Nemesok, Z. Jeney, and J. Olah.1992. Acute effect of sub lethal ammonia concentrations on common carp (Cyprinus carpio L.): II. Effect of ammonia on blood plasma transaminases GOT, GPT, GIDH enzyme activity and ATP value. Aquaculture 104:149–156.
Jensen, F. B.1995. Uptake and effects of nitrite and nitrate in animals. Pages 289–303 in P. J. Walsh and P. Wright, editors. Nitrogen metabolism and excretion. CRC Press, Boca Raton, Florida, USA.
Kır, M. and O. Öz.2015. Effects of salinity on acute toxicity of ammonia and oxygen consumption rates in common prawn, Palaemon serratus (Pennat, 1777). Journal of the World Aquaculture Society 468(1):76–82.
Kır, M., H. Topuz, M. C. Sunar, and M. Topuz.2015. Effect of temperature on acute toxicity of nitrite to meagre, Argyrosomus regius (Asso, 1801). Journal of the World Aquaculture Society 46(5):564–568.
Kır, M., M. Topuz, M. C. Sunar, and H. Topuz.2016. Acute toxicity of ammonia in meagre (Argyrosomus
regius Asso, 1801) at different temperatures.
Aquacul-ture Research 47:3593–3598.
Le Ruyet, J. P., H. Chartois, and L. Quemener.1995. Comparative acute ammonia toxicity in marine fish and plasma ammonia response. Aquaculture 136:181–194.
Lemarie, G., A. Dosdat, D. Coves, G. Dutto, E. Gasset, and J. P. Ruyet.2004. Effect of chronic ammonia expo-sure on growth of European seabass (Dicentrarchus
labrax) juveniles. Aquaculture 229:471–491.
Lewis, W. M. and D. P. Morris.1986. Toxicity of nitrite to fish: a review. Transactions of the American Fisheries Society 115:183–195.
Parra, G. and M. Yufera.1999. Tolerance response to ammonia and nitrite exposure in larvae of two marine fish species (gilthead seabream Sparus aurata L. and Senegal sole Solea senegalensis Kaup). Aquaculture Research 30:857–863.
Parsons, T. R., Y. Maita, and C. M. Lalli.1985. A manual of chemical and biological methods for seawater analy-sis. Pergamon Press, Oxford, UK.
Polo, A., M. Yufera, and E. Pascual.1991. Effects of temperature on egg and larval development of Sparus
aurata L. Aquaculture 92:367–375.
Randall, D. J. and P. A. Wright.1987. Ammonia distri-bution and excretion in fish. Fish Physiology and Bio-chemistry 3(3):107–120.
Sampaio, L. A., W. Wasielesky, and C. K. Miranda-Filho.
2002. Effect of salinity on acute toxicity of ammonia and nitrite to juvenile Mugil platanus. Bulletin of Envi-ronmental Contamination and Toxicology 68:668–674.
Saroglia, M. G., G. Scarano, and E. Tibaldi.1981. Acute toxicity of nitrite to sea bass (Dicentrarchus labrax) and European eel (Anguilla anguilla). Journal of the World Aquaculture Society 12(2):121–126.
Sprague, J. B.1969. Measurement of pollutant toxicity to fish I. Bioassay methods for acute toxicity. Water Research 3(11):793–821.
Sprague, J. B.1971. Measurement of pollutant toxicity to fish: III. Sublethal effects and “safe” concentrations. Water Research 5(6):245–266.
Vargas-Chacoff, L., F. J. Arjona, S. Polakof, M. P. M. del Río, J. L. Soengas, and J. M. Mancera.2009. Interactive effects of environmental salinity and tem-perature on metabolic responses of gilthead sea bream
Sparus aurata. Comparative Biochemistry and
Phys-iology Part A: Molecular & Integrative PhysPhys-iology 154(3):417–424.
Wajsbrot, N., A. Gasith, M. D. Krom, and D. M. Popper.
1991. Acute toxicity of ammonia to juvenile gilthead seabream Sparus aurata under reduced oxygen levels. Aquaculture 92:277–288.
Wajsbrot, N., A. Gasith, A. Diamant, and D. M. Popper.
1993. Chronic toxicity of ammonia to juvenile gilthead seabream Sparus aurata and related histopathological effects. Journal of Fish Biology 43:321–328.
Wise, D. J. and J. R. Tomasso. 1989. Acute toxicity of nitrite to Red drum Sciaenops ocellatus: effect of salinity. Journal of the World Aquaculture Society 20(4):193–198.