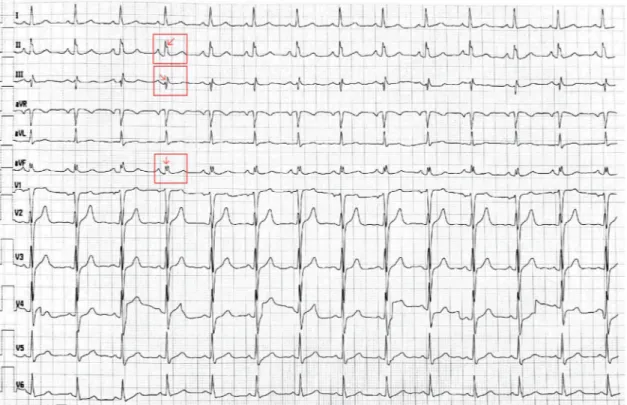
Investigation of ICAM-1 levels in hypertensive patients with fragmented QRS complexes
Tam metin
Şekil
Benzer Belgeler
Scheffe testi sonucuna göre 1-5 yıl mesleki deneyime sahip katılımcıların eğitim teknolojisi standartlarına yönelik öz-yeterlik ölçeği puanı ( X =4.00) 11 yıl
Biraz daha açmak gerekirse kitap, genel olarak modernite ile başlayan süreçte Türkiye’de yaşanan demokratikleşme ve modernleşme sürecinin 80’lerle beraber ortaya
In that study, the serum vitamin D levels of 102 patients with OLP were compared with those of 102 controls using the Enzyme Linked Fluorescent Assay method, and mean serum vitamin D
The key findings are as follows: (1) the HC group had a higher percentage of women than men, and acute coronary syndrome was the most common cause of target organ damage in
This study included 37 pa- tients (19 males, 18 females; mean age 51±7 years) with typical complaints of angina, ischemia on an exercise test and normal coronary arteries as
Fragmented QRS complexes are associated with cardiac fibrosis and significant intraventricular systolic dyssynchrony in nonisch- emic dilated cardiomyopathy patients with a narrow
order to investigate the importance of fQRS presence in the early detection of myocardial fibrosis in patients with SSc and evaluate the correlation to pulmonary HT which is
We planned the present study in order to evaluate the possible relationship between EAT and left ventricular mass (LVM), a potent predictor of cardiovascular mortality and
