doi:10.1093/ntr/ntx125 Original investigation Received November 19, 2016; Editorial Decision May 23, 2017; Accepted May 30, 2017
© The Author(s) 2017. Published by Oxford University Press on behalf of the Society for Research on Nicotine and Tobacco. All rights reserved. For permissions, please e-mail: [email protected].
482
Original investigation
Biomarkers of Secondhand Smoke Exposure in
Waterpipe Tobacco Venue Employees in Istanbul,
Moscow, and Cairo
Katherine A. Moon PhD, MPH
1,2, Ana M. Rule PhD
1, Hoda S. Magid MHS
1,
Jacqueline M. Ferguson MHS
1, Jolie Susan BS
1, Zhuolu Sun MHS
1,
Christine Torrey
1, Salahaddin Abubaker BS
1, Vladimir Levshin MD, DrSc
3,
Aslı Çarkoğlu PhD
4, Ghada Nasr Radwan PhD
5, Maha El-Rabbat PhD
4,5,
Joanna E. Cohen PhD, MHSc
6, Paul Strickland PhD
1,
Patrick N. Breysse PhD, MHS
1, Ana Navas-Acien MD, PhD
1,2,71Department of Environmental Health and Engineering, Johns Hopkins University Bloomberg School of Public Health, Baltimore, MD; 2Department of Epidemiology, Johns Hopkins University Bloomberg School of Public Health, Baltimore, MD; 3Russian Cancer Research Center, Moscow, Russian Federation; 4Department of Psychology, Kadir Has University, Istanbul, Turkey; 5Department of Public Health, Faculty of Medicine, Cairo University, Cairo, Egypt; 6Institute for Global Tobacco Control, Department of Health, Behavior, and Society, Johns Hopkins University Bloomberg School of Public Health, Baltimore, MD; 7Department of Environmental Health Sciences, Columbia University Mailman School of Public Health, New York, NY
Dr. Patrick N. Breysse is currently affiliated with the National Center for Environmental Health, Agency for Toxic Substances and Disease Registry, Centers for Disease Control and Prevention.
Corresponding Author: Katherine A. Moon, Johns Hopkins Bloomberg School of Public Health, Department of Environmental Health Sciences, Room W7604, 615 N. Wolfe Street, Baltimore, MD 21205, USA. Telephone: 410-955-5952; Fax: 410-955-0617; E-mail:
Abstract
Background: Most smoke-free legislation to reduce secondhand smoke (SHS) exposure exempts
waterpipe (hookah) smoking venues. Few studies have examined SHS exposure in waterpipe ven-ues and their employees.
Methods: We surveyed 276 employees of 46 waterpipe tobacco venues in Istanbul, Moscow, and
Cairo. We interviewed venue managers and employees and collected biological samples from employees to measure exhaled carbon monoxide (CO), hair nicotine, saliva cotinine, urine coti-nine, urine 4-(methylnitrosamino)-1-(3-pyridyl)-1-butanol (NNAL), and urine 1-hydroxypyrene glu-curonide (1-OHPG). We estimated adjusted geometric mean ratios (GMR) of each SHS biomarker by employee characteristics and indoor air SHS measures.
Results: There were 73 nonsmoking employees and 203 current smokers of cigarettes or
water-pipe. In nonsmokers, the median (interquartile) range concentrations of SHS biomarkers were 1.1 (0.2, 40.9) µg/g creatinine urine cotinine, 5.5 (2, 15) ng/mL saliva cotinine, 0.95 (0.36, 5.02) ng/mg hair nicotine, 1.48 (0.98, 3.97) pg/mg creatinine urine NNAL, 0.54 (0.25, 0.97) pmol/mg creatinine urine 1-OHPG, and 1.67 (1.33, 2.33) ppm exhaled CO. An 8-hour increase in work hours was associ-ated with higher urine cotinine (GMR: 1.68, 95% CI: 1.20, 2.37) and hair nicotine (GMR: 1.22, 95% CI: 1.05, 1.43). Lighting waterpipes was associated with higher saliva cotinine (GMR: 2.83, 95% CI: 1.05, 7.62).
Conclusions: Nonsmoking employees of waterpipe tobacco venues were exposed to high levels of
SHS, including measurable levels of carcinogenic biomarkers (tobacco-specific nitrosamines and PAHs).
Implications: Smoke-free regulation should be extended to waterpipe venues to protect
nonsmok-ing employees and patrons from the adverse health effects of SHS.
Introduction
Secondhand smoke (SHS) is a complex mixture of carcinogenic and toxic chemicals that is composed of exhaled mainstream tobacco smoke and sidestream smoke emitted directly from the burning source.1 Smoke-free and clean indoor air legislation has successfully
reduced exposure to SHS, which causes and exacerbates numerous adverse health outcomes,2 in public places around the world.3 Most
of these policies, however, explicitly or implicitly exempt waterpipe tobacco venues4 and leave employees and patrons of these venues at
risk of exposure to the harmful effects of SHS.
Waterpipe, commonly known as hookah, nargile, calean, goza, or shisha, is a centuries-old traditional method of smoking tobacco in the Eastern Mediterranean and parts of Asia and Africa.5 Popularity
of waterpipe tobacco smoking has been rising and it is commonly perceived as less harmful than cigarette smoking.6 Active waterpipe
smoking, however, has been associated with similar acute and chronic health effects as cigarette smoking.7,8 Smoking machine studies
sug-gest that waterpipe SHS contains similar or higher concentrations of many carcinogens and toxic chemicals as compared to cigar-ette SHS, including carcinogenic polycyclic aromatic hydrocarbons (PAHs), fine particulate matter (PM2.5), volatile aldehydes, and car-bon monoxide (CO).9,10 Waterpipe SHS is derived from combustion
of both tobacco and the burning source (usually charcoal),5,11 and
some studies have reported a lower burning temperature compared to cigarettes.12 As reviewed recently,13 a growing number of studies have
found that waterpipe tobacco venues have elevated indoor air SHS,14– 18 and suggest that exposure to SHS in waterpipe tobacco venues is
associated with higher levels of biological indicators of exposure to SHS in nonsmokers19–22 and acute respiratory symptoms.19
We previously reported high concentrations of indoor air markers of SHS, including PM2.5, CO, PAHs, the tobacco specific nitrosamine 4-(methylnitrosamino)-1-(3-pyridyl)-1-butanone (NNK), and air nicotine, in indoor air of waterpipe venues in Istanbul, Moscow, and Cairo.16 In the same study, but not previously reported, we collected
samples of exhaled breath, hair saliva, and urine from employees of these waterpipe tobacco venues and measured five biomarkers of SHS exposure (exhaled CO, hair nicotine, saliva cotinine, urine coti-nine, urine 4-(methylnitrosamino)-1-(3-pyridyl)-1-butanol (NNAL, a metabolite of the tobacco-specific nitrosamine NNK), and urine 1-hydroxypyrene glucuronide (1-OHPG), a biomarker of exposure to PAHs). In this study, we aimed to characterize the concentra-tions of biomarkers of exposure to SHS by employee smoking status and to evaluate the association of SHS biomarker concentrations in nonsmoking waterpipe tobacco venue employees with self-reported measures of SHS exposure and measured indoor air SHS constituents.
Methods
Study Population
We conducted a study of waterpipe tobacco venues and their employees in Istanbul, Turkey, Moscow, Russia, and Cairo, Egypt, using a convenience sampling strategy to select waterpipe ven-ues.16 The three countries were selected based on high waterpipe
consumption data from the Global Adult Tobacco Survey.23–25 To be
eligible to participate, venue owners/managers had to provide oral informed consent to conduct air sampling in the venue and at least one nonsmoking adult employee (≥18 years of age) had to provide oral informed consent and be willing to provide hair, saliva, urine, or exhaled breath samples. Data were collected between January and May 2013 in Istanbul, December 2013 to May 2014 in Moscow, and November 2013 to April 2014 in Cairo. Field staff fluent in the local language conducted all communications with venues and participants. The Johns Hopkins Bloomberg School of Public Health (JHSPH) Institutional Review Board and the ethics committees at the local coinvestigators’ institutions approved the study protocol. Questionnaire Data Collection
A total of 46 venues (9 in Istanbul, 17 in Moscow, and 20 in Cairo) participated (response rates were 30% in Cairo, 32% in Istanbul, and 34% in Moscow). A total of 283 employees (mean six per venue) participated (96% response rate in Istanbul, 95% in Moscow, and 76% in Cairo). The participants answered an interviewer-admin-istered questionnaire assessing information on sociodemographic and occupational factors, smoking status, exposure to SHS at work, home, and other places, and opinions about SHS. We categorized participant smoking status using data on self-reported tobacco use (cigarette, waterpipe, pipe without water, and chewing tobacco).
Never-smokers must have either never tried any kind of tobacco, or have smoked fewer than 100 cigarettes and smoked waterpipe for no more than one 20-minute session in their lifetime. Former smok-ers reported past tobacco use but did not report smoking cigarette, waterpipe, or other types of tobacco within the past three months. Current smokers reported smoking cigarettes or waterpipe within the past three months either “daily”, “less than daily”, or “just a few puffs”. Employees were asked about self-reported physician diagnoses of asthma and other respiratory disease, and respiratory and sensory symptoms, using questions applied in previous studies of SHS in hospi-tality venues.26 After excluding seven participants missing data on age,
hours of work per week, education, job title, and whether the employee lived with a smoker, there were 276 employees included in the analysis. Biomarkers of Secondhand Smoke
Fieldworkers collected samples of exhaled breath (CO), hair (nico-tine), saliva (cotinine), and urine (cotinine, NNAL, and 1-OHPG) from each employee. Samples were obtained during work hours but at times of low business activity for convenience. The analyt-ical measurement methods and characteristics and half-lives of the biomarkers are summarized in Supplementary Table 1. Exhaled CO was available in all employees in all cities (N = 276) and hair nicotine was available from 87% (N = 241) of employees. In Cairo, only exhaled breath samples and hair samples were analyzed due to administrative hurdles transporting urine and saliva samples to JHSPH for analysis. For participants from Istanbul and Moscow, saliva was available in 98% (N = 168) and urine cotinine was available in 96% (N = 165). Urine NNAL, 1-OHPG, and cotinine were measured in 95% to 96% of samples (N = 163, 164, and 165,
respectively). Among the 73 nonsmoking employees (both never and former smokers) in Istanbul, Moscow, and Cairo, all had measured exhaled CO and 72 had hair nicotine measurements (99%). Among 54 nonsmoking employees in Istanbul and Moscow, 53 (98%) had measured urine cotinine, 52 (96%) had measured 1-OHPG, and 51 (94%) had measured urine NNAL.
Exhaled CO
Exhaled CO was measured using a breath CO monitor fitted with a sampling-T connector and a single-use mouthpiece (Vitalograph BreathCO, Vitalograph, Lenexa, KS).
We took the average of three repeated samples. Thirty-six (13%) samples were below the limit of detection (LOD) (3 ppm) and were recorded as half the LOD.
Hair Nicotine
Hair samples were collected from the back of each participant’s scalp. A total of 30–50 strands (~30 mg) of hair with a median (10th, 90th percentile) length of 3 (2, 3) cm were collected. Three
cen-timeters of hair represent approximately 3 months of hair growth.27
Hair samples were stored in a smoke-free environment until ana-lysis and prepared as previously described.28 We analyzed samples
from Istanbul and Moscow by gas chromatography/mass spectrom-etry (GC-17/MS-QP5000, Shimadzu, Canby, OR)28 and samples
from Cairo by gas chromatography and triple quadrupole mass spectrometry (TG-5MS, Thermo Scientific, Waltham, MA). Of the 105 available hair samples, 19 (18%) were too small to analyze. For quality control, 29 duplicate samples (8–10 in each city) were col-lected and the duplicate measurements were averaged. Sixteen (7%) samples were below the batch-specific LOD (1.17 ng in Istanbul, 2.90 ng in Moscow, and 5.54 ng in Cairo) and replaced by half the LOD.
Saliva Cotinine
To collect saliva, employees chewed on a cotton swab for at least 45 seconds, or until saturated, and expelled the swab directly into a plastic collection tube (Salivette, Sarstedt, Numbrecht, Germany). Samples were stored in a cooler with ice until the end of the day and stored at −20°C before being shipped on dry ice to JHSPH. Samples were thawed, vortexed, and centrifuged to remove mucins and particulate matter. Salivary cotinine was measured using a high sensitivity quantitative enzyme linked immunoassay kit (Salimetrics LLC, State College, PA). Ten (5.8%) samples were below the LOD (1 ng/mL) and recorded as half the LOD.
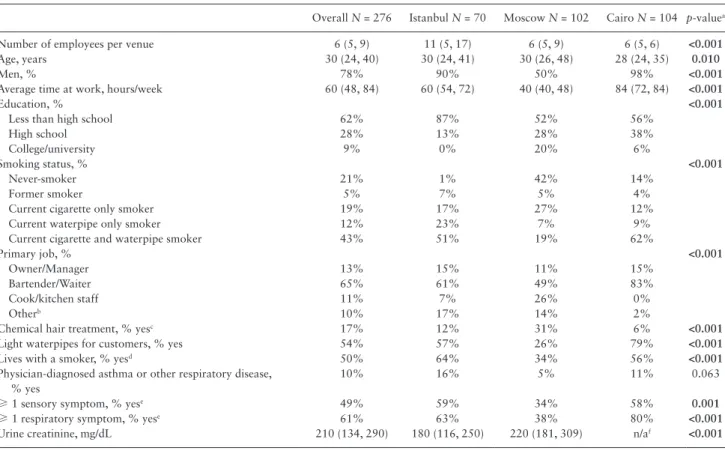
Table 1. Characteristics of Employees of Waterpipe Tobacco Venues in Istanbul, Moscow, and Cairo in 2013–2014
Overall N = 276 Istanbul N = 70 Moscow N = 102 Cairo N = 104 p-valuea
Number of employees per venue 6 (5, 9) 11 (5, 17) 6 (5, 9) 6 (5, 6) <0.001
Age, years 30 (24, 40) 30 (24, 41) 30 (26, 48) 28 (24, 35) 0.010
Men, % 78% 90% 50% 98% <0.001
Average time at work, hours/week 60 (48, 84) 60 (54, 72) 40 (40, 48) 84 (72, 84) <0.001
Education, % <0.001
Less than high school 62% 87% 52% 56%
High school 28% 13% 28% 38%
College/university 9% 0% 20% 6%
Smoking status, % <0.001
Never-smoker 21% 1% 42% 14%
Former smoker 5% 7% 5% 4%
Current cigarette only smoker 19% 17% 27% 12%
Current waterpipe only smoker 12% 23% 7% 9%
Current cigarette and waterpipe smoker 43% 51% 19% 62%
Primary job, % <0.001
Owner/Manager 13% 15% 11% 15%
Bartender/Waiter 65% 61% 49% 83%
Cook/kitchen staff 11% 7% 26% 0%
Otherb 10% 17% 14% 2%
Chemical hair treatment, % yesc 17% 12% 31% 6% <0.001
Light waterpipes for customers, % yes 54% 57% 26% 79% <0.001
Lives with a smoker, % yesd 50% 64% 34% 56% <0.001
Physician-diagnosed asthma or other respiratory disease, % yes
10% 16% 5% 11% 0.063
≥ 1 sensory symptom, % yese 49% 59% 34% 58% 0.001
≥ 1 respiratory symptom, % yese 61% 63% 38% 80% <0.001
Urine creatinine, mg/dL 210 (134, 290) 180 (116, 250) 220 (181, 309) n/af <0.001
Categorical variables are percentages of total sample (N). Continuous variables are median (25th percentile, 75th percentile).
ap-values are Pearson’s chi-square test of independence for categorical variables and one-way ANOVA for continuous variables. Bold values indicate differences
were significant at p < 0.05.
b“Other” jobs included security (N = 12), waterpipe preparation (N = 6), cleaning (N = 6), and other miscellaneous positions.
cColor or dye, bleach, highlighted, perm, or straightened.
dOf the employees with a household member that smokes, the majority (83%) of these household members smoked cigarettes.
eNumber (percentage) reporting at least one sensory symptom (ie, red or irritated eyes; runny nose, sneezing or nose irritation; sore or scratchy throat) or at least
one respiratory symptom (ie, wheezing or whistling in chest; feeling short of breath, coughing in morning, coughing during the rest of the day or at night, or bring-ing up any phlegm).
Urine Cotinine, NNAL, and 1-OHPG
Employees collected a urine sample (spot urine or first morning void, whichever was possible) using the provided collection cups. Employees brought the sample with them to work and the samples were refrigerated until picked up by fieldworkers. Samples were stored at −20°C before being shipped on dry ice to JHSPH. Urine creatinine, to correct for variability of urine dilution, was meas-ured using a creatinine colorimetric assay kit (Cayman Chemicals, Ann Arbor, MI). No samples were below the LOD (2 mg/dL).
We measured urine cotinine using a direct enzyme linked immuno-assay kit (Calbiotech, Spring Valley, CA). Thirty (17.9%) samples, all from Moscow, were below the LOD (1 µg/L) and replaced with half the LOD. Urinary 1-OHPG concentrations were measured using immunoaffinity chromatography and synchronous fluores-cence spectroscopy (Perkin-Elmer LS50, Waltham, MA) as previously described.29,30 In our laboratory, the inter-batch coefficient of variation
for 1-OHPG is typically 8%–10%. Three (1.8%) samples were below the LOD (0.02 ng/mL) and recorded as half the LOD. We measured urine NNAL adapting the protocol from Shimelis et al.31 and analyzed
using gas chromatography and triple quadrupole mass spectrometry (GC-MS/MS, Thermo Scientific) in selected reaction monitoring mode with capillary column (30 m × 0.25 mm internal diameter, 0.25 µm film thickness) (TG-5MS, Thermo Scientific). Fifty-eight (35%) sam-ples (50 samsam-ples in Moscow and eight samsam-ples in Istanbul) were below the LOD (5.9 pg/mL) and recorded as half the LOD.
Indoor Air Secondhand Smoke Markers As described previously,16 we measured PM
2.5, CO, particle-bound
PAHs (p-PAHs), NNK, and nicotine in indoor air in each of the ven-ues. Real-time measurements of PM2.5 and CO were collected for up to 4 hours during peak business hours and p-PAHs were collected for 1–2 hours during peak business hours. PM2.5 concentrations were corrected for relative humidity and we applied a waterpipe-specific gravimetric correction factor of 0.6.32 NNK was collected for up to
23 hours on PM2.5 filters and nicotine filters were left in the venues for approximately 3–4 days.
Statistical Analysis
SHS biomarker concentrations were right-skewed; therefore, medi-ans or geometric memedi-ans were used for analysis. After examining the distribution of each biomarker by smoking status and city, we restricted further analyses to nonsmoking employees (never and former smokers) to assess the influence of venue and employee char-acteristics on biomarker concentrations derived from SHS, rather than active smoking. We divided the concentrations of urine bio-markers by urine creatinine in order to correct for variability in urine dilution. We assessed the correlation between each biomarker within employees using Spearman rank correlation coefficients.
In a separate model for each biomarker, we calculated geometric mean ratios (GMR) by employee and venue characteristics related to SHS exposure using multivariable linear regression with generalized estimating equations (GEE) with robust variance and an independ-ent correlation structure within venues. Sensitivity analyses assum-ing exchangeable correlation structure produced similar results (data not shown). GMR were adjusted in sequential models for city, age, sex, and living with a smoker. Adjustment for age, sex, and living with a smoker in sequentially adjusted models did not substantially change the associations and we present only fully-adjusted models. Models of hair nicotine were additionally adjusted for self-reported hair chemical treatment (eg, color or dye, bleach, highlights, perm,
or straightened). Venue mean indoor air nicotine, NNK, and p-PAHs were categorized into tertiles excluding 10 venues without nonsmok-ing employees and separately for each biomarker because of variable sample sizes. For indoor air SHS markers, we calculated the GMR of each biomarker comparing the 75th to the 25th percentile of
log-transformed venue mean indoor air SHS concentrations. Sensitivity analyses using urine biomarkers without dividing by creatinine and adjusting in models for urine creatinine found similar results.
Statistical analyses were performed with Stata Version 12.1 (StataCorp, College Station, TX) and R Version 3.2.2 (R Foundation for Statistical Computing, www.r-project.org, Vienna, Austria). All statistical tests were two-sided and p-values less than .05 were con-sidered statistically significant.
Results
Employee Characteristics
Most waterpipe tobacco venue employees in Istanbul and Cairo were men (90% and 98%, respectively), whereas there were equal pro-portions of men and women employees in Moscow (Table 1). The employee median (interquartile range [IQR]) age was 30 (24, 40) years and most employees had less than a high school education (62%). The most common primary job descriptions were bartender/waiter (65%), owner/manager (13%), and cook/kitchen staff (11%). Overall, 54% of employees light waterpipes for customers, ranging from 26% in Moscow to 79% in Cairo. Seventy-three (26%) employees were non-smokers, including former and never-smokers (6 in Istanbul, 48 in Moscow, and 19 in Cairo). The prevalence of current smoking, either cigarette or waterpipe, was 53%, 82%, and 91% among employees in Moscow, Istanbul, and Cairo, respectively. Smoking both cigar-ette and waterpipe was more common in Cairo (62%) and Istanbul (51%), compared to Moscow (19%). Smoking waterpipe exclusively was more common in Istanbul (23%), compared to Moscow (7%) and Cairo (9%). Between 34% and 64% of employees lived with at least one smoker in their household. Self-reported data on employee opin-ions about their workplace air quality are presented in Supplementary Table 2.
SHS Biomarker Concentrations by Smoking Status In nonsmoking employees, the median (IQR) concentrations of SHS biomarkers were 1.1 (0.2, 40.9) µg/g creatinine for urine cotinine, 5.5 (2.0, 15.0) ng/mL for saliva cotinine, 0.95 (0.36, 5.02) ng/mg for hair nicotine, 1.48 (0.98, 3.97) pg/mg creatinine for urine NNAL, 0.54 (0.25, 0.97) pmol/mg creatinine for urine 1-OHPG, and 1.67 (1.33, 2.33) ppm for exhaled CO (Supplementary Figure 1, Supplementary Table 3). Median (IQR) concentrations of urine biomarkers not divided by urine creatinine are presented in Supplementary Table 4. Among nonsmoking employees, we found moderate correlations among the tobacco-specific biomarkers hair nicotine, urine cotinine, saliva cotinine, and urine NNAL (Spearman ρ range from 0.36 to 0.61, N range from 51 to 53) (Table 2). Concentrations of urine coti-nine and urine 1-OHPG were also moderately correlated (Spearman ρ = 0.33, N = 52). We found similar results in a sensitivity analysis stratified by city (data not shown).
SHS Biomarkers by Employee Characteristics in Nonsmoking Employees
Among nonsmoking employees, an 8-hour increase in the average number of hours spent at work per week was associated with higher urine cotinine (GMR: 1.68, 95% CI: 1.20, 2.37) and hair nicotine
(GMR: 1.22, 95% CI: 1.05, 1.43) after adjustment for city, age, sex, and living with a smoker (Table 3). Compared to owners and man-agers, employees working as cooks or kitchen staff had significantly lower geometric mean concentrations of urine cotinine (GMR: 0.05, 95% CI: 0.003, 0.76) and saliva cotinine (GMR: 0.18, 95% CI: 0.05, 0.62). Employees that lit waterpipes for customers had higher geometric mean saliva cotinine (GMR: 2.83, 95% CI: 1.05, 7.62). Living with a smoker was associated with higher geometric mean saliva cotinine (GMR: 3.54, 95% CI: 1.07, 4.23) and hair nicotine (GMR: 2.13, 95% CI: 1.07, 4.23). There were no statistically signifi-cant associations with urine NNAL, urine 1-OHPG, or exhaled CO. SHS Biomarkers by Venue Characteristics in
Nonsmoking Employees
Among nonsmoking employees, working in a venue with a mean nic-otine concentration in the highest tertile was associated with higher geometric mean urine cotinine (GMR: 95% CI: 6.43, 95% CI: 1.50, 27.66) compared to the lowest tertile in adjusted models (Table 4). Compared to employees in venues in the lowest tertile of mean indoor air p-PAHs, employees working in venues with mean p-PAHs in the highest two tertiles had significantly higher urine 1-OHPG (GMR: 2.64, 95% CI: 1.54, 4.55 and GMR: 2.15, 95% CI: 1.36, 3.40, respectively). Venue concentrations of air NNK were not nificantly related to SHS biomarkers. There were no statistically sig-nificant associations with saliva cotinine, hair nicotine, urine NNAL, and exhaled CO concentrations. Supplementary Table 5 presents the association between ventilation or air condition, venue volume, number of smokers, and smoker density. While a higher number of waterpipe smokers was positively associated with higher CO levels, for other biomarkers the associations were inverse.
Discussion
We observed that nonsmoking employees of waterpipe tobacco ven-ues in Istanbul, Moscow, and Cairo had high levels of SHS biomark-ers, including measurable levels of two biomarkers of carcinogens (urine NNAL and 1-OHPG). Although the associations between bio-marker concentrations and venue and employee characteristics were inconsistent, measures of higher occupational exposure to SHS, such as the number of hours spent at work and whether the employee was responsible for lighting waterpipes, were associated with higher levels of the tobacco-specific biomarkers, urine and saliva cotinine and hair nicotine. In addition, higher indoor air nicotine concentra-tions were associated with higher urine cotinine, and higher indoor p-PAHs were associated with higher 1-OHPG concentrations. Studying real-world exposure to SHS in waterpipe venues and bio-markers of SHS exposure, particularly those related to early adverse health effects, is important to demonstrate that SHS in waterpipe tobacco venues may be harmful to the health of employees and the public. Employees who spend a substantial number of hours work-ing in the venues, as in this study, may be especially vulnerable.
Compared to our study, the few studies that have previously measured biomarkers of SHS among persons exposed to SHS in waterpipe venues have generally had small sample sizes and meas-ured a limited number of biomarkers of SHS.19–22 Mean
concentra-tions of the inflammatory cytokine interferon-γ and exhaled CO in 10 employees of waterpipe venues in New York City were signifi-cantly higher at the end of a shift compared to samples taken pre-shift, whereas concentrations of saliva cotinine were not statistically different.20 In exhaled breath samples collected from employees in
12 waterpipe venues in Toronto, the mean exhaled CO was six times higher in high indoor air nicotine compared to venues with low air nicotine.21 In 50 waterpipe venue employees in Beirut, mean exhaled
Table 2. Correlations Between Secondhand Smoke Biomarker Concentrations Among Nonsmoking Employees of Waterpipe Tobacco
Venues in Istanbul, Moscow, and Cairo Urine Cotinine (µg/g creatinine) Saliva Cotinine (ng/ mL) Hair Nicotine (ng/mg) Urine NNAL (pg/mg creatinine) 1-OHPG `(µg/g creatinine) Exhaled CO (ppm) N P N P N P N P N P N P Urine cotinine (µg/g creatinine) 52 1.00 Saliva Cotinine (ng/mL) 51 0.54 53 1.00 Hair Nicotine (ng/mg) 52 0.53 53 0.53 72 1.00 Urine NNAL (pg/mg creatinine) 51 0.61 51 0.36 51 0.53 53 1.00 Urine 1-OHPG (µg/g creatinine) 52 0.33 51 0.14 52 0.04 51 0.11 52 1.00 Exhaled CO (ppm) 52 -0.08 53 0.17 72 0.05 51 0.09 52 0.12 73 1.00
N = Number of employees; NNAL = urine 4-(methylnitrosamino)-1-(3-pyridyl)-1-butanol; 1-OHPG = urine 1-hydroxypyrene glucuronide; ρ = Spearman rho
correlation coefficient.
Bold values indicate correlation was significant at p < .05.
Table 3.
R
atio of Geometric Means of S
econdhand Smok
e Biomark
er Concentrations by Employee Characteristics in Nonsmoking Employees of
W aterpipe Tobacco Venues in Istanbul, Moscow , and Cairo in 20 13–20 14 Urine Cotinine N = 52 Saliva Cotinine N = 53 Hair Nicotine N = 71 Urine NNAL N = 51 Urine 1-OHPG N = 52 Exhaled CO N = 73 N GMR (95% CI) N GMR (95% CI) N GMR (95% CI) N GMR (95% CI) N GMR (95% CI) N GMR (95% CI) T
ime spent at work <50 h/week
38 1.00 (reference) 38 1.00 (reference) 39 1.00 (reference) 38 1.00 (reference) 38 1.00 (reference) 39 1.00 (reference) ≥ 50 h/week 14 5.94 (1.56, 22.54) 15 0.95 (0.40, 2.28) 33 2.90 (1.71, 4.90) 13 1.57 (0.70, 3.50) 14 1.42 (0.80, 2.50) 34 0.64 (0.37, 1.11) Per 8 h/week 52 1.68 (1.20, 2.37) 53 0.86 (0.63, 1.16) 71 1.22 (1.05, 1.43) 51 0.99 (0.75, 1.31) 52 0.97 (0.83, 1.14) 73 0.92 (0.85, 1.01) Job Owner/Manager 9 1.00 (reference) 9 1.00 (reference) 11 1.00 (reference) 9 1.00 (reference) 9 1.00 (reference) 11 1.00 (reference) Bartender/W aiter 21 0.54 (0.02, 12.81) 22 0.73 (0.13, 4.17) 37 0.99 (0.41, 2.39) 21 1.12 (0.30, 4.09) 21 0.92 (0.49, 1.73) 38 0.94 (0.66, 1.33) Cook/kitchen staff 15 0.05 (0.003, 0.76) 14 0.18 (0.05, 0.62) 15 0.56 (0.16, 2.01) 14 0.44 (0.13, 1.42) 15 0.73 (0.04, 1.24) 15 0.77 (0.46, 1.27) Other a 7 1.38 (0.06, 34.44) 8 0.92 (0.14, 6.04) 9 1.06 (0.40, 2.82) 7 0.84 (0.28, 2.48) 7 1.22 (0.68, 2.20) 9 0.64 (0.39, 1.05)
Light waterpipes for customers No
41 1.00 (reference) 42 1.00 (reference) 48 1.00 (reference) 40 1.00 (reference) 41 1.00 (reference) 49 1.00 (reference) Ye s 11 0.67 (0.08, 5.77) 11 2.83 (1.05, 7.62) 24 0.93 (0.30, 2.86) 11 1.17 (0.46, 3.00) 11 1.62 (0.73, 3.59) 24 0.86 (0.58, 1.29)
Lives with a smoker No
36 1.00 (reference) 36 1.00 (reference) 45 1.00 (reference) 36 1.00 (reference) 36 1.00 (reference) 46 1.00 (reference) Ye s 16 2.49 (0.26, 23.79) 17 3.54 (1.78, 7.02) 27 2.13 (1.07, 4.23) 15 1.40 (0.70, 2.80) 16 1.18 (0.56, 2.50) 27 1.22 (0.93, 1.61)
Geometric mean ratios were adjusted by city
, age,
sex,
and lives with a smoker (yes/no).
Models of hair nicotine were also adjusted for chemical hair treatment (yes/no).
Bold values indicate associations were significant
at
p < 0.05.
CI = Confidence interval; GMR = Geometric mean ratio;
N
, Number of employees; NNAL = urine 4-(methylnitrosamino)-1-(3-pyridyl)-1-butanol; 1-OHPG = urine 1-hydroxypyrene glucuronide.
aOther includes security
, waterpipe preparation,
cleaning,
Table 4.
R
atio of Geometric Means of S
econdhand Smok e Biomark er Concentrations by Venue Indoor Air S econdhand Smok
e Measurements in Nonsmoking Employees of
W
aterpipe
Tobacco
Venues in Istanbul, Moscow
, and Cairo in 20 13–20 14 Urine Cotinine N = 52 Saliva Cotinine N = 53 Hair Nicotine N = 71 Urine NNAL N = 51 Urine 1-OHPG N = 52 Exhaled CO N = 73 N GMR (95% CI) N GMR (95% CI) N GMR (95% CI) N GMR (95% CI) N GMR (95% CI) N GMR (95% CI) V enue Mean Air Nicotine (μg/m 3) Tertile 1 a 19 1.00 (reference) 21 1.00 (reference) 25 1.00 (reference) 19 1.00 (reference) 19 1.00 (reference) 27 1.00 (reference) Tertile 2 a 21 0.23 (0.05, 1.11) 16 0.56 (0.21, 1.46) 33 1.37 (0.65, 2.89) 21 0.39 (0.28, 0.56) 21 0.84 (0.43, 1.64) 33 0.82 (0.54, 1.24) Tertile 3 a 12 6.43 (1.50, 27.66) 14 0.79 (0.34, 1.82) 11 1.29 (0.40, 4.16) 11 1.08 (0.53, 2.18) 12 1.08 (0.54, 2.18) 13 0.69 (0.43, 1.10) 75th vs. 25th percentile b 52 2.23 (0.13, 39.7) 53 0.54 (0.15, 1.93) 71 1.40 (0.65, 3.04) 51 0.71 (0.32, 1.57) 52 0.82 (0.40, 1.70) 73 0.60 (0.33, 1.11) V enue Mean Air NNK (ng/m 3) Tertile 1 a 17 1.00 (reference) 15 1.00 (reference) 25 1.00 (reference) 16 1.00 (reference) 17 1.00 (reference) 25 1.00 (reference) Tertile 2 a 16 0.45 (0.05, 4.10) 17 1.69 (0.48, 5.99) 22 0.74 (0.31, 1.76) 16 0.80 (0.33, 1.93) 16 0.58 (0.32, 1.03) 26 0.92 (0.62, 1.37) Tertile 3 a 17 1.37 (0.12, 16.28) 17 0.97 (0.33, 2.89) 20 1.30 (0.57, 2.99) 17 1.38 (0.54, 3.52) 17 1.50 (0.72, 3.09) 20 0.75 (0.44, 1.26) 75th vs. 25th percentile b 50 1.41 (0.43, 4.70) 51 0.92 (0.51, 1.66) 69 0.98 (0.59, 1.61) 49 1.15 (0.68, 1.94) 50 1.23 (0.85, 1.78) 71 0.91 (0.73, 1.14) V enue Mean Air p-P AHs (ng/m 3) Tertile 1 a 14 1.00 (reference) 15 1.00 (reference) 21 1.00 (reference) 14 1.00 (reference) 14 1.00 (reference) 24 1.00 (reference) Tertile 2 a 7 1.45 (0.17, 12.09) 6 0.83 (0.32, 2.16) 11 1.58 (0.68, 3.70) 6 0.31 (0.11, 0.88) 7 2.64 (1.54, 4.55) 11 0.95 (0.60, 1.50) Tertile 3 a 7 11.33 (0.25, 506.6) 6 1.56 (0.29, 8.29) 11 2.45 (0.81, 7.42) 7 1.79 (0.69, 4.63) 7 2.15 (1.36, 3.40) 12 1.30 (0.93, 1.81) 75th vs. 25th percentile b 28 7.31 (0.84, 63.32) 29 1.96 (0.72, 5.34) 46 1.00 (0.60, 1.68) 27 0.99 (0.48, 2.03) 28 2.15 (1.74, 2.65) 47 1.14 (0.99, 1.31)
Geometric mean ratios were adjusted by city
, age,
sex,
and lives with a smoker (yes/no).
Bold values indicate associations were significant at
p < 0.05.
CI = Confidence interval; GMR = Geometric mean ratio;
N
= Number of employees; NNAL = urine 4-(methylnitrosamino)-1-(3-pyridyl)-1-butanol; 1-OHPG = urine 1-hydroxypyrene glucuronide.
aTertiles of each marker of indoor air SHS (nicotine, NNK, and p-P AHs) were created at the venue level, among venues with at least one nonsmoker . Samples sizes
for each tertile vary
because
not
every venue had
measured air NNK and p-P AHs (97% [ N = 35] of venues had NNK, and 69% [ N = 25] of venues had p-P AHs),
and because the numbers of nonsmoking employees with complete employee data varied by venue (mean 2; range:
1–7).
All venues had measured air nicotine.
b75 th vs. 25 th percentile of log-transformed venue mean concentrations of indoor air SHS markers. Interquartile ranges (25 th percentile, 75 th percentile) of air nicotine, NNK, and mean p-P AHs were 22 (0.05, 22) µg/m 3, 1.2 (0.5, 1.7) ng/m 3, and 83 (25, 108) ng/m 3, respectively .
CO concentrations were significantly associated with the number of hours of weekly exposure to waterpipe smoke.19 In 103
nonsmok-ers with who attended a social event at a venue or home event with waterpipe smoking, there was a nonstatistically significant increase in the median concentration of urine S-phenylmercapturic acid (SPMA, a metabolic of benzene, a hemotoxicant and carcinogen)22
comparing samples collected before and after the event.
Higher exhaled CO has been associated with an increased risk of respiratory diseases33 and there are case reports of acute CO poisoning
after waterpipe smoking.7 Mean exhaled CO concentrations among
fieldworkers after two hours inside a waterpipe venue were 3.4 ppm in low air nicotine venues (mean air CO < 1 µg/m3) and 22.2 ppm in
high air nicotine venues (mean CO ≥ 1 µg/m3) in Toronto,21 49.4 ppm
in employees at the end of a work shift in New York City waterpipe venue,20 and 26.8 ppm in nonsmoking employees of waterpipe venues
in Beirut.19 Compared to those studies, the exhaled CO concentrations
(median 1.67 ppm in nonsmokers) in this study were relatively low, which could be explained by the short half-life of CO and our sam-pling when business activity was low for convenience.
Urine 1-OHPG is a biomarker of exposure to PAHs, many of which are carcinogenic.34 PAHs are formed by incomplete
com-bustion of organic material and are not specific to tobacco. We did not have information on other environmental exposures and diet that can also contribute to PAH exposure.34 No previous studies of
SHS in waterpipe venues or waterpipe SHS have measured urine 1-OHPG; however, several studies have demonstrated that urine 1-OHPG concentrations were associated with SHS exposure.35,36 In
a study of California teachers, the median concentration of 1-OHPG in nonsmokers exposed to SHS was 0.25 pmol/mL compared to 1.61 pmol/mL in smokers.35 Among nonsmoking military cooks in
Taiwan, pre- and postshift concentrations of 1-OHPG were 1.2 and 1.8 pmol/mL, respectively.37 The median concentrations of 1-OHPG
in nonsmokers were 0.48 pmol/mL (0.35 pmol/mg creatinine) in Istanbul and 1.14 pmol/mL (0.61 pmol/mg creatinine) in Moscow. Thus, concentrations of 1-OHPG in employees in this study were higher than some other studies of individuals exposed to SHS and were even similar to active smokers in some groups. In this study, we also observed an adjusted association between venue mean air p-PAH concentrations and geometric mean concentrations of urine 1-OHPG.
In nonsmokers, the presence of NNAL, a metabolite of the tobacco-specific nitrosamine NNK, a lung carcinogen found in indoor air SHS, provides a biochemical link between SHS exposure and risk of lung cancer.34 With a half-life of 10–18 days, urine NNAL
is likely to be a good biomarker of long-term exposure over the past 6–12 weeks.38 In a small sample of nonsmokers in Syria, the mean
(95% CI) urine NNAL was 3.6 (1.6, 7.9) pg/mg creatinine; how-ever, no information was reported about exposure to SHS.39 In the
U.S. general population, NNAL was detectable in 41% of nonsmok-ers; the 75th percentile was 2.3 pg/mg creatinine and 90th percentile
was 6.8 pg/mg creatinine in adults over 20 years.40 Concentrations of
urine NNAL were higher in nonsmokers in Istanbul (median 6.3 pg/ mg creatinine) compared to Moscow (median 1.5 pg/mg creatinine). Hair nicotine is a marker of past long-term exposure to tobacco and cotinine is the major metabolite of nicotine.27 Although the
half-lives of urine and saliva cotinine are similar, urine cotinine is more sensitive for measuring low levels of cotinine, and the interpretation of saliva cotinine can be limited by variability across individuals.27
In comparison, nonsmokers in the general population of Israel (geo-metric mean 1.3 µg/g creatinine),41 the urine cotinine concentrations
among nonsmoking employees were higher in Istanbul (median 5.2 µg/g creatinine) and lower in Moscow (0.6 µg/g creatinine). The mean concentration of saliva cotinine was 27.9 ng/mL in New York City waterpipe venue employees,20 compared to a median of 2 ng/
mL in nonsmokers in Istanbul and 6 ng/mL in Moscow. In bars or restaurants that allowed cigarette smoking in Chile, the median hair nicotine concentration in 28 nonsmoking employees was 1.9 ng/ mg.42 In our study, concentrations of hair nicotine varied
consider-ably by city: median concentrations of hair nicotine in nonsmoking employees were 2.3 ng/mg in Istanbul, 0.6 mg/mg in Moscow, and 5.8 ng/mg in Cairo. Lower hair nicotine concentrations despite simi-lar or even higher environmental SHS exposure concentrations in Russia compared to Middle Eastern and Asian countries have also been found in studies of SHS exposure in mothers and children43 and
in bar and nightclub employees.44 In this study, urine cotinine and
hair nicotine concentrations were associated with higher number of work hours per week and saliva cotinine was associated with light-ing waterpipes for customers, suggestlight-ing that waterpipe employees have substantial occupational exposure to tobacco SHS.
A major strength of this study was the breadth of objective measures of SHS exposure, using both indoor air markers of SHS and biomarkers of exposure to SHS in employee breath, urine, sal-iva, and hair. We selected these biomarkers to characterize exposure to different components of the complex mixture of SHS (tobacco-specific or related to combustion), to represent a range of different exposure time periods (from short-term biomarkers with a half-life of 2–4 hours, like exhaled CO, to long-term biomarkers that repre-sent the past three months of exposure, like hair nicotine), and to allow comparisons to previous studies which often measured only one or a few biomarkers of SHS exposure. Although nicotine and cotinine in urine, saliva, and hair tend to be highly correlated, we measured this important tobacco-specific biomarker in multiple media for several reasons. The longer half-life of hair nicotine com-pared to urine and saliva cotinine allowed us to capture temporal variation in the employee’s SHS exposure. Accurate measurement of urine biomarkers requires correction for urine dilution, saliva meas-urements may be biased by age, gender, race, oral pH, diet, dehydra-tion, or drug treatment, and chemical treatment of hair can lower concentrations.27 Finally, compared to saliva cotinine, urine cotinine
is a more sensitive assay and is able to detect lower levels of expos-ure.27 To our knowledge, this is the first study of SHS in waterpipe
tobacco venues to measure concentrations of urine NNAL, urine 1-OHPG, or hair nicotine. Other strengths included the multi-city design, high employee participation rate, and self-reported data on both cigarette and waterpipe smoking status and on exposure to SHS in the home.
This study also had some limitations. Our sample of waterpipe tobacco venues in each city was selected by convenience; therefore, these venues may not be representative of all waterpipe venues in each city. Further, fear of regulation by less compliant venues may have played a role in the low venue participation rate (ranging from 32%–34%) in each city, which may indicate that the magnitude of the indoor air SHS in waterpipe venues is larger than we observed. Most of the sampling was conducted during colder months when ventila-tion would be limited, especially in Istanbul and Moscow, which could have resulted in higher indoor air concentrations of SHS constituents and biomarker levels. While this may reflect higher exposures than other seasons, it represents real worker exposure. To isolate the effects of occupational SHS exposure, we restricted our analyses to a small group of employees who self-reported as never or former smokers.
The same biomarkers that we used to assess SHS exposure are also found in cigarette and waterpipe smokers.39,45–48 We hypothesized
that the exposure of nonsmoking employees would best reflect occu-pational exposure, rather than personal tobacco use, and would be more strongly related to employee and venue characteristics. Although the tobacco-specific biomarkers urine cotinine or saliva cotinine are often used as objective markers, identifying a threshold to differ-entiate active versus passive exposure to tobacco is difficult in this setting due to the substantial occupational SHS exposure. We used whether the employee lived with a smoker as a proxy for secondhand smoke exposure in the home; however, we could not account for SHS exposures in other places and residual confounding is possible. This study was conducted among employees of waterpipe venues in the real world, and we may not have been able to account for import-ant sources of variability that could explain some of the heterogeneity of our findings across biomarkers. We collected breath, saliva, and hair samples at times of low business activity for convenience and employees may have been at work for varying amounts of time before sampling. The biomarkers measured in this study characterize differ-ent exposure windows depending on the half-lives and concdiffer-entra- concentra-tions could reflect exposure at work, in public places, or in the home. However, employees reported spending a substantial number of hours at work and therefore, we believe that occupational exposure should not be discounted. For indoor air SHS concentrations, the average concentrations measured in the venues may not represent the relevant time period captured by the biomarkers of exposure. Finally, both cig-arette and waterpipe smoking were observed in waterpipe venues16
and we could not differentiate between sources of SHS.
Turkey, Russia, and Egypt ratified the current global regula-tory standard for tobacco products, the World Health Organization Framework Convention on Tobacco Control (WHO FCTC), between 2004 and 2008.49 Unfortunately, waterpipe-specific regulation in
global tobacco control frameworks is rare, and smoke-free clean air regulation of waterpipe tobacco has been hampered by lack of enforcement and noncompliance in many countries,4 including
Turkey.50 Smoke-free legislation banning cigarette smoking in public
places in Turkey was extended to include waterpipe venues in early 2013, at the time of this study’s data collection.4 In Russia,
regu-lations related to advertising tobacco products specifically mention waterpipe (“hookah”) but there is no smoke-free legislation for pub-lic places.4
In summary, we found high levels of SHS biomarkers in non-smoking employees of waterpipe venues in Istanbul, Moscow, and Cairo, including markers of burning tobacco, combustion by-prod-ucts, and detectable levels of biomarkers that indicate potentially carcinogenic exposures to tobacco-specific nitrosamines and PAHs. Nonsmoking employees of waterpipe tobacco venues and patrons may be at an increased risk of the health problems associated of SHS exposure. Smoke-free legislation has been tremendously successful in reducing exposure to SHS from cigarettes.2 Policy makers should
ensure that waterpipe tobacco smoking and waterpipe venues are not excluded from clean air regulations.4 Additional policy and
research goals should include reducing exposure to SHS in water-pipe tobacco venues by working with venues and their employees to identify and remove barriers to compliance and conducting periodic surveillance to ensure continuing compliance with smoke-free legis-lation. As called for in a recent article,4 the unique aspects of
water-pipe smoking and the waterwater-pipe industry may require the creation of a complementary regulatory framework to the WHO FCTC that is specific to waterpipe smoking.
Supplementary Material
Supplementary data are available at Nicotine & Tobacco Research online.
Funding
This study was supported by the Institute for Global Tobacco Control at the Johns Hopkins Bloomberg School of Public Health (#119187) with funding from the Bloomberg Initiative to Reduce Tobacco Use and the National Heart, Lung, and Blood Institute (1R01HL134149-01, AN-A, PS; 5T32HL007024, KAM).
Declaration of Interests
The authors declare no potential conflicts of interest.
Acknowledgments
The authors gratefully acknowledge the contributions of our fieldworkers: Bugrahan Cizenmih, Serdar Doruk Avunduk, Deniz Ever, Merve Kayserili, Pelinsu Çagla Batur, Tufan Ayrık, Ortaç Ikizler, Didem Ungor, Gizem Kural, Evren Ceylan Morgul in Istanbul; Bogdan Ladan, Nina Slepchenko, Anna Zavelskay in Moscow; and Basem and Baher Higazy in Cairo.
References
1. Centers for Disease Control and Prevention. The Health Consequences of Involuntary Exposure to Tobacco Smoke: A Report of the Surgeon
General. 2006.
http://www.surgeongeneral.gov/library/reports/second-handsmoke/fullreport.pdf. Accessed January 20, 2013.
2. Centers for Disease Control and Prevention. The Health Consequences of Smoking - 50 Years of Progress: A Report of the Surgeon General. 2014.
http://www.surgeongeneral.gov/library/reports/50-years-of-progress/.
Accessed August 20, 2014.
3. Callinan JE, Clarke A, Doherty K, Kelleher C. Legislative smoking bans for reducing secondhand smoke exposure, smoking prevalence and tobacco consumption. Cochrane Database Syst Rev. 2010;4(4):CD005992. 4. Jawad M, El Kadi L, Mugharbil S, Nakkash R. Waterpipe tobacco
smok-ing legislation and policy enactment: a global analysis. Tob Control. 2015;24(suppl 1):i60–i65.
5. World Health Organization. Advisory Note: Waterpipe Tobacco Smoking: Health Effects, Research Needs and Recommended Actions by Regulators.
2005. http://www.who.int/tobacco/global_interaction/tobreg/waterpipe/
en/. Accessed April 12, 2013.
6. Maziak W, Taleb ZB, Bahelah R, et al. The global epidemiology of water-pipe smoking. Tob Control. 2015;24(suppl 1):i3–i12.
7. El-Zaatari ZM, Chami HA, Zaatari GS. Health effects associated with waterpipe smoking. Tob Control. 2015;24(suppl 1):i31–i43.
8. Waziry R, Jawad M, Ballout RA, Al Akel M, Akl EA. The effects of water-pipe tobacco smoking on health outcomes: an updated systematic review and meta-analysis. Int J Epidemiol. 2016;pii: dyw021.
9. Daher N, Saleh R, Jaroudi E, et al. Comparison of carcinogen, carbon mon-oxide, and ultrafine particle emissions from narghile waterpipe and cigarette smoking: Sidestream smoke measurements and assessment of second-hand smoke emission factors. Atmos Environ (1994). 2010;44(1):8–14. 10. Hammal F, Chappell A, Wild TC, et al. ‘Herbal’ but potentially
hazard-ous: an analysis of the constituents and smoke emissions of tobacco-free waterpipe products and the air quality in the cafés where they are served.
Tob Control. 2015;24(3):290–297.
11. Schubert J, Müller FD, Schmidt R, Luch A, Schulz TG. Waterpipe smoke: source of toxic and carcinogenic VOCs, phenols and heavy metals? Arch
Toxicol. 2015;89(11):2129–2139.
12. Shihadeh A. Investigation of mainstream smoke aerosol of the argileh water pipe. Food Chem Toxicol. 2003;41(1):143–152.
13. Kumar SR, Davies S, Weitzman M, Sherman S. A review of air quality, biological indicators and health effects of second-hand waterpipe smoke exposure. Tob Control. 2015;24(suppl 1):i54–i59.
14. Al Mulla A, Fanous N, Seidenberg AB, Rees VW. Secondhand smoke emission levels in waterpipe cafes in Doha, Qatar. Tob Control. 2015;24(e3):e227–e231.
15. Saade G, Seidenberg AB, Rees VW, Otrock Z, Connolly GN. Indoor secondhand tobacco smoke emission levels in six Lebanese cities. Tob
Control. 2010;19(2):138–142.
16. Moon KA, Magid H, Torrey C, et al. Secondhand smoke in water-pipe tobacco venues in Istanbul, Moscow, and Cairo. Environ Res. 2015;142:568–574.
17. Gurung G, Bradley J, Delgado-Saborit JM. Effects of shisha smoking on car-bon monoxide and PM2.5 concentrations in the indoor and outdoor micro-environment of shisha premises. Sci Total Environ. 2016;548–549:340–346. 18. Zhou S, Weitzman M, Vilcassim R, et al. Air quality in New York City
hookah bars. Tob Control. 2015;24(e3):e193–e198.
19. Zeidan RK, Rachidi S, Awada S, et al. Carbon monoxide and respiratory symptoms in young adult passive smokers: a pilot study comparing water-pipe to cigarette. Int J Occup Med Environ Health. 2014;27(4):571–582. 20. Zhou S, Behrooz L, Weitzman M, et al. Secondhand hookah smoke:
an occupational hazard for hookah bar employees. Tob Control. 2017;26(1):40–45.
21. Zhang B, Haji F, Kaufman P, Muir S, Ferrence R. ‘Enter at your own risk’: a multimethod study of air quality and biological measures in Canadian waterpipe cafes. Tob Control. 2015;24(2):175–181.
22. Kassem NO, Kassem NO, Jackson SR, et al. Benzene uptake in Hookah smokers and non-smokers attending Hookah social events: regulatory implications. Cancer Epidemiol Biomarkers Prev. 2014;23(12):2793–2809. 23. World Health Organization (WHO). Global Adult Tobacco Survey: Egypt
Country Report 2009. 2010. http://www.who.int/tobacco/surveillance/
gats_egypt/en/.
24. Republic of Turkey Ministry of Health. Global Adult Tobacco Survey
Turkey 2012. Publication No. 948. 2014. http://www.who.int/tobacco/
surveillance/gats_turkey/en/.
25. World Health Organization (WHO). Global Adult Tobacco Survey:
Russian Federation 2009 Country Report. 2010. http://www.who.int/
tobacco/surveillance/russian_federation/en/.
26. Menzies D, Nair A, Williamson PA, et al. Respiratory symptoms, pul-monary function, and markers of inflammation among bar workers before and after a legislative ban on smoking in public places. JAMA. 2006;296(14):1742–1748.
27. Avila-Tang E, Al-Delaimy WK, Ashley DL, et al. Assessing secondhand smoke using biological markers. Tob Control. 2013;22(3):164–171. 28. Kim SR, Wipfli H, Avila-Tang E, Samet JM, Breysse PN. Method
vali-dation for measurement of hair nicotine level in nonsmokers. Biomed
Chromatogr. 2009;23(3):273–279.
29. Strickland PT, Kang D, Bowman ED, et al. Identification of 1-hydroxypyr-ene glucuronide as a major pyr1-hydroxypyr-ene metabolite in human urine by syn-chronous fluorescence spectroscopy and gas chromatography-mass spectrometry. Carcinogenesis. 1994;15(3):483–487.
30. Santella RM, Lin CD, Dharmaraja N. Monoclonal antibodies to a benzo[a] pyrene diolepoxide modified protein. Carcinogenesis. 1986;7(3):441–444. 31. Shimelis O, Wihlborg A-K, Aurand C, Trinh A. Trace Level Analysis of
NNAL in Urine Using SupelMIP™ SPE – NNAL and LC-MS-MS. 2007. http://www.sigmaaldrich.com/content/dam/sigma-aldrich/docs/Supelco/ Bulletin/rep28.pdf. Accessed May 7, 2015.
32. Torrey CM, Moon KA, Williams DA, et al. Waterpipe cafes in Baltimore, Maryland: Carbon monoxide, particulate matter, and nicotine exposure. J
Expo Sci Environ Epidemiol. 2015;25(4):405–410.
33. Kharitonov SA, Barnes PJ. Biomarkers of some pulmonary diseases in exhaled breath. Biomarkers. 2002;7(1):1–32.
34. Hecht SS. Carcinogen derived biomarkers: applications in studies of human exposure to secondhand tobacco smoke. Tob Control. 2004;13(suppl 1):i48–i56.
35. Gunier RB, Reynolds P, Hurley SE, et al. Estimating exposure to polycyclic aromatic hydrocarbons: a comparison of survey, biological monitoring, and geographic information system-based methods. Cancer Epidemiol
Biomarkers Prev. 2006;15(7):1376–1381.
36. Suwan-ampai P, Navas-Acien A, Strickland PT, Agnew J. Involuntary tobacco smoke exposure and urinary levels of polycyclic aromatic hydro-carbons in the United States, 1999 to 2002. Cancer Epidemiol Biomarkers
Prev. 2009;18(3):884–893.
37. Lai CH, Jaakkola JJ, Chuang CY, et al. Exposure to cooking oil fumes and oxidative damages: a longitudinal study in Chinese military cooks. J Expo
Sci Environ Epidemiol. 2013;23(1):94–100.
38. Goniewicz ML, Havel CM, Peng MW, et al. Elimination kinetics of the tobacco-specific biomarker and lung carcinogen 4-(methylnitrosamino)-1-(3-pyridyl)-1-butanol. Cancer Epidemiol Biomarkers Prev. 2009;18(12):3421–3425. 39. Al Ali R, Rastam S, Ibrahim I, et al. A comparative study of systemic
carcinogen exposure in waterpipe smokers, cigarette smokers and non-smokers. Tob Control. 2015;24(2):125–127.
40. Bernert JT, Pirkle JL, Xia Y, Jain RB, Ashley DL, Sampson EJ. Urine con-centrations of a tobacco-specific nitrosamine carcinogen in the U.S. popu-lation from secondhand smoke exposure. Cancer Epidemiol Biomarkers
Prev. 2010;19(11):2969–2977.
41. Levine H, Berman T, Goldsmith R, et al. Exposure to tobacco smoke based on urinary cotinine levels among Israeli smoking and nonsmoking adults: a cross-sectional analysis of the first Israeli human biomonitoring study.
BMC Public Health. 2013;13:1241.
42. Iglesias V, Erazo M, Droppelmann A, et al. Occupational secondhand smoke is the main determinant of hair nicotine concentrations in bar and restaurant workers. Environ Res. 2014;132:206–211.
43. Wipfli H, Avila-Tang E, Navas-Acien A, et al.; Famri Homes Study Investigators. Secondhand smoke exposure among women and chil-dren: evidence from 31 countries. Am J Public Health. 2008;98(4): 672–679.
44. Jones MR, Wipfli H, Shahrir S, et al.; FAMRI Bar Study Investigators. Secondhand tobacco smoke: an occupational hazard for smok-ing and non-smoksmok-ing bar and nightclub employees. Tob Control. 2013;22(5):308–314.
45. Schubert J, Hahn J, Dettbarn G, Seidel A, Luch A, Schulz TG. Mainstream smoke of the waterpipe: does this environmental matrix reveal as signif-icant source of toxic compounds? Toxicol Lett. 2011;205(3):279–284.
46. Jacob P 3rd, Abu Raddaha AH, Dempsey D, et al. Comparison of nicotine
and carcinogen exposure with water pipe and cigarette smoking. Cancer
Epidemiol Biomarkers Prev. 2013;22(5):765–772.
47. Jacob P 3rd, Abu Raddaha AH, Dempsey D, et al. Nicotine, carbon
mon-oxide, and carcinogen exposure after a single use of a water pipe. Cancer
Epidemiol Biomarkers Prev. 2011;20(11):2345–2353.
48. St Helen G, Benowitz NL, Dains KM, Havel C, Peng M, Jacob P 3rd.
Nicotine and carcinogen exposure after water pipe smoking in hookah bars. Cancer Epidemiol Biomarkers Prev. 2014;23(6):1055–1066. 49. WHO Framework Convention on Tobacco Control. Chapter IX. Part
4. United Nations, Geneva. https://treaties.un.org/Pages/CTCs.aspx.
Accessed 21 May 2003.
50. Aherrera A, Çarkoğlu A, Hayran M, et al. Factors that influence attitude and enforcement of the smoke-free law in Turkey: a survey of hospitality venue owners and employees. Tob Control. 2016. doi:10.1136/tobaccocon-trol-2016-053088. https://www.ncbi.nlm.nih.gov/pubmed/?term=27645254