Secondhand smoke in waterpipe tobacco venues in Istanbul, Moscow,
and Cairo
Katherine A. Moon
a,n, Hoda Magid
a, Christine Torrey
a, Ana M. Rule
a,
Jacqueline Ferguson
a, Jolie Susan
a, Zhuolu Sun
a, Salahaddin Abubaker
a,
Vladimir Levshin
b, Asl
ı Çarkoğlu
c, Ghada Nasr Radwan
d, Maha El-Rabbat
d,
Joanna Cohen
a, Paul Strickland
a, Ana Navas-Acien
a, Patrick N. Breysse
a,1 aJohns Hopkins University Bloomberg School of Public Health, Baltimore, MD, USA
b
Russian Cancer Research Center, Moscow, Russian Federation
c
Kadir Has University, Istanbul, Turkey
dCairo University, Cairo, Egypt
a r t i c l e i n f o
Article history: Received 2 July 2015 Received in revised form 10 August 2015 Accepted 11 August 2015
Keywords: Secondhand smoke Waterpipe smoking Indoor air pollution Tobacco smoke pollution
a b s t r a c t
Objective: The prevalence of waterpipe tobacco smoking has risen in recent decades. Controlled studies suggest that waterpipe secondhand smoke (SHS) contains similar or greater quantities of toxicants than cigarette SHS, which causes significant morbidity and mortality. Few studies have examined SHS from waterpipe tobacco in real-world settings. The purpose of this study was to quantify SHS exposure levels and describe the characteristics of waterpipe tobacco venues.
Methods: In 2012–2014, we conducted cross-sectional surveys of 46 waterpipe tobacco venues (9 in Istanbul, 17 in Moscow, and 20 in Cairo). We administered venue questionnaires, conducted venue ob-servations, and sampled indoor air particulate matter (PM2.5) (N¼35), carbon monoxide (CO) (N¼23),
particle-bound polycyclic aromatic hydrocarbons (p-PAHs) (N¼31), 4-methylnitrosamino)-1-(3-pyridyl)-1-butanone (NNK) (N¼43), and air nicotine (N¼46).
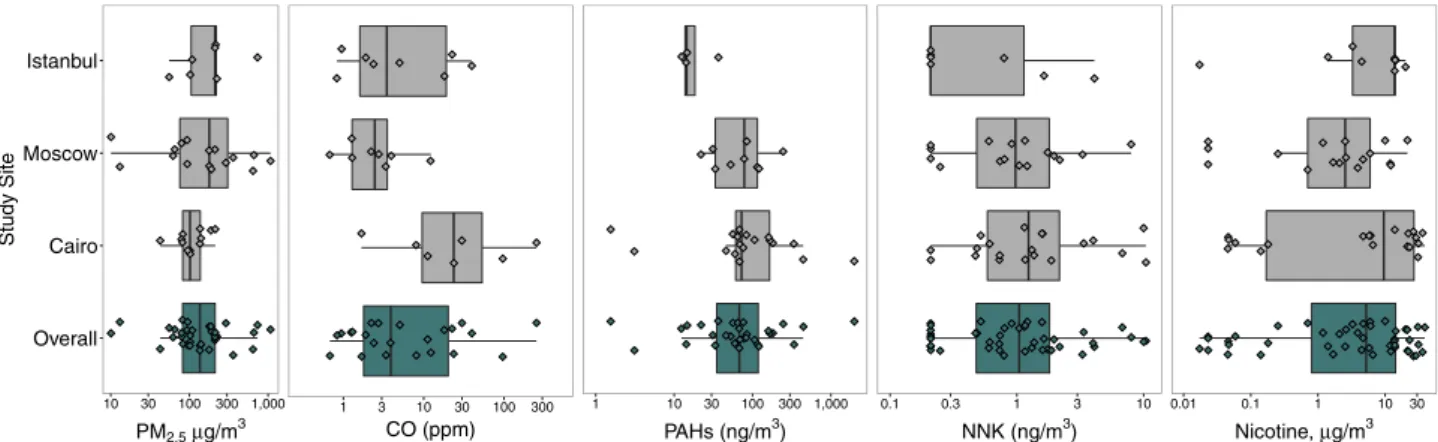
Results: Venue characteristics and SHS concentrations were highly variable within and between cities. Overall, we observed a mean (standard deviation (SD)) of 5 (5) waterpipe smokers and 5 (3) cigarette smokers per venue. The overall median (25th percentile, 75th percentile) of venue mean air con-centrations was 136 (82, 213)mg/m3for PM
2.5, 3.9 (1.7, 22) ppm for CO, 68 (33, 121) ng/m3for p-PAHs, 1.0
(0.5, 1.9) ng/m3for NNK, and 5.3 (0.7, 14)mg/m3for nicotine. PM
2.5, CO, and p-PAHs concentrations were
generally higher in venues with more waterpipe smokers and cigarette smokers, although associations were not statistically significant.
Conclusion: High concentrations of SHS constituents known to cause health effects indicate that indoor air quality in waterpipe tobacco venues may adversely affect the health of employees and customers.
& 2015 Elsevier Inc. All rights reserved.
1. Introduction
Waterpipes (also known as hookah, nargile, calean, goza, or shisha) have been traditionally used to smoke tobacco in the Eastern Mediterranean region and parts of Asia and Africa for
centuries (World Health Organization, 2005). The prevalence of
waterpipe smoking has been rising in recent decades, particularly among youth in Europe, the Middle East, and the United States
(US) (Maziak et al., 2015). This increase in prevalence and
geo-graphic expansion has been related to several factors, including the perception that waterpipe smoking is less harmful than
ci-garettes, the distribution offlavored tobacco products, the social
culture of waterpipes in cafés and restaurants, and aggressive
commercial marketing (Maziak et al., 2015). Despite successful
legislative bans on indoor smoking in many countries, most indoor smoking legislation exempts waterpipe smoking establishments (Jawad et al., 2015).
A complex mixture of exhaled mainstream smoke and
side-stream smoke emitted directly from the burning source (Apelberg
et al., 2013), SHS is well known to cause significant morbidity and Contents lists available atScienceDirect
journal homepage:www.elsevier.com/locate/envres
Environmental Research
http://dx.doi.org/10.1016/j.envres.2015.08.012
0013-9351/& 2015 Elsevier Inc. All rights reserved.
nCorrespondence to: Johns Hopkins Bloomberg School of Public Health.
De-partment of Environmental Health Sciences, Room W7604, 615 N. Wolfe Street, Baltimore, MD 21205, USA.
E-mail address:[email protected](K.A. Moon).
1Currently affiliated with the National Center for Environmental Health,
Agency for Toxic Substances and Disease Registry, Centers for Disease Control and Prevention.
mortality (Centers for Disease Control and Prevention, 2014). SHS
is commonly measured using both tobacco-specific markers (e.g.,
nicotine) and non-specific markers of combustion (e.g., respirable
particulate matter [PM]). Smoking machine studies and controlled human experiments suggest waterpipe SHS contains similar tox-icants compared to cigarettes, may have higher levels of nicotine,
ultrafine PM, carbon monoxide (CO), polycyclic aromatic
hydro-carbons (PAH), volatile aldehydes (e.g., formaldehyde), phenols,
benzene, and metals, and lower levels of tobacco-specific
ni-trosamines (Al Rashidi et al., 2008;Daher et al., 2010; Schubert
et al., 2011, 2014; Sepetdjian et al., 2013, 2008; Shihadeh and Saleh, 2005;Shihadeh et al., 2015). In contrast to cigarettes, wa-terpipe SHS includes combustion products both from the tobacco
and from the burning source (usually charcoal) (Schubert et al.,
2014; World Health Organization, 2005). Other differences in emissions may be related to the lower burning temperature of
waterpipe tobacco (Shihadeh, 2003) or the longer length of an
average waterpipe smoking session, which usually lasts 20–80 min
(World Health Organization, 2005).
Compared to controlled experiments, real-world studies of waterpipe SHS are more likely to capture the expected variability in waterpipe tobacco composition, smoking behaviors, and en-vironmental factors. Recently, several observational studies mea-suring SHS in waterpipe venues have found elevated
concentra-tions of particulate matter with an aerodynamic size of 2.5
μ
m orless (PM2.5),CO, nicotine, and carbon (Al Mulla et al., 2014;Cobb
et al., 2013; Fiala et al., 2012;Hammal et al., 2015;Saade et al., 2010; Zaidi et al., 2011; Zhang et al., 2015; Zhou et al., 2014). However, most existing studies have been conducted with small samples, limited air markers of SHS (i.e., only PM), and relatively short sampling times (less than 2 h). The purpose of this study was to quantify SHS levels and describe the characteristics of water-pipe tobacco venues in Turkey, Russia, and Egypt.
2. Methods
2.1. Venue selection and recruitment
This study was conducted in Istanbul, Turkey, Moscow, Russia, and Cairo, Egypt, major cities in countries with a high prevalence
of waterpipe smoking (Morton et al., 2014). Within each city, we
identified neighborhoods with a high concentration of waterpipe
tobacco venues. Although we initially planned a stratified random
sample, we switched to a convenience sample strategy due to a low venue response rate. Venues were selected in neighborhoods
of low, middle, and high socioeconomic status. The final venue
response rate ranged from 32–34% in each city.
Eligible venues provided oral informed consent and had at least
one non-smoking adult employee (Z18 years of age) willing to
provide hair, saliva, urine, and/or exhaled breath samples. Data collection was conducted between January and May 2013 in Is-tanbul, from December 2013 to May 2014 in Moscow, and
No-vember 2013 to April 2014 in Cairo. Field stafffluent in the local
language conducted all communications with venues and partici-pants in the native language. The Johns Hopkins Bloomberg School of Public Health Institutional Review Board and the ethics com-mittee at each co-investigator's institution approved the study protocol.
2.2. Venue questionnaires and observations
Field staff administered a questionnaire to the owner or man-ager regarding venue characteristics (waterpipe availability, pre-paration practices, customer characteristics and behaviors, and smoking policies) and conducted observations of customer
smoking behaviors during two 15 min periods, 45 min apart dur-ing peak business hours. Other sources of combustion, includdur-ing cooking and burning candles or incense, were documented. 2.3. Indoor air sampling
We measured PM2.5, CO, particle-bound PAHs (p-PAHs),
4-(methylnitrosamino)-1-(3-pyridyl)-1-butanone (NNK, a tobacco specific nitrosamine), and nicotine in indoor air. Trained field staff
placed a backpack containing air-sampling equipment for PM2.5,
CO, and NNK in a convenient, central location of the venue. PM2.5,
NNK, and CO samplers were in place for 24–36 h (the pump for
PM2.5 and NNK automatically turned off after 23 h). Passive air
nicotine monitors were hung for several days in an unobtrusive
central location. P-PAHs were measured for 1–2 h during peak
business hours.
2.3.1. Particulate matter o2.5 micrometers (PM2.5)
We collected real-time and integrated PM2.5 at one-minute
intervals using the 1200 personal DataRAM (pDR) aerosol monitor
(Thermo Scientific, Franklin, MA), a light scattering photometer
with a size-selective cyclone inlet. The pDR was connected to a calibrated air sampling pump (XR5000, SKC Inc., Eighty Four, PA,
USA) running at 4 L/m. Integrated PM2.5was collected on afilter
(Teflo R2PJ037, Pall Corp. NY) that was pre- and post-weighed
using a microbalance (XP6, Mettler, Columbus, OH) according to
standard methods (U.S. Environmental Protection Agency, 2011).
PM2.5concentrations below the limit of detection (LOD) of 5mg/m3
(2%) were replaced with half the LOD.
We collected temperature and percent relative humidity at one-minute intervals using a temperature and relative humidity logger (HOBO U10-003, Onset Computer Corporation, Bourne, MA,
USA). We adjusted continuous PM2.5 measurements when the
relative humidity exceeded 60%, as described previously (
Laulai-nen, 1993; Morabia et al., 2009), to account for bias because of increases in particle size at high humidity. We also applied a
wa-terpipe-specific gravimetric correction factor of 0.60, developed
and applied previously (Torrey et al., 2015), to account for the
differences between waterpipe SHS aerosol compared to the aerosol source used to calibrate the pDR by the manufacturer. 2.3.2. Carbon monoxide (CO)
We measured CO at one-minute intervals using a data-logging EL-USB-CO300 sampler (Lascar Electronics, Erie, PA, USA). Prior to fieldwork, each monitor was challenged with 5, 10, 30, 40, and 50 ppm CO using a 146C Dynamic Gas Calibrator (Thermo En-vironmental Instruments, Franklin, MA) connected to a regulator, tank (Matheson TRI*GAS, Twinsburg, OH, USA), and a zero-air source. Only monitors found to be within 5% of the known
con-centrations were used in the field. CO concentrations below the
LOD of 0.5 ppm (3%) were replaced with half the LOD. 2.3.3. Particle-bound polycyclic aromatic hydrocarbons (p-PAHs)
We measured p-PAHs at one-minute intervals using a Photo-electric Aerosol Sensor (PAS2000, EcoChem Inc., League City, TX, USA), which photoionizes p-PAHs (three or more ringed PAHs) by exposing the aerosol to 220 nm ultraviolet light with a pre-set flow rate of 2 L/m. The PAS2000 was manufacturer-calibrated prior
to use. Lamp intensity, flow rate, data readings, and operations
were checked before sampling. P-PAH concentrations below the
LOD of 1mg/m3
(5%) were replaced with half the LOD. 2.3.4. 4-(Methylnitrosamino)-1-(3-pyridyl)-1-butanone (NNK)
We measured NNK, a nicotine-derived nitrosamine ketone, on
PM2.5filters (Wu et al., 2011). Samples were extracted with
Research Chemicals Inc., Toronto, ON, CA) and then purified with Bond Elut Alumina B solid phase extraction cartridges (500 mg, 3 mL, Agilent, Santa Clara, CA, USA). The solid phase extraction cartridge was preconditioned with 3 mL dichloromethane, loaded with 3 mL extract, washed with 2 mL dichloromethane, and eluted with 3 mL of 8% methanol in dichloromethane (v/v). The eluent was analyzed using gas chromatography and triple quadrupole
mass spectrometry (GC–MS/MS, Thermo Scientific, Waltham, MA,
USA). NNK was separated using a capillary column (TG-5MS,
Thermo Scientific, Waltham, MA, USA). The 23% of NNK values
below the LOD of 0.12 ng/mL (equivalent to 0.42 ng/m3for a 23 h
duration) were replaced with half the sample-specific LOD.
2.3.5. Air nicotine
We measured vapor-phase nicotine using a passive
diffusion-based sampler containing afilter treated with sodium bisulfate
assembled in our laboratory (Jones et al., 2013). Filters were
ex-tracted with an internal standard (isoquinoline, Sigma-Aldrich, St. Louis, MO, USA) and analyzed using a gas chromatograph with a nitrogen phosphorus detector (GC-FTD, Shimadzu GC-2014, Shi-madzu, Columbia, MD, USA). Nicotine was separated using a ca-pillary column (SHRXI-5MS, Shimadzu, Columbia, MD, USA). We
collected 10%field blanks and duplicates. Nicotine concentrations
in duplicate monitors were similar and were averaged together.
The 17% of nicotine values below the LOD of 0.021mg/mL
(equivalent to 0.049mg/m3for a 72 h duration) were replaced with
half the batch-specific LOD.
2.4. Data analysis
Due to logistical difficulties, we were unable to collect 24 h of
continuous PM2.5and CO for all venues. Therefore, we selected up
to four hours of PM2.5and CO data representative of peak
occu-pancy times to coincide with thefield worker observations and
PAHs measurements. The entire sampling duration for p-PAHs was used as collected. For NNK, we used 23 hours (the maximum sampling duration), or the recorded duration of the pDR monitor, whichever was shorter. For nicotine sampling duration, we used
thefieldworker-reported placement and removal times. Indoor air
sampling was conducted during all days of the week, both during the usual working and non-working days in each city. Sampling
durations and days of data collection can be found in
Supple-mental Table S1 and S2.
Active smoking densities were calculated by dividing the number of smokers by the room volume. Chi-square tests of in-dependence and one-way ANOVA were used to assess statistical differences in proportions and means across study cities, respec-tively. The concentrations of all SHS constituents were right-skewed; therefore, we used log-transformed concentrations and the medians or geometric means for statistical analyses. We ex-amined the associations between SHS constituents using
Spear-man rank correlation coefficients of summary statistics within
each venue (e.g., mean, median, maximum). To examine the
as-sociation between nicotine, the most specific marker of tobacco
exposure, with other SHS constituents, we calculated the geo-metric mean ratio (crude and adjusted for study city) of each SHS constituent comparing the 2nd and 3rd nicotine tertile relative to the 1st tertile.
Responses at the two observation periods were similar and were pooled for analyses. To assess the association between SHS concentrations and venue characteristics, we calculated geometric mean ratios using linear regressions of log-transformed SHS con-stituent means on each venue characteristic, adjusted for study city. Continuous variables were categorized into tertiles. Sensitiv-ity analyses of alternative cut-points for continuous variables, and exploratory analyses adjusting for variables related to SHS
intensity or venue characteristics yielded similar results.
Statistical analyses were performed with Stata Version 12.1 (StataCorp, College Station, TX, USA) and R Version 2.5.1 (R
Foundation for Statistical Computing,www.r-project.org, Vienna,
Austria). All statistical tests were two-sided and p-values less than 0.05 were considered statistically significant.
3. Results
3.1. Venue characteristics and observations
We studied 46 waterpipe tobacco venues, including 9 in Is-tanbul, 17 in Moscow, and 20 in Cairo. Venue characteristics, customer demographics, and smoking behaviors differed by city (Table 1). We observed a mean (SD) of 22 (12) customers, 5 (5) waterpipe smokers, 4 (8) active waterpipes, and 5 (3) cigarette smokers per venue. The mean active smoker density (waterpipe and cigarette smokers) was 5 smokers per cubic meter, and ranged
from 1.6 in Moscow to 7.1 in Istanbul and Cairo (Table 1). The
proportions of mechanical ventilation and air conditioning system use were highest in Moscow, lower in Istanbul, and lowest in Cairo
(po0.001)(Table 1). In contrast, the proportion of venues with an
outdoor area was highest in Istanbul and Cairo, compared to
Moscow (po0.001). Enforcement of policies restricting cigarette
smoking inside varied significantly across city (po0.001). The
proportion of venues wherefieldworkers saw or smelled food was
higher in Moscow and Istanbul (po0.001).
3.2. Secondhand smoke constituents
We found considerable variability in SHS constituents means across cities (Fig. 1). Continuous measurements of PM2.5, CO, and
p-PAHs also varied across venues, particularly for CO (
Supple-mental Fig. S1,Tables S1 and S2). Overall, the median (25th per-centile, 75th percentile) of venue mean air concentrations was 136 (82, 213)mg/m3for PM
2.5(N¼35), 3.9 (1.7, 22) ppm for CO (N¼23),
68 (33, 121) ng/m3for p-PAHs (N¼31), 1.0 (0.5, 1.9) ng/m3for NNK
(N¼43), and 5.3 (0.7, 14) mg/m3for nicotine (N
¼46) (Table 2). The
median sampling times were 3.5 h for PM2.5and CO (limited to
peak time), 1.7 h for p-PAHs, 23 h for NNK, and 88 h for nicotine.
We observed moderate and significant correlations between
mean PM2.5and p-PAHs (N¼24, Spearman rho: 0.46, p¼0.02) at
each venue. Mean CO was moderately correlated with both NNK
and PM2.5 (NNK: N¼21, Spearman rho: 0.47, p¼0.03; PM2.5:
N¼16, Spearman rho: 0.47, p¼0.06). Other correlations were less
strong and not statistically significant (data not shown).
None of the city-adjusted associations comparing SHS markers by nicotine tertiles were statistically significant (data not shown); however, there was a suggestion of higher levels with increasing nicotine tertiles for CO, p-PAHs, and NNK.
3.3. Associations of secondhand smoke constituents with venue characteristics
We observed moderate and significant correlations between
the mean CO and the number of waterpipe smokers (N¼19,
Spearman rho: 0.49, p¼0.03), number of waterpipes (N¼19,
Spearman rho: 0.53, p¼0.02), and waterpipe smoking density
(N¼19, Spearman rho: 0.46, p¼0.048) (data not shown). However,
mean CO was not significantly correlated with the number of
ci-garette smokers (N¼19, Spearman rho: 0.27, p¼0.3) or active
ci-garette smoker density (N¼19, Spearman rho: 0.21, p¼0.4).
Geometric mean levels of PM2.5, CO, and p-PAHs were generally
higher in venues with a higher number of waterpipe smokers, number of waterpipes in use, and number of cigarette smokers,
Table 1
Characteristics of waterpipe tobacco venues in Istanbul, Moscow, and Cairo in 2013–2014.
Istanbul (N¼9)a Moscow (N¼17)a Cairo (N¼20)a p-Valueb Venue characteristics
Volume, m3(mean7SD) 3777315
5007316 301 (319) 0.18
Maximum occupancy, persons (mean7SD) 2537189 108758 66744 o0.001* Ventilation systemc
(n, % yes) 5 (56%) 16 (94%) 3 (15%) o0.001*
Air conditioningc(n, % yes) 3 (33%) 16 (94%) 1 (5%) o0.001*
Outdoor area (n, % yes) 8 (89%) 3 (18%) 17 (85%) o0.001*
Serves food with full kitchen (n, % yes) 8 (89%) 17 (100%) 1 (5%) o0.001*
Has oven/stove (n, % yes) 8 (89%) 14 (82%) 5 (25%) o0.001*
Z25% of business from waterpipe (n, % yes) 7 (78%) 0 (0%) 13 (65%) o0.001*
Cigarette indoor smoking policy (n, % yes)d o0.001*
No policy 0 (0%) 13 (77%) 19 (95%)
Smoking allowed in some indoor areas 3 (33%) 4 (24%) 1 (5%) Smoking not allowed indoors, but not enforced 2 (22%) 0 (0%) 0 (0%) Smoking not allowed indoors, and enforced 4 (44%) 0 (0%) 0 (0%) Venue observations
Number of people (mean7SD) 19711 22713 23711 0.75
Number of waterpipe smokers (mean7SD) 576 272 775 0.011*
Active waterpipe density, smokers/m3(mean7SD) 3.676.8 0.770.7 3.672.9
0.045*
Number of waterpipes (mean7SD) 474 171 7710 0.10
Number of cigarette smokers (mean, SD) 575 472 672 0.032*
Active cigarette density, smokers/m3
(mean7SD) 4.278.7 1.170.6 3.472.1 0.07
Active total smoker density, smokers/m3(mean7SD) 7.1714.8 1.671.5 7.174.3
0.034* Cooking (see or smell food) (n, % yes) 3 (43%) 16 (94%) 0 (0%) o0.001*
Other burning (n, % yes) 2 (29%) 9 (53%) 12 (63%) 0.292
Candles 0 (0%) 8 (89%) 0 (0%) o0.001*
Fireplace 0 (0%) 0 (0%) 12 (100%)
Othere
2 (100%) 1 (11%) 0 (0%)
Customer characteristics
Average number of customers per day (mean7SD)f 2347164
1097105 88746 0.004*
Average customer age (n, % yes)
18–24 years 3 (33%) 4 (24%) 1 (5%) 0.13
Z25 years 4 (44%) 10 (59%) 9 (45%)
All ages 2 (22%) 3 (18%) 10 (50%)
Average customer educationrhigh school (n, % yes) 5 (56%) 5 (33%) 14 (70%) 0.07 Z25% of customers smoke waterpipe (n, % yes) 4 (44%) 3 (18%) 13 (65%) 0.015*
*SD, standard deviation. Statistically significant associations indicated by an asterisk.
aAll mean (standard deviations) and n (%) are calculated on a sample excluding venues missing responses. For N (%), the sample size for each venue characteristic can be
calculated by the given statistics. For continuous variables, shown as mean (standard deviation), all statistics were calculated with complete samples except for the following with missing data: Room volume (N¼19, Cairo), Maximum occupancy (N¼15, Moscow; N¼19, Cairo), Number of people (N¼6, Istanbul; N¼19, Cairo), Number of waterpipe smokers (N¼7, Istanbul; N¼14, Moscow), Waterpipe density (N¼7, Istanbul; N¼14, Moscow; N¼19, Cairo), Number of waterpipes (N¼7, Istanbul; N¼14, Moscow), Number of cigarette smokers (N¼6, Istanbul), Cigarette density (N¼6, Istanbul; N¼19, Cairo), Average number of customers per day (N¼16, Moscow; N¼18, Cairo).
b
p-Values are chi-square test of independence for proportions and one-way ANOVA differences in group means for continuous variables.
c
Ventilation and air-conditioning both available and in use during business hours.
dTurkey was the only country with indoor smoke-free legislation during the study period. Legislation banning smoking in indoor public places passed in 2009, did not
extend to water pipe cafes until January 2013, and was not enforced until after the data collection was completed.
e
Other burning was identified as a “gas burning oven/heater” and “tea kettle, double broiler” in venues in Istanbul. The source of burning was missing for the venue in Moscow.
f
Weighted average of the number of customers on weekdays and weekends.
Fig. 1. Median (interquartile range) of the venue means of indoor air secondhand smoke constituents in waterpipe tobacco venues in Istanbul, Moscow, and Cairo in 2013– 2014. For continuously measured SHS constituents (PM2.5, CO, and PAHs), each diamond is the mean within each venue. For SHS constituents with a single measurement per
venue (NNK and nicotine), each diamond is the time-weighted average concentrations for each venue. Boxplots represent the overall median and interquartile range of the venue-specific means for PM2.5, CO, and PAHs, and the median and interquartile range of the time-weighted average values of NNK and nicotine.
after adjusting for city, although these associations were not sta-tistically significant (Table 3). After adjusting for city, venues with ventilation systems, air conditioning, or an outdoor area had
generally lower geometric mean PM2.5 and CO concentrations
compared to venues that did not (Table 3). Geometric means of
p-PAHs were lower in venues with air conditioning or outdoor areas, and geometric means of NNK were lower in venues with a
ventilation system or air conditioning. Venues wherefieldworkers
reported seeing or smelling food or cooking had 4.53 (95% CI:
1.32–15.59) times higher geometric mean PM2.5 concentrations
Table 2
Median (interquartile range) of venue mean indoor air secondhand smoke constituent concentrations in waterpipe tobacco venues in Istanbul, Moscow, and Cairo in 2013– 2014, overall and by citya
. PM2.5(lg/m3) CO (ppm) p-PAHs (ng/m3) NNK (ng/m3) Nicotine (lg/m3) Overall (N¼46) 136 (82, 213) 3.9 (1.7, 22) 68 (33, 121) 1.0 (0.5, 1.9) 5.3 (0.7, 14) Istanbul (N¼9) 212 (102, 224) 3.7 (1.4, 20 14 (13, 36) 0.21 (0.21, 1.6) 14 (3.3, 14) Moscow (N¼17) 179 (72, 325) 2.5 (1.3, 3.6) 78 (33, 115) 0.98 (0.42, 1.9) 2.5 (0.7, 6) Cairo (N¼20) 102 (82, 138) 24 (8.1, 96) 73 (60, 167) 1.2 (0.56, 2.6) 10 (0.16, 28) N, Number of venues; SHS, Secondhand smoke; PM2.5,Particulate matter with an aerodynamic size of 2.5μm or less; CO, Carbon monoxide; p-PAHs, Particle-bound
polycyclic aromatic hydrocarbons; NNK, 4-(methylnitrosamino)-1-(3-pyridyl)-1-butanone
a
Sample sizes for each secondhand smoke constituent mean and standard deviation vary by constituent. For continuously measured markers (PM2.5, CO, and p-PAHs),
we report overall median (interquartile range) of the venue-specific means. For NNK and nicotine, we report overall median (interquartile range) of the venue-specific time-weighted averages.
Table 3
Ratio of geometric means of indoor air secondhand smoke constituents by venue characteristics in waterpipe tobacco venues in Istanbul, Moscow, and Cairo in 2013–2014, adjusted by city.
Geometric mean ratio (95% Confidence Interval) of SHS constituents, adjusted by city
N PM2.5(lg/m3) N CO (ppm) N p-PAHs (ng/m3) N NNK (ng/m3) N Nicotine (lg/m3)
Ventilation system
No 15 1.00 (Ref) 9 1.00 (Ref) 16 1.00 (Ref) 21 1.00 (Ref) 22 1.00 (Ref) Yes 20 0.39 (0.15, 1.06) 14 0.80 (0.22, 2.89) 15 5.62 (0.86, 36.79) 22 0.90 (0.34, 2.38) 24 1.70 (0.23, 12.70) Air conditioning
No 17 1.00 (Ref) 12 1.00 (Ref) 20 1.00 (Ref) 25 1.00 (Ref) 26 1.00 (Ref) Yes 18 0.67 (0.23, 1.98) 11 0.93 (0.22, 3.96) 11 0.72 (0.15, 3.47) 18 0.63 (0.19, 2.13) 20 5.28 (0.48, 57.77) Outdoor area
No 17 1.00 (Ref) 9 1.00 (Ref) 11 1.00 (Ref) 17 1.00 (Ref) 18 1.00 (Ref) Yes 18 0.64 (0.28, 1.46) 14 0.75 (0.14, 4.10) 20 0.41 (0.06, 2.93) 26 1.49 (0.60, 3.70) 28 2.65 (0.37, 18.86) See or smell food or cooking?
No 15 1.00 (Ref) 10 1.00 (Ref) 20 1.00 (Ref) 22 1.00 (Ref) 24 1.00 (Ref) Yes 17 4.53 (1.32, 15.59)*
11 2.11 (0.26, 17.38) 10 2.66 (0.12, 58.80) 18 0.72 (0.09, 5.53) 19 0.16 (0.01, 3.14) Number of waterpipe smokers
Tertile 1 (0–2.5) 12 1.00 (Ref) 10 1.00 (Ref) 9 1.00 (Ref) 13 1.00 (Ref) 14 1.00 (Ref) Tertile 2 (3–5.5) 12 1.18 (0.38, 3.67) 6 1.42 (0.28, 7.32) 10 1.02 (0.07, 14.2) 13 1.04 (0.27, 4.10) 14 0.43 (0.03, 5.24) Tertile 3 (6–25.5) 6 1.63 (0.45, 5.84) 5 5.07 (0.67, 38.69) 10 2.96 (0.21, 40.99) 12 1.10 (0.27, 4.50) 13 1.28 (0.09, 17.86) Number of waterpipes
Tertile 1 (0–1.5) 13 1.00 (Ref) 10 1.00 (Ref) 8 1.00 (Ref) 13 1.00 (Ref) 15 1.00 (Ref) Tertile 2 (2–3) 9 2.61 (0.58, 11.82) 6 1.15 (0.11, 12.21) 11 1.21 (0.06, 26.22) 13 0.79 (0.14, 4.33) 13 0.44 (0.02, 10.89) Tertile 3 (3.5–47.5) 8 3.57 (0.62, 20.69) 5 1.52 (0.11, 21.69) 10 2.72 (0.12, 63.19) 12 0.68 (0.10, 4.05) 13 0.31 (0.01, 10.40) Waterpipe smoker density (smokers/m3
)
Tertile 1 (0–0.7) 12 1.00 (Ref) 10 1.00 (Ref) 10 1.00 (Ref) 13 1.00 (Ref) 14 1.00 (Ref) Tertile 2 (0.7–2.4) 7 0.74 (0.26, 2.16) 7 2.39 (0.63, 9.02) 7 0.22 (0.04, 1.22) 12 0.80 (0.29, 2.21) 13 0.24 (0.03, 1.93) Tertile 3 (2.4–18.6) 10 0.82 (0.17, 3.88) 4 0.85 (0.15, 4.92) 11 0.77 (0.14, 4.13) 12 0.49 (0.14, 1.66) 13 0.28 (0.02, 3.26) Number of cigarette smokers
Tertile 1 (0–3.5) 16 1.00 (Ref) 10 1.00 (Ref) 14 1.00 (Ref) 17 1.00 (Ref) 19 1.00 (Ref) Tertile 2 (4.5–5.5) 19 1.82 (0.79, 4.18) 4 1.60 (0.32, 7.94) 10 0.49 (0.15, 1.60) 12 0.65 (0.26, 1.63) 12 0.88 (0.12, 6.60) Tertile 3 (6–13.5) 7 2.48 (1.00, 6.11) 6 1.46 (0.34, 6.25) 6 2.63 (0.61, 11.24) 11 0.95 (0.36, 2.48) 12 0.68 (0.09, 5.28) Cigarette smoker density (smokers/m3
)
Tertile 1 (0–0.7) 11 1.00 (Ref) 8 1.00 (Ref) 10 1.00 (Ref) 13 1.00 (Ref) 14 1.00 (Ref) Tertile 2 (1.0-2.7) 10 1.07 (0.42, 2.69) 7 0.38 (0.10, 1.38) 8 0.50 (0.12, 2.20) 13 0.59 (0.24, 1.45) 14 0.89 (0.12, 6.43) Tertile 3 (2.9–21.8) 10 2.40 (0.57, 10.22) 5 1.01 (0.24, 4.26) 11 2.54 (0.44, 14.77) 13 0.46 (0.15, 1.42) 14 1.61 (0.15, 16.93) Number of total smokers
Tertile 1 (0–6) 13 1.00 (Ref) 9 1.00 (Ref) 10 1.00 (Ref) 14 1.00 (Ref) 15 1.00 (Ref) Tertile 2 (6.5–10.5) 12 1.85 (0.76, 4.54) 8 0.86 (0.20, 3.70) 11 1.17 (0.18, 7.72) 14 1.50 (0.49, 4.61) 15 0.65 (0.07, 6.16) Tertile 3 (11–31.5) 8 2.81 (0.93, 8.47) 4 3.29 (0.47, 23.19) 10 3.08 (0.40, 23.67) 13 1.12 (0.32, 4.00) 14 0.99 (0.08, 12.67) Total smoker density (smokers/m3)
Tertile 1 (0–1.44) 13 1.00 (Ref) 9 1.00 (Ref) 12 1.00 (Ref) 15 1.00 (Ref) 14 1.00 (Ref) Tertile 2 (1.57–4.95) 9 0.86 (0.34, 2.18) 7 1.89 (0.50, 7.19) 6 0.28 (0.06, 1.25) 14 1.01 (0.40, 2.54) 13 0.38 (0.05, 2.65) Tertile 3 (5.35–40.4) 10 1.26 (0.12, 12.98) 5 0.55 (0.10, 3.11) 12 1.90 (0.34, 10.59) 14 0.49 (0.13, 1.88) 13 0.59 (0.04, 8.31) N, number of venues; SHS, Secondhand smoke; PM2.5, Particulate matter with an aerodynamic size of 2.5μm or less; CO, Carbon monoxide; p-PAHs, Particle-bound polycyclic
aromatic hydrocarbons; NNK, 4-(methylnitrosamino)-1-(3-pyridyl)-1-butanone.
and non-significant increases in mean CO and p-PAHs
concentra-tions, compared to venues without food or cooking (Table 3).
4. Discussion
In this study of 46 waterpipe tobacco venues in Istanbul,
Moscow, and Cairo, we found high concentrations of PM2.5, CO,
p-PAHs, NNK, and nicotine, indicating the presence of high SHS concentrations that could affect the health of venue employees and customers. Other studies have found that waterpipe tobacco venues have similar or higher levels of SHS compared to cigarette-only venues (Cobb et al., 2013;Hammal et al., 2015;Saade et al., 2010;Zaidi et al., 2011). We observed considerable variability in venue characteristics and smoking behaviors between countries,
likely reflecting heterogeneity in the cultural, economic, and
to-bacco regulatory environments in each city. We did not identify
many significant associations between venue characteristics and
SHS levels. Other studies of SHS in waterpipe tobacco venues have reported positive associations between smoker density and mean PM2.5 (Abuelaish et al., 2013; Al Mulla et al., 2014; Cobb et al.,
2013;Saade et al., 2010;Zaidi et al., 2011;Zhang et al., 2015).
In this study, the mean PM2.5concentrations in almost all
ve-nues were above both the US Environmental Protection Agency
(EPA) 24 h ambient air standard (35mg/m3) and the World Health
Organization 24 h indoor air standard (25mg/m3) (U.S.
Environ-mental Protection Agency, 2013; World Health Organization,
2014). Other studies of waterpipe tobacco venues in the US (Cobb
et al., 2013;Fiala et al., 2012;Zhang et al., 2015;Zhou et al., 2014), Qatar (Al Mulla et al., 2014), Lebanon (Saade et al., 2010), Pakistan (Zaidi et al., 2011), and Palestine (Abuelaish et al., 2013) have all
found elevated PM2.5 concentrations, with mean concentrations
ranging from 117mg/m3to 1419mg/m3.
The concentrations of CO in this study are consistent with
previous evidence that waterpipe SHS produces a significant
quantity of CO. The overall median CO concentrations in this study were similar to three studies with real-time CO measurements in
waterpipe tobacco venues in Canada and New York City (Hammal
et al., 2015;Zhang et al., 2015;Zhou et al., 2014). Nine (39%) venue means for CO exceeded the EPA 8 h standard (9 ppm) and three (13%) venue means exceeded the EPA 1 h standard (35 ppm).
This is thefirst study of total p-PAHs, which are carcinogenic
(International Agency for Research on Cancer, 2004) and
asso-ciated with respiratory and cardiovascular disease (Centers for
Disease Control and Prevention, 2014), in SHS from waterpipe
tobacco venues. We observed a median of 50 ng/m3 p-PAHs
overall, with the highest concentrations in Cairo and lowest con-centrations in Istanbul.
No previous studies have examined concentrations of NNK in waterpipe tobacco venues, and few real-world studies have
mea-sured NNK exposure levels from cigarette SHS (Apelberg et al.,
2013;Brunnemann et al., 1992). Our study shows that workers and
customers are exposed to this carcinogen (Hecht, 2014) in
water-pipe tobacco venues. There is some evidence that NNK may be lower in mainstream waterpipe tobacco smoke compared to ci-garettes, potentially due to non-tobacco additives common in waterpipe tobacco (Schubert et al., 2011).
Air nicotine concentrations in our study were similar to
pre-vious studies, which found a mean of 3.3mg/m3in Toronto, Canada
waterpipe cafes and 4.2mg/m3in New York City waterpipe cafes
(Zhang et al., 2015; Zhou et al., 2014). These concentrations are also comparable to an international study of bars and nightclubs (median of 3.5mg/m3) (Jones et al., 2013).
This study had several strengths. Our multi-city study is one of the largest samples of waterpipe tobacco venues with SHS mea-surements. We have collected the most comprehensive set of SHS
markers in an observational study of real venues where SHS
ex-posure is occurring. We are thefirst to measure concentrations of
the carcinogens NNK and p-PAHs in waterpipe venues and we had longer SHS sampling durations compared to previous studies. Previous studies were conducted without permission from the venues, which can avoid disruption of normal activities but is of-ten at the expense of exof-tensive data collection from venues.
This study also had some limitations. The generalizability of the findings might be limited due to low participation rates and the convenience sampling strategy. Relatively modest to low partici-pation is not uncommon in similar studies with detailed data collection in tobacco venues (Navas-Acien et al., 2004). Particularly in Turkey, where cigarette smoking was banned in 2009 in many public places and extended to include waterpipe venues in early
2013 (Jawad et al., 2015), fear of regulation may have hampered
recruitment of venues. Assuming that venues with higher SHS exposure would be less likely to participate, the results of this study are likely conservatively biased. Waterpipe tobacco venues and customer smoking behaviors, including the style of waterpipe apparatus, tobacco additives, charcoal source, and typical puff to-pography of the smoker may vary across venues, cities, or within countries. Although no available markers can distinguish sources of SHS, patrons and employees of waterpipe tobacco venues are exposed to a mixture of SHS from cigarettes and waterpipe in the
real world. We used a waterpipe-specific correction factor for
continuous PM measurements using a pDR, which is less con-servative than cigarette SHS correction factors in the literature (Cobb et al., 2013; Travers et al., 2012). Isolating the source of p-PAHs exposure remains a challenge because they can also come from many non-cigarette sources, including automobile exhaust,
cooking, candles, and incense (Apelberg et al., 2013). We had
limited ability to assess the presence or absence of alternative burning sources. We may not have accurately captured venues during their peak business hours or our convenience sample may have preferentially selected smaller, less busy venues. Venue characteristics or smoking behaviors may have varied over the different climates and seasons of data collection.
This study's comprehensive indoor air sampling and data on venue characteristics adds to the growing body of evidence re-porting that SHS emissions in waterpipe venues are a potential threat to the health of employees and patrons. Our study expands
on previous researchfindings that SHS concentrations are similar
to or greater than those typically found in cigarette venues by measuring SHS in indoor air in real-world conditions. Of particular concern are the relatively high levels of CO measured in several of
the venues. Our findings support that smoke-free legislation in
public places should also ban waterpipe smoking. In addition to incorporating a wider range of markers of SHS exposure, including CO, PAHs, and NNK, future studies should collect measurements of air markers, smoking behaviors, and venue observations at mul-tiple time points in order to understand the temporal and spatial heterogeneity of SHS within venues.
Funding sources
This study was supported by the Institute for Global Tobacco Control at the Johns Hopkins Bloomberg School of Public Health (#119187) with funding from the Bloomberg Initiative to Reduce Tobacco Use. K. Moon was also supported by the National Heart Lung and Blood Institute (5T32HL007024).
Acknowledgments
Bugrahan Cizenmih, Serdar Doruk Avunduk, Deniz Ever, Merve Kayserili, Pelinsu Çagla Batur, Tufan Ayrık, Ortaç Ikizler, Didem Ungor, Gizem Kural, Evren Ceylan Morgul in Istanbul; Bogdan Ladan, Nina Slepchenko, Anna Zavelskay in Moscow; and Basem and Baher Hi-gazy in Cairo.
Appendix A. Supplementary material
Supplementary data associated with this article can be found in the online version athttp://dx.doi.org/10.1016/j.envres.2015.08.012.
References
Abuelaish, I., et al., 2013. Second-hand smoke and indoor air quality in public places in Gaza city. East Mediterr. Health J. 19, 447–451.
Al Mulla, A., et al., 2014. Secondhand smoke emission levels in waterpipe cafes in Doha. Qatar. Tob. Control. http://dx.doi.org/10.1136/tobaccocontrol-2014-051717, Published Online First: 28-09-14.
Al Rashidi, M., et al., 2008. Volatile aldehydes in the mainstream smoke of the narghile waterpipe. Food Chem. Toxicol. 46, 3546–3549.
Apelberg, B.J., et al., 2013. Environmental monitoring of secondhand smoke ex-posure. Tob. Control. 22, 147–155.
Brunnemann, K.D., et al., 1992. Analysis of tobacco-specific N-nitrosamines in in-door air. Carcinogenesis 13, 2415–2418.
Centers for Disease Control and Prevention, 2014. The Health Consequences of Smoking-50 Years of Progress: A Report of the Surgeon General. U.S. Depart-ment of Health and Human Services, Atlanta, GA, Retrieved from:http://www. surgeongeneral.gov/library/reports/50-years-of-progress/.
Cobb, C.O., et al., 2013. Indoor air quality in Virginia waterpipe cafes. Tob. Control 22, 338–343.
Daher, N., et al., 2010. Comparison of carcinogen, carbon monoxide, and ultrafine particle emissions from narghile waterpipe and cigarette smoking: sidestream smoke measurements and assessment of second-hand smoke emission factors. Atmos. Environ. 44, 8–14.
Fiala, S.C., et al., 2012. Measuring indoor air quality of hookah lounges. Am. J. Public Health 102, 2043–2045.
Hammal, F., et al., 2015.‘Herbal’ but potentially hazardous: an analysis of the constituents and smoke emissions of tobacco-free waterpipe products and the air quality in the cafes where they are served. Tob. Control 24, 290–297.
Hecht, S.S., 2014. It is time to regulate carcinogenic tobacco-specific nitrosamines in cigarette tobacco. Cancer Prev. Res. (Phila) 7, 639–647.
International Agency for Research on Cancer, 2004. IARC Monographs on the eva-luation of carcinogenic risks to humans. Vol. 83. Tobacco Smoke and Involuntary Smoking. International Agency for Research on Cancer, Lyon, France, Retrieved from:http://monographs.iarc.fr/ENG/Monographs/vol83/ mono83.pdf.
Jawad, M., et al., 2015. Waterpipe tobacco smoking legislation and policy enact-ment: a global analysis. Tob. Control. 24 (Suppl 1), i60–i65.
Jones, M.R., et al., 2013. Secondhand tobacco smoke: an occupational hazard for smoking and non-smoking bar and nightclub employees. Tob. Control. 22, 308–314.
Laulainen, N.S., Summary of conclusions and recommendations from a visibility science workshop. 1993. Retrieved from:〈http://www.osti.gov/scitech//serv lets/purl/10149541-uEhPL2/〉.
Maziak, W., et al., 2015. The global epidemiology of waterpipe smoking. Tob. Control. 24 (Suppl 1), i3–i12.
Morabia, A., et al., 2009. Air pollution and activity during transportation by car, subway, and walking. Am. J. Prev. Med. 37, 72–77.
Morton, J., et al., 2014. Cross-country comparison of waterpipe use: nationally re-presentative data from 13 low and middle-income countries from the Global Adult Tobacco Survey (GATS). Tob. Control 23, 419–427.
Navas-Acien, A., et al., 2004. Secondhand tobacco smoke in public places in Latin America, 2002–2003. Jama 291, 2741–2745.
Saade, G., et al., 2010. Indoor secondhand tobacco smoke emission levels in six Lebanese cities. Tob. control 19, 138–142.
Schubert, J., et al., 2011. Mainstream smoke of the waterpipe: does this environ-mental matrix reveal as significant source of toxic compounds? Toxicol. Lett. 205, 279–284.
Schubert, J., et al., 2014. Waterpipe smoke: source of toxic and carcinogenic VOCs, phenols and heavy metals? Arch. Toxicol. http://dx.doi.org/10.1007/s00204-014-1372-x, Published Online First: 24-09-14
Sepetdjian, E., et al., 2013. Phenolic compounds in particles of mainstream water-pipe smoke. Nicot. Tob. Res. 15, 1107–1112.
Sepetdjian, E., et al., 2008. Measurement of 16 polycyclic aromatic hydrocarbons in narghile waterpipe tobacco smoke. Food Chem. Toxicol. 46, 1582–1590.
Shihadeh, A., 2003. Investigation of mainstream smoke aerosol of the argileh water pipe. Food Chem. Toxicol. 41, 143–152.
Shihadeh, A., Saleh, R., 2005. Polycyclic aromatic hydrocarbons, carbon monoxide, “tar”, and nicotine in the mainstream smoke aerosol of the narghile water pipe. Food Chem. Toxicol. 43, 655–661.
Shihadeh, A., et al., 2015. Toxicant content, physical properties and biological ac-tivity of waterpipe tobacco smoke and its tobacco-free alternatives. Tob. Con-trol. 24 (Suppl 1), i22–i30.
Torrey, C.M., et al., 2015. Waterpipe cafes in Baltimore, Maryland: carbon monoxide, particulate matter, and nicotine exposure. J. Expos. Sci. Environ. Epidemiol. 25, 405–410.
Travers, M.J., et al., 2012. Measuring exposure to waterpipe tobacco smoke: a wa-terpipe-specific calibration factor for the sidepak aerosol monitor. 15th World Conference on Tobacco or Health, Singapore.
U.S. Environmental Protection Agency, Reference Method for theDetermination of Fine Particulate Matter as PM2.5 in the Atmosphere, 40 CFR Part 50, Appendix L to Part 50. , 2011, Federal Register, United States Retrieved from:http://www. gpo.gov/fdsys/pkg/CFR-2011-title40-vol2/xml/CFR-2011-title40-vol2-part50-appL.xml.
U.S. Environmental Protection Agency, 2013. National Ambient Air Quality Stan-dards for Particulate Matter;final rule. 40 CFR Parts 50, 51, 52, 53 and 58. Federal Register, 3086–3287.
World Health Organization, 2005. Advisory Note: Waterpipe Tobacco Smoking: Health Effects. World Health Organization, Geneva, Switzerland, Retrieved from:〈http://www.who.int/tobacco/global_interaction/tobreg/waterpipe/en/〉. World Health Organization, 2014. Ambient (outdoor) air pollution in cities database
2014. World Health Organization, Retrieved from:〈http://www.who.int/phe/ health_topics/outdoorair/databases/cities/en/〉.
Wu, D., et al., 2011. Analysis of Carcinogenic Tobacco-Specific Nitrosamines in Mainstream Cigarette Smoke Using an Agilent J&W DB-35ms Ultra Inert GC Column. Agilent Technologies, Inc, Retrieved from:〈http://www.chem.agilent. com/Library/applications/5990–8894EN.pdf〉.
Zaidi, S., et al., 2011. Second-hand smoke in indoor hospitality venues in Pakistan. Int. J. Tuberc. Lung Dis. 15, 972–977.
Zhang, B., et al., 2015.‘Enter at your own risk’: a multimethod study of air quality and biological measures in Canadian waterpipe cafes. Tob. control 24, 175–181. Zhou, S., et al., 2014. Air quality in New York City hookah bars. Tob. Control. http://dx.