http://journals.tubitak.gov.tr/medical/ © TÜBİTAK
doi:10.3906/sag-1511-95
Importance of sonographic paratracheal lymph node evaluation
in early autoimmune thyroiditis
Tuğrul ÖRMECİ1,*, Mukaddes ÇOLAKOĞULLARI2, İsrafil ORHAN3, Bayram Ufuk ŞAKUL4 1Department of Radiology, Faculty of Medicine, Medipol University, İstanbul, Turkey 2Department of Medical Biochemistry, Faculty of Medicine, Medipol University, İstanbul, Turkey 3Department of Otorhinolaryngology, Faculty of Medicine, Sütçü İmam University, Kahramanmaraş, Turkey
4Department of Anatomy, Faculty of Medicine, Medipol University, İstanbul, Turkey
1. Introduction
The thyroid gland drains primarily into the level 6 central neck nodes including the prelaryngeal, pretracheal, and paratracheal lymph node groups (1–3). This group is the principal site of metastases originating from cancers of the thyroid gland, the glottis and subglottic larynx, the apex of the piriform sinus, and the cervical esophagus (4). Neck lymph nodes also develop in cases of chronic autoimmune thyroiditis (5).
In most clinics, autoimmune thyroiditis diagnosis is based principally on clinical findings and laboratory test data such as elevated levels of thyroid peroxidase antibody (TPO Ab) and thyroglobulin antibody (Tg Ab). However, antithyroid antibody levels are sometimes within normal ranges in histologically proven cases (6). Thus, the use of both ultrasonography (US) and laboratory test data increases the sensitivity and specificity of autoimmune thyroiditis diagnosis (7,8). US is routinely used in autoimmune thyroiditis diagnosis, the sonographic properties of which
are clearly defined (9,10). Lymphocytic infiltration of the thyroid is the basis of the sonographic features (11). This infiltration determines histopathological changes in the glands. Although sonographic characteristics are probably in accordance with disease severity and progress (12), in the literature there is no clear statement about the earlier sonographic features of the disease.
There are only a few published studies on US findings at different stages of autoimmune thyroiditis and their relationships with paratracheal lymph nodes (10,13). None of these studies include transient cases that might have had early-stage autoimmune thyroiditis.
Including the early stages of the disease, in which the laboratory results are not useful, using US to diagnose autoimmune thyroiditis during various stages of the disease will be very helpful. Our objective in this study is to review the sonographic views of paratracheal lymph nodes (PLNs) in the diagnosis and during different stages of autoimmune thyroiditis.
Background/aim: To review the sonographic views of paratracheal lymph nodes (PLNs) in the diagnosis and during different stages of
autoimmune thyroiditis.
Materials and methods: Features of the PLNs (left and right), thyroid sonography, and laboratory data were investigated in 126 cases.
Patients were divided into three groups by using thyroid sonographic criteria in the literature (group 1: control, group 2: early-stage/ indeterminate, group 3: definite thyroiditis). Indeterminate patients were followed up for 1 year and included as indeterminate/early-stage thyroiditis patients.
Results: Percentage of right and left PLN was 13.3% and 46.2% in control cases, 21.2% and 80% in early-stage/indeterminate cases, and
41.3% and 88.5% in definite thyroiditis cases. Significant among-group differences were evident in terms of right and left PLNs presence (Pearson chi-squared test, P = 0.011 and P = 0.001).
Conclusion: Careful and thorough review of the PLNs can ensure diagnosis of autoimmune thyroiditis even in cases of early stage of the
disease and prevent false-negative diagnoses.
Key words: Autoimmune thyroiditis, paratracheal lymph nodes, thyroid, ultrasound
Received: 17.11.2015 Accepted/Published Online: 30.03.2016 Final Version: 20.12.2016 Research Article
2. Materials and methods 2.1. The study groups
The University Ethical Committee approved the study. We evaluated 126 patients (90 females and 36 males) treated between June 2012 and February 2014. Pregnant patients, pediatric patients, patients with surgical or known malignancies, those with bacterial or viral infections, and those with goiter or nodules and also postpartum or subacute thyroiditis were excluded.
After their physical examination, we measured the levels of free triiodothyronine (fT3), free thyroxine (fT4), thyroid-stimulating hormone (TSH), TPO Ab, and Tg Ab. Electrochemiluminescent immunoassay (ECLIA) kits were used to measure TSH, fT3, fT4, Tg Ab, and TPO Ab levels.
2.2. Sonographic evaluation of thyroid gland and paratracheal lymph nodes
A single radiologist blinded to the data obtained US profiles. A Doppler device (LOGIQ P6 Pro, GE Healthcare GmbH, Germany) fitted with a linear 11 MHz probe was used. Ultrasonography was performed in a supine position with neck hyperextension as standard in all patients. Normal thyroid parenchyma has a homogeneous medium–high level of echogenicity compared to periglandular muscles.
Many studies in the literature defined sonographic images of autoimmune thyroiditis during different stages of the disease (7–12,14–17,18–23). Autoimmune thyroiditis is characterized by diffuse reduction of echogenicity, diffuse tissue enlargement, parenchymal hypoechogenicity and coarsening (7–9,11,15–17), a diffuse micronodular pattern, and echogenic interlobular septation of the heterogeneous hypoechoic parenchyma (8,11,15–17). These properties are evaluated in routine clinical practice; they differ somewhat at different stages of autoimmune thyroiditis. As the disease advances, the septa increase in extent and become more echogenic, parenchymal heterogeneity increases, and contour lobulation deepens,
while gland shrinkage is also observed. These findings are described as pseudonodulation (9,15,17,19). In addition, the extent of gland perfusion rises from mild to advanced (8,14–17,21).
Kim et al. evaluated thyroid conditions such as Hashimoto’s thyroiditis using echogenicity, echo texture, dimensions, and contour properties of the gland (22). Willms et al. developed a system called VESINC (volume, echogenicity, sonographic texture, pseudonodular hypoechoic infiltration, nodule presence, and cyst presence) to classify different sonographic properties of the gland (9). When nodule and cyst presence parameters were excluded, the remaining sonographic criteria were the same as the ones we used in our study. However, we did not include cases with nodules in our study since we did not make a histopathological evaluation of the patients.
All those sonographic criteria defined in the literature for Hashimoto’s thyroiditis make up the foundation of our study. Moreover, we used studies done by Kim et al. and Willms et al. for defining the sonographic criteria to group our cases in order to clarify the histopathological progression of the disease and its sonographic consequences (9,22).
Thus, we noted the echo texture (homogeneous or heterogeneous), echogenicity (hypo- or hyperechoic), contouring (regular or irregular), nodulation or pseudonodulation, and vascularization of the thyroid gland (decreased, or normal, or increased).
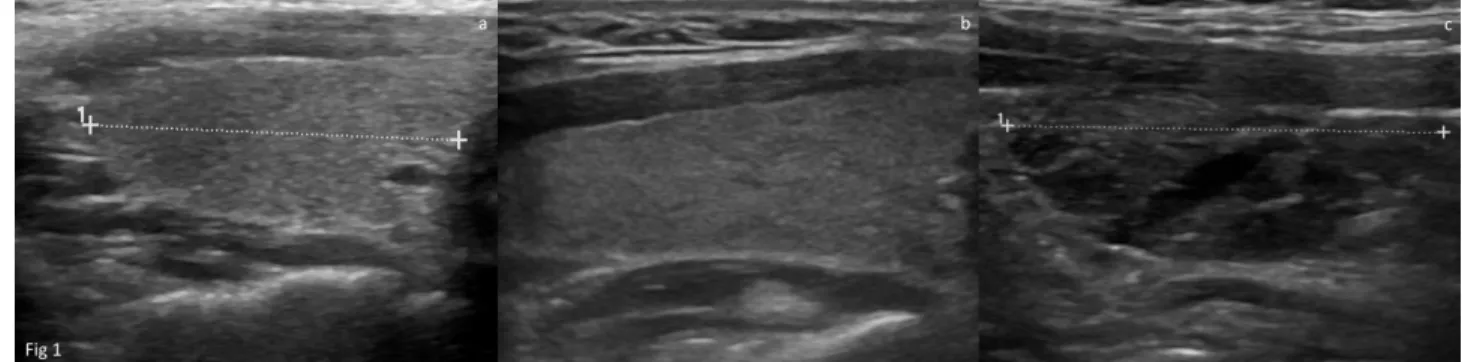
The cases were divided into three groups by reference to the sonographic properties described above. Patients with normal US, clinical, and laboratory results were assigned to group 1 (control cases; Figure 1a). Group 2 (early stage/indeterminate cases; Figure 1b) patients consisted of those without any detectable thyroid auto-antibodies and no certain thyroiditis signs during ultrasonography except minimal parenchymal hypoechogenicity and suspected heterogeneity, but still clinically suspected
Figure 1. a) Normal sonographic findings from group 1 (control group), b) group 2 (early stage/indeterminate cases) exhibits normal
glandular vascularization (not shown here) and laboratory data, with very slight parenchymal heterogeneity, c) group 3 (definite thyroiditis cases) exhibits varying degrees of parenchymal heterogeneity, echo loss, irregular contouring, and gland shrinkage, depending on the chronicity of disease.
of having autoimmune thyroiditis. Patients in whom the parenchyma was heterogeneous/hypoechogenic in appearance and who had echogenic interlobular septa, irregular contours, pseudonodules, and glands of reduced size were assigned to group 3 (definite thyroiditis cases; Figure 1c). Indeterminate patients were followed up for 1 year and included as indeterminate/early-stage thyroiditis patients (group 2) after definite diagnoses of thyroiditis were made by reference to the final follow-up US and laboratory data.
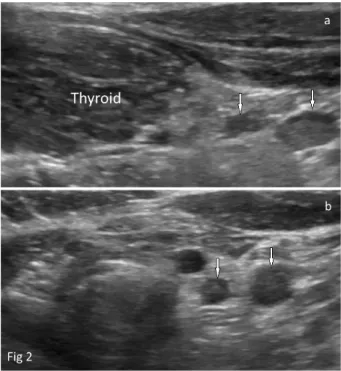
The paratracheal lymph nodes examined primarily along the inferior contour of each lobe of the thyroid gland in the axial and sagittal planes (Figure 2). Right and left nodes were separately evaluated. Measurements of lymph nodes were performed in all patients in the sagittal plane as standard. The long- and short-axis lengths, long-/ short-axis ratios, and the presence or absence of hila of paratracheal lymph nodes were evaluated as objective criteria.
2.3. Statistical analysis methods
All statistical analyses were performed using the Number Cruncher Statistical System (NCSS) 2007 and the Power Analysis and Sample Size (PASS) 2008 statistical software (Utah, USA). One-way ANOVA was used to compare qualitative features and Tukey’s HSD test was employed to identify the group responsible for any observed difference. We also derived descriptive data (mean, standard
deviation, median, frequency, ratio, and minimum to maximum). The Kruskal–Wallis test was used to compare three or more groups when the data were nonuniformly distributed, and the Mann–Whitney U test was used to identify the group responsible for any observed difference. Pearson’s chi-squared test, Fisher’s exact test, the Fisher– Freeman–Halton test, and Yates’ continuity correction test (Yates’ corrected chi-squared test) were used to compare qualitative variables. Spearman’s correlation analysis was performed to define relationships between parameters. Cut-off points were identified using diagnostic test data and employing ROC curve analysis. P-values < 0.01 and < 0.05 were considered to reflect statistical significance.
3. Results
3.1. Characteristics of the study groups
We studied 90 (71.4%) female and 36 (28.6%) male patients. The mean age of all patients was 37.83 ± 12.11 (18–73) years. Group 1 had 30 patients (23.8%) (control cases), group 2 had 33 (26.2%) (early-stage/indeterminate cases), and group 3 had 64 (50%) (definite thyroiditis cases).
3.2. Groups of autoimmune thyroiditis and features of paratracheal lymph nodes on US
While only 46.2% of control cases (group 1) had left PLNs, their presence increased in early-stage/indeterminate cases (group 2) (80%) and definite thyroiditis cases (group 3) (88.5%). Significant among-group differences were evident in terms of left PLNs’ presence (Pearson chi-squared test, P = 0.001) (Table 1).
Although there was a significant increase in left PLN presence rate when definite and early stage/indeterminate thyroiditis groups were compared with the control group (P = 0.001; P = 0.018), no significant difference was found between the definite and early-stage/indeterminate thyroiditis groups (P > 0.05).
The long axis of the left PLNs was 7.47 ± 1.44 mm, 8.3 ± 2.67 mm, and 9.75 ± 2.67 mm and the short axis of the left PLNs was 3.27 ± 0.62 mm, 3.43 ± 1.18 mm, and 4.27 ± 1.22 mm in the control, early-stage/indeterminate, and definite thyroiditis groups, respectively. There was a statistically significant increasing trend in length of both the long and short axis of the left PLNs through the progression of thyroiditis in different stages (Kruskal– Wallis test, P = 0.002 and P = 0.004, respectively) (Table 2). Both the long and short (9.75 ± 2.67 mm and 4.27 ± 1.22 mm, respectively) axis of the left PLNs in the definite thyroiditis group were longer compared to the control (7.47 ± 1.44 mm and 3.27 ± 0.62 mm) and early-stage/ indeterminate (8.3 ± 2.67 mm and 3.43 ± 1.18 mm) groups (Mann–Whitney U test, P < 0.01). Both the long and short axis length of the left PLNs in the definite thyroiditis group were higher than in both the early-stage/indeterminate
Figure 2. a) (sagittal), and b) (axial) views of a lymph node with
a regular contour that is oval and hypoechoic in the paratracheal region.
Table 2. PLN data on all patients, by group, and their relationships with TG Ab and TPO Ab levels.
1Control 2Indeterminate 3Definite P Anti-TG Anti-TPO
r P r P Right PLN long axis (mm) N 4 7 26 Min–Max (Median) 7.1–10.0 (7.65) 3.3–9.7 (8.5) 4.6–15.0 (9) 0.316 0.145 0.481 0.256 0.197 Mean ± SD 8.1 ± 1.29 7.43 ± 2.38 9.02 ± 2.48 Right PLN short axis (mm) N 4 7 26 Min–Max (Median) 3.1–3.9 (3.6) 3.1–5.7 (4.4) 2.0–6.2 (4) 0.157 0.066 0.748 0.195 0.330 Mean ± SD 3.55 ± 0.37 4.44 ± 0.91 4.04 ± 0.96 Right PLN long/short ratio N 4 7 26 Min–Max (Median) 1.97–2.63 (2.27) 0.62–2.29 (1.93) 1.5–2.96 (2.25) 0.073 –0.064 0.757 –0.055 0.785 Mean ± SD 2.29 ± 0.31 1.72 ± 0.56 2.25 ± 0.42 Left PLN long axis (mm) N 12 24 54 Min–Max (Median) 5.5–11 (7.4) 3.8–14.0 (7.9) 5.2–16.0 (9.4) 0.002** 0.350 0.008** 0.170 0.184 Mean ± SD 7.47 ± 1.44 8.3 ± 2.67 9.75 ± 2.67 Left PLN short axis (mm) N 12 24 54 Min–Max (Median) 2.5–4.8 (3.15) 1.5–5.8 (3.15) 2.4–7.90 (4.2) 0.004** 0.318 0.017* 0.202 0.113 Mean ± SD 3.27 ± 0.62 3.43 ± 1.18 4.27 ± 1.22 Left PLN long/short ratio N 12 24 54 Min–Max (Median) 1.93–2.67 (2.3) 1.52–3.80 (2.4) 1.23–4.04 (2.24) 0.560 0.002 0.989 –0.067 0.604 Mean ± SD 2.29 ± 0.22 2.52 ± 0.64 2.36 ± 0.59 Anti-TG (IU/mL) Mean ± SD 18.97 ± 10.88 22.12 ± 9.11 275.57 ± 300.84 0.001** (Median) (17.0) (20.1) (174.5) Anti-TPO (IU/mL) Mean ± SD 10.80 ± 13.37 23.85 ± 53.05 306.55 ± 423.31 0.001** (Median) (5.8) (7.9) (266)
R = Spearman correlation coefficient; *Kruskal–Wallis test, P < 0.05; ** Kruskal–Wallis test, P < 0.01 PLN: Paratracheal lymph node,
1Control: group 1(control cases), 2Indeterminate: group 2 (early-stage, indeterminate cases), 3Definite: group 3 (definite thyroiditis cases)
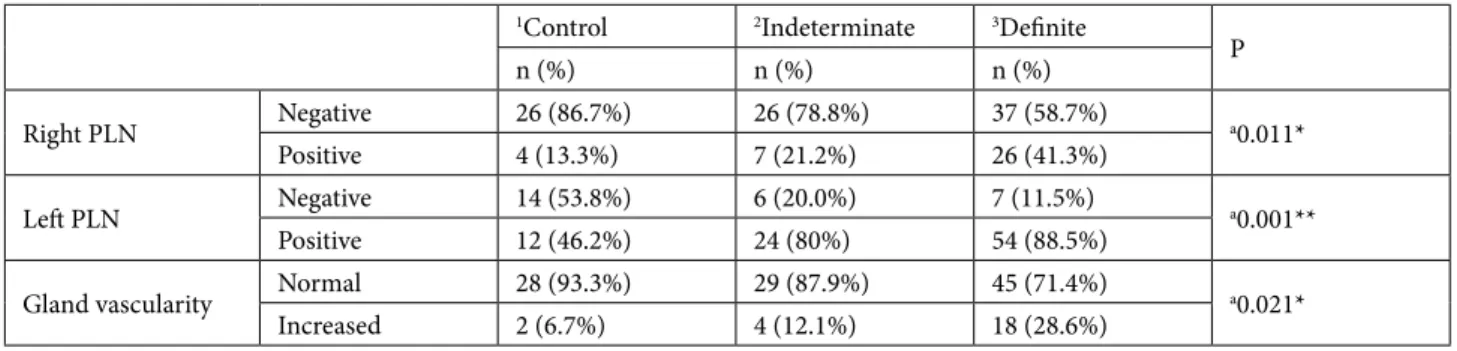
Table 1. The association between glandular vascularization and the presence of right and left PLNs.
1Control 2Indeterminate 3Definite P n (%) n (%) n (%) Right PLN Negative 26 (86.7%) 26 (78.8%) 37 (58.7%) a0.011* Positive 4 (13.3%) 7 (21.2%) 26 (41.3%) Left PLN Negative 14 (53.8%) 6 (20.0%) 7 (11.5%) a0.001** Positive 12 (46.2%) 24 (80%) 54 (88.5%)
Gland vascularity Normal 28 (93.3%) 29 (87.9%) 45 (71.4%) a0.021*
Increased 2 (6.7%) 4 (12.1%) 18 (28.6%)
aPearson chi-square test; **P < 0.01; *P < 0.05
PLN: Paratracheal lymph node, 1Control: group 1 (control cases), 2Indeterminate: group 2 (early-stage, indeterminate cases), 3Definite: group 3 (definite thyroiditis cases)
and control groups (P = 0.012, P = 0.003 and P = 0.009, P = 0.007, respectively). However, there was no significant difference between the long and short axis of the left PLNs when compared in the early stage/indeterminate and control groups (P > 0.05). Long-/short-axis ratio of the left PLNs showed no significant difference among the groups (Kruskal–Wallis test, P > 0.05) (Table 2).
While only 13.3% of the control group had right PLNs, their presence increased in the early-stage/indeterminate (21.2%) and definite (41.3%) groups. Significant among-group differences were evident in terms of right PLNs’ presence (Pearson chi-squared test, P = 0.011) (Table 1).
Although the presence ratio of right PLNs was significantly higher in the definite thyroiditis group when compared to the early stage/indeterminate cases (P = 0.049) and control cases (P = 0.014), such a significant difference was not noted in the comparison of the early-stage/indeterminate and control groups (P > 0.05).
The long axis of the right PLNs was measured as 8.1 ± 1.29 mm, 7.43 ± 2.38 mm, and 9.02 ± 2.48 mm and the short axis of the right PLNs was measured as 3.55 ± 0.37 mm, 4.44 ± 0.91 mm, and 4.04 ± 0.96 mm in the control, early-stage/indeterminate, and definite thyroiditis groups, respectively (Table 2). Among the groups, statistically significant length differences were not observed in the right PLNs’ long-axis length, short-axis length, or long-/ short-axis ratio (Kruskal–Wallis test, P = 0.316, P = 0.157; and P = 0.073, respectively) (Table 2).
Vascularity of the thyroid gland parenchyma differed significantly among the groups (Pearson chi-square test, P = 0.021) (Table 1). Perfusion rates of definite thyroiditis cases and early-stage/indeterminate group cases were not significantly different (P > 0.05), yet were significantly higher in the definite thyroiditis group when compared to the controls (P < 0.05). No statistically significant perfusion rate difference was seen when compared to the early stage/ indeterminate cases and control cases (P > 0.05).
The hilar fat levels in the left and right PLNs did not differ significantly among different stages of thyroiditis (Fisher–Freeman–Halton test, P > 0.05). Additionally, cysts and significant calcification of PLNs were not detected.
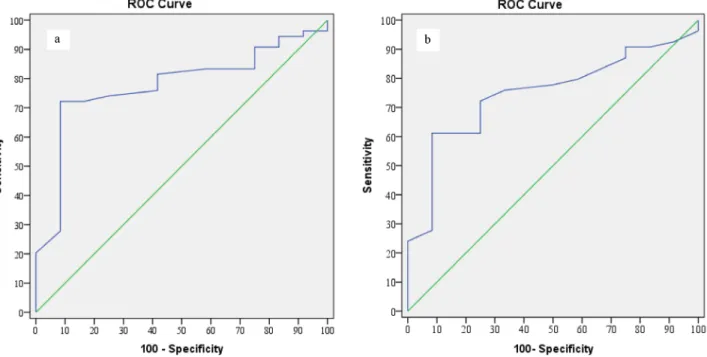
We analyzed the short- and long-axis lengths of the PLNs to identify cut-offs that might aid in diagnosis. Although cut-off values could be defined for the left PLNs, this was not the case for the right PLNs because only four group 1 patients had right PLNs. Table 3 and Figure 3 show the cut-off values and ROC curve data from the control cases/definite thyroiditis group.
3.3. Relationships between US and laboratory data in autoimmune thyroiditis patients
Tg Ab levels of patients with right and left PLNs were significantly higher than those of patients lacking PLNs (P = 0.003 and P = 0.013).
No significant differences in Tg Ab or TPO Ab levels were apparent when the control (group 1) and early-stage/ indeterminate (group 2) patients were compared (P > 0.05). TPO Ab and Tg Ab levels were significantly higher in the definite group than in the other groups (P < 0.01) (Table 2). For this reason, thyroid antibodies cannot influence the decision on AT diagnosis in early-stage disease.
A significant positive relationship was evident between the long- and short-axis lengths of left PLNs and Tg Ab levels (P < 0.01), but was not detected between the measurements of the right PLNs and antithyroid antibody levels (P > 0.05) (Table 2). However, interestingly, there was no significant relationship between TPO Ab levels either with AT presence or the measurements of right and left PLNs (P > 0.05) (Table 2).
4. Discussion
A diagnosis of autoimmune thyroiditis is usually made based on clinical data combined with the presence of Tg Ab and TPO Ab, and measurement of T4 and TSH (8,24). Tg Ab and TPO Ab measurements are essential for diagnosis; the sensitivity rates are high (25). However, the use of only laboratory or clinical data means almost half of all patients could be overlooked (8). Some studies have suggested that it is possible to predict thyroid parenchymal inflammation and destruction via US (26). Moreover, US performed in the early stages of a disease is more informative than are autoantibody levels in terms of future thyroid dysfunction (27). Therefore, a combination of clinical and laboratory
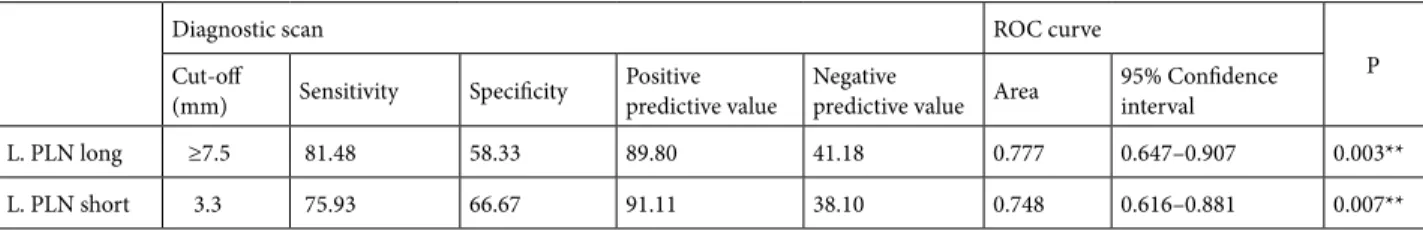
Table 3. Diagnostic test and ROC analysis of left PLN.
Diagnostic scan ROC curve
P
Cut-off
(mm) Sensitivity Specificity Positivepredictive value Negativepredictive value Area 95% Confidence interval
L. PLN long ≥7.5 81.48 58.33 89.80 41.18 0.777 0.647–0.907 0.003**
L. PLN short 3.3 75.93 66.67 91.11 38.10 0.748 0.616–0.881 0.007**
findings, and US, can significantly increase the sensitivity and specificity of autoimmune thyroiditis diagnosis (7,8).
The primary cause of autoimmune thyroiditis is lymphocytic infiltration of the thyroid, which destroys the parenchyma and decreases US echogenicity (20). In many cases, diagnosis is simple because of accompanying sonographic findings. However, detection of glandular involvement in some patients under suspicion of early-stage autoimmune thyroiditis, for whom symptoms are not clearly evident upon US, can be difficult. In such cases, a radiologist might seek a consultation with another specialist or can explore thyroid gland vascularity and/or serum thyroid antibody levels. Our study shows that in the early stages of thyroiditis the presence ratio of paratracheal lymph nodes increases, but neither vascularity nor serum antibody levels rise notably during the indeterminate phase (Tables 1 and 2). When thyroiditis is advanced, significant increases in vascularity and Tg Ab and TPO Ab levels may be noted (Table 2). Thus, assessment of PLNs is important during the early–indeterminate stages of autoimmune thyroiditis (Figure 2).
Two prior studies evaluated right and left PLNs in combination (10,13). We evaluated the PLNs separately. When autoimmune thyroiditis stages were reviewed, left PLN presence rates at early/indeterminate and definite thyroiditis stages were found to be significantly higher than in the control group (46.2%), and increased with stage. PLN presence rates were 80% in the early-stage/ indeterminate group and 88.5% in the definite thyroiditis group.
On the right side, the PLN presence rate was significantly higher in the definite thyroiditis group when compared with both the early/indeterminate and control groups. However, no significant difference was evident between the control and early-stage/indeterminate group, unlike what was noted with the left PLNs. Therefore, right-side PLN presence cannot be used as a marker of early-stage autoimmune thyroiditis. In addition, in the right PLNs, a significant among-group difference was not evident either in PLN measurements or in long-/short-axis ratio; therefore they cannot be used to document transitions between autoimmune thyroiditis stages (Table 2).
As thyroiditis became more defined, the PLN presence rates increased accordingly, in agreement with a previous study that reported a PLN presence rate of 82% in autoimmune thyroiditis cases (13). Serres et al. reported that the overall PLN presence rate was 92.46% (10). However, in our study, 88.5% had positive left and 41.3% had positive right PLNs in the definite thyroiditis group. Thus, right PLNs are less common. It is common knowledge that the lymphatic system is usually accompanied by blood vessels featuring fast blood flow. Several studies have shown that most venous blood in the dural venous sinuses drains to the right internal jugular vein. Thus, lymphatic drainage will be higher on the right side than on the left side. In our view, as left-side lymphatic drainage is lower, lymphatic fluid will accumulate more in the left paratracheal lymph nodes, explaining the observed increase in PLN numbers on that side (28–31).
Figure 3. ROC analyses of left PLN data, by group a) ROC curve for left paratracheal lymph node (PLN) long axis (control/definite
In control patients, we found that left PLNs were present in 46.2% of cases and right PLNs were found in 13.3% of cases. Serres et al. (10) reported a general PLN presence rate of 25.4% in such patients. Even though it is included in the study exclusion criteria, a reason that might affect the neck lymph nodes of the patients such as a bacterial or viral infection during or before the study that cannot be remembered by the patient might be the cause of this result, which explains this high rate of PLN numbers in control patients.
In a four-group study by Giovagnorio et al. (13), the mean long-axis length was 7.5 ± 3.8 mm, the short-axis length was 3.7 ± 0.6 mm, and the long-/short-axis ratio was 2 ± 0.3; no significant among-group difference was apparent such as in our measurements of right PLNs. However, group 4 of that study included patients with thyroid nodules; we excluded such patients because the PLN data might have been affected.
Serres et al. (10) did not divide cases into groups, but did measure PLNs’ long axes. The mean length was 8.2 ± 2.4 mm in the control group but 10.7 ± 3.3 mm in the autoimmune thyroiditis group. They did not measure short axes or long/short axis ratios. In the present study, the mean left PLNs’ long axis was 9.75 ± 2.67 mm and the short axis was 4.27 ± 1.22 mm; the mean right paratracheal lymph nodes long axis was 9.02 ± 2.48 mm, and the short axis was 4.04 ± 0.96 mm. In brief, our results lie between those of two earlier studies, but our long axes were somewhat closer to the lengths reported by Serres et al. (10).
The left PLNs’ long-/short-axis ratio did not differ significantly among the groups (Table 2). In addition, the measurements of right PLNs (both long and short axis, long-/short-axis ratio) did not differ significantly among the groups. It seems that right PLN measurements do not carry much importance in AT assessment in contrast with statistically significant result of left PLN measurements in those cases. Based on this, we argue that it is important to review the PLNs on both sides separately, in contrast with Serres and Giovagnorio’s previous studies.
There is no detailed data on lymph node dimensions in autoimmune thyroiditis, and it is unclear which dimensions might aid in autoimmune thyroiditis diagnosis. We found that the most informative measure was the long-axis length of the left PLNs, followed by the short-axis length of the same node. We reached this conclusion after thoroughly comparing the control and definite groups.
Serres et al. (10) compared control and definite thyroiditis groups, and found that a 7-mm cut-off of long-axis length afforded 82% sensitivity and 87% specificity. In the present study, when the control and definite groups were compared, the sensitivity was 81.48% and the specificity was 58.33% when the cut-off length for the
left PLNs’ long axis was ≥ 7.5 mm (Table 3a). In addition, when the control and definite groups were compared, the sensitivity was 75.93% and the specificity was 66.67% when the cut-off length for the left PLNs’ short axis was 3.3 mm (Table 3b).
Left PLNs seem to play an important role in the diagnosis of early-stage AT as a comparison tool between the early-stage/indeterminate group and control group. Right PLNs, however, are important in assessment of the progression of the disease from early stage to advanced stage, as they are seen significantly higher in the definite thyroiditis group when compared with the early-term/ indeterminate group. When the control and definite groups were compared, the left PLNs’ long-axis length had a significantly higher difference.
There was no significant relationship between TPO Ab and both right and left PLNs either in presence or in measurement terms. There was a significant relationship between Tg Ab and left PLN short and long axis; however, there is no such relationship in right PLNs. In the literature, no correlation between PLN size and antimicrosomal antibody titer was evident (10).
Serres et al. reported that about 11% of autoimmune thyroiditis cases lack classic US features (10). However, this rate (in the early-stage/indeterminate group) was 26.2% in the present study. The rate of right PLN presence was 21.2% and that of left PLN presence was 80% in such cases; Serres et al. (10) reported a figure of 81%. They diagnosed autoimmune thyroiditis in such cases using laboratory and cytology data. However, according to our results, in the early stages of autoimmune thyroiditis, antibody levels do not aid diagnoses (Table 2). We diagnosed such patients after 1 year of follow-up.
We observed that vascularization increased as autoimmune thyroiditis progressed, in agreement with previous data (21). As the extent of vascularization did not differ between the control and early-stage/indeterminate groups, vascularization of the thyroid gland does not serve as an early diagnostic criterion. Vascularization of the thyroid gland increases significantly in the definite thyroiditis group compared to others; thus it can be used to guide staging or during follow-up with other sonographic findings.
As explained above, left PLN changes seem to develop before increases in thyroid autoantibody levels and gland vascularity, and thus PLN presence may serve as an early warning sign of thyroiditis. Evaluation of PLNs using classic sonographic criteria increases the sensitivity of autoimmune thyroiditis diagnosis in early stage/ indeterminate cases.
The most important limitation in our study was the lack of histopathological verification of the cases even though patients were diagnosed with a combination of
physical examination findings, laboratory results, and sonographic assessment. Another important limitation was while we reviewed lymph nodes in 3 different groups as right and left PLNs, in some groups, ROC analysis was not possible due to insufficient numbers of lymph nodes on the right. More certain and solid results might be obtained using wider patient series and longer follow-up periods including histopathological confirmation of all patients in future studies. We sincerely hope that our study will lead the way to such studies in the future.
In conclusion, if US imaging of the thyroid gland does not clearly reveal classic thyroiditis signs, PLNs can be assessed. Careful and thorough review of the PLNs can ensure diagnosis of autoimmune thyroiditis even in patients with early stage of the disease and prevent false-negative diagnoses. Abnormalities (such as increasing presence) in PLNs seem to develop earlier than increases in thyroid autoantibody levels and gland vascularity. Both long- and short-axis length of left PLNs can be used to diagnose autoimmune thyroiditis.
References
1. Sivanandan R, Soo KC. Pattern of cervical lymph node metastases from papillary carcinoma of the thyroid. Br J Surg 2001; 88: 1241-1244.
2. Machens A, Hinze R, Thomusch O, Dralle H. Pattern of nodal metastasis for primary and reoperative thyroid cancer. World J Surg 2002; 26: 22-28.
3. Wada N, Duh QY, Sugino K, Iwasaki H, Kameyama K, Mimura T, Ito K, Takami H, Takanashi Y. Lymph node metastasis from 259 papillary thyroid microcarcinomas: frequency, pattern of occurrence and recurrence, and optimal strategy for neck dissection. Ann Surg 2003; 237: 399-407.
4. Chong V. Cervical lymphadenopathy: what radiologists need to know. Cancer Imaging 2004; 4: 116-120.
5. Brancato D, Citarrella R, Richiusa P, Amato MC, Vetro C, Galluzzo CG. Neck lymph nodes in chronic autoimmune thyroiditis: the sonographic pattern. Thyroid 2013; 23: 173-177.
6. Kasagi K, Kousaka T, Higuchi K, Iida Y, Misaki T, Alam MS, Miyamoto S, Yamabe H, Konishi J. Clinical significance of measurements of antithyroid antibodies in the diagnosis of Hashimoto’s thyroiditis: comparison with histological findings. Thyroid 1996; 6: 445-450.
7. Gutekunst R, Hafermann W, Mansky T, Scriba PC. Ultrasonography related to clinical and laboratory findings in lymphocytic thyroidits. Acta Endocrinol (Copenh) 1989; 121: 129-135.
8. Nordmeyer JP, Shafeh TA, Heckmann C. Thyroid sonography in autoimmune thyroiditis. A prospective study on 123 patients. Acta Endocrinol (Copenh) 1990; 122: 391-395.
9. Willms A, Bieler D, Wieler H, Willms D, Kaiser KP, Schwab R. Correlation between sonography and antibody activity in patients with Hashimoto thyroiditis. J Ultrasound Med 2013; 32: 1979-1986.
10. Serres-Créixams X, Castells-Fusté I, Pruna-Comella X, Yetano-Laguna V, Garriga-Farriol V, Gallardo-Agromayor E. Paratracheal lymph nodes: a new sonographic finding in autoimmune thyroiditis. J Clin Ultrasound 2008; 36: 418-421.
11. Friedman M, Shimaoka K, Rao U, Tsukada Y, Gavigan M, Tamura K. Diagnosis of chronic lymphocytic thyroiditis (nodular presentation) by needle aspiration. Acta Cytol 1981; 25: 513-522.
12. Langer JE, Khan A, Nisenbaum HL, Baloch ZW, Horii SC, Coleman BG, Mandel SJ. Sonographic appearance of focal thyroiditis. AJR Am J Roentgenol 2001; 176: 751-754. 13. Giovagnorio F, Glorioso M, Brino MD. Sonographic
evaluation of anterior cervical lymph nodes. J Med Ultrasonics 2013; 40: 237-241.
14. James EM, Charboneau JW, Hay ID: The thyroid. In: Rumack CM, Wilson SR, Charboneau JW, editors. Diagnostic Ultrasound. St. Louis, MO, USA: Mosby; 1991. p. 507.
15. Chaudhary V, Bano S. Thyroid ultrasound. Indian J Endocrinol Metab 2013; 17: 219-227.
16. Pedersen OM, Aardal NP, Larssen TB, Varhaug JE, Myking O, Vik-Mo H. The value of ultrasonography in predicting autoimmune thyroid disease. Thyroid 2000; 10: 251-259.
17. Yeh HC, Futterweit W, Gilbert P. Micronodulation: ultrasonographic sign of Hashimoto thyroiditis. J Ultrasound Med 1996; 15: 813-819.
18. Marcocci C, Vitti P, Cetani F, Catalano F, Concetti R, Pinchera A. Thyroid ultrasonography helps to identify patients with diffuse lymphocytic thyroiditis who are prone to develop hypothyroidism. J Clin Endocrinol Metab 1991; 72: 209-213.
19. Yildirim D, Sanal HT, Kocaoglu M: Hyperechoic nodules in Hashimoto’s thyroiditis: correlation with cytopathological findings; biopsy may not be necessary at all. Yeditepe Med J 2009; 10: 183-187.
20. Hayashi N, Tamaki N, Konishi J, Yonekura Y, Senda M, Kasagi K, Yamamoto K, Iida Y, Misaki T, Endo K et al. Sonography of Hashimoto’s thyroiditis. J Clin Ultrasound 1986; 14: 123-126.
21. Kerr L. High-resolution thyroid ultrasound: the value of color Doppler. Ultrasound Q 1994; 12: 21-44.
22. Kim DW, Eun CK, In HS, Kim MH, Jung SJ, Bae SK. Sonographic differentiation of asymptomatic diffuse thyroid disease from normal thyroid: a prospective study. AJNR Am J Neuroradiol 2010; 31: 1956-1960.
23. Solbiati L, Charboneau JW, James EM, Hay ID. The Thyroid Gland. In: Rumack CM, Wilson SR, Charboneau JW, editors. Diagnostic Ultrasound Vol 1. St. Louis, MO, USA: Mosby; 1997. p. 724.
24. Pearce EN, Farwell AP, Braverman LE. Thyroiditis. N Engl J Med 2003; 348: 2646-2655.
25. Engler H, Riesen WF, Keller B: Anti-thyroid peroxidase (anti-TPO) antibodies in thyroid diseases, non-thyroidal illness and controls. Clinical validity of a new commercial method for detection of anti-TPO (thyroid microsomal) autoantibodies. Clin Chim Acta 1994; 225: 123-136. 26. Wakita Y, Nagasaki T, Nagata Y, Imanishi Y, Yamada S, Yoda
K, Emoto M, Ishimura E, Inaba M. Thyroid heterogeneity, as indicated by the CV of ultrasonographic intensities, correlates with anti-thyroid peroxidase antibodies in euthyroid Hashimoto’s thyroiditis. Thyroid Res 2013; 6: 5.
27. Rago T, Chiovato L, Grasso L, Pinchera A, Vitti P. Thyroid ultrasonography as a tool for detecting thyroid autoimmune diseases and predicting thyroid dysfunction in apparently healthy subjects. J Endocrinol Invest 2001; 24: 763-769. 28. Park HK, Bae HG, Choi SK, Chang JC, Cho SJ, Byun BJ, Sim
KB. Morphological study of sinus flow in the confluence of sinuses. Clin Anat 2008; 21: 294-300.
29. Durgun B, Ilgıt ET, Cizmeli MO, Atasever A. Evaluation by angiography of the lateral dominance of the drainage of the dural venous sinuses. Surg Radiol Anat 1993; 15: 125-130. 30. Gökçe E, Pınarbaşılı T, Acu B, Fırat MM, Erkorkmaz
Ü. Torcular Herophili classification and evaluation of dural venous sinus variations using digital subtraction angiography and magnetic resonance venographies. Surg Radiol Anat 2014; 36: 527-536.
31. Kopuz C, Aydin ME, Kale A, Demir MT, Corumlu U, Kaya AH. The termination of superior sagittal sinus and drainage patterns of the lateral, occipital at confluens sinuum in newborns: clinical and embryological implications. Surg Radiol Anat 2010; 32: 827-833.