LIVER REGENERATION: POTENTIAL ROLES OF
MESENCHYMAL STEM CELLS AND TOLL LIKE RECEPTORS
A THESIS SUBMITTED TO
THE DEPARTMENT OF MOLECULAR BIOLOGY AND GENETICS AND THE INSTITUTE OF ENGINEERING AND SCIENCE OF
BILKENT UNIVERSITY
IN PARTIAL FULFILLMENT OF THE REQUIREMENTS FOR THE DEGREE OF MASTER OF SCIENCE
BY
HANDE KOÇAK AUGUST 2008
I certify that I have read this thesis and that in my opinion it is fully adequate, in scope and in quality, as a thesis for the degree of Master of Science.
Assist. Prof. Dr. Can Akçalı
I certify that I have read this thesis and that in my opinion it is fully adequate, in scope and in quality, as a thesis for the degree of Master of Science.
Assoc. Prof. Dr. İhsan Gürsel
I certify that I have read this thesis and that in my opinion it is fully adequate, in scope and in quality, as a thesis for the degree of Master of Science.
Prof. Dr. Mehmet Uğur
Approved for the Institute of Engineering and Science
Director of Institute of Engineering and Science
ABSTRACT
LIVER REGENERATION: POTENTIAL ROLES OF
MESENCHYMAL STEM CELLS AND TOLL LIKE RECEPTORS
Hande Koçak
M.S. in Molecular Biology and Genetics
Supervisors: Assist. Prof. Dr. K. Can Akçalı & Assoc. Prof. Dr. İhsan Gürsel August 2008, 89 Pages
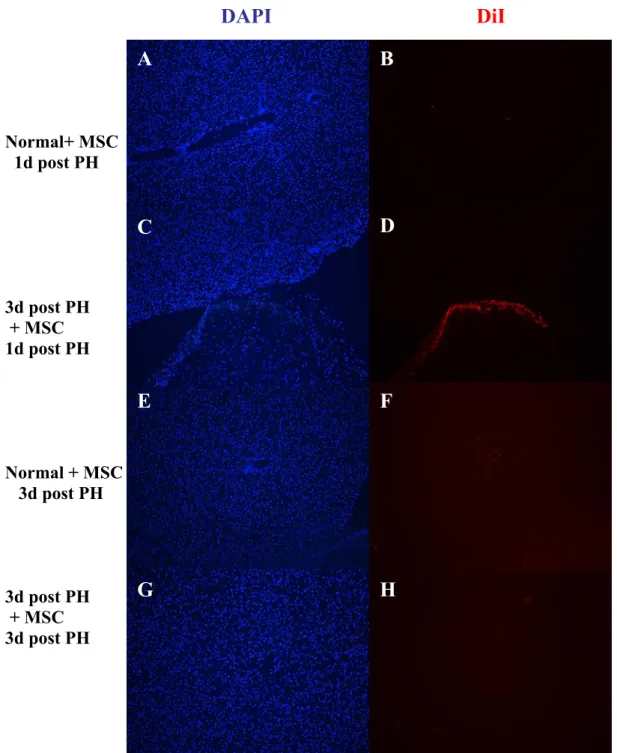
Liver has unique capacity to regenerate in response to loss of hepatocytes depending on viral infections, toxic reactions and cancer formation. Although liver regeneration have been extensively studied, factors participate in the process are still under extensive investigation. Differentiation and immunosuppressive potential, as well as homing capacity to the site of injury of mesenchymal stem cells (MSCs) can be harnessed in liver regeneration. Moreover, toll like receptors (TLRs) which are known to involve immuneregulatory mechanisms of MSCs may also be a player in this process. Therefore, in this study, our aim was to understand the possible roles of MSCs and TLRs during liver regeneration. First, TLR message distribution upon partial hepatectomy induction was assessed. Then, homing capacity of MSCs in liver regeneration was examined by injecting labeled MSC generated from normal or already PH initiated rats back into partially hepatectomized (PH) rats. After investigating MSC homing, mRNA expression profiles of several key TLRs in the course of liver regeneration with or without MSC administration was examined. Finally, the role of TLRs in immunoregulatory properties of MSCs was explored. Our data showed that MSCs from normal rats and at day 1 post PH are localized in liver of PH generated animals. We have also determined that injected MSCs increased TLR2, 3 and 9 expressions in livers in comparison to that of hepatectomized liver that did not receive any MSC injection. Therefore, our data suggests that during liver regeneration at post PH day 3, homing of MSCs to the site of injury is at maximum and TLRs do not play any roles in recruiting these cells to liver, but rather localized MSCs either cis or at
trans manner promote TLR expression. Despite the fact that MSCs are known to be
non-immunogenic, in the present study isolated MSCs from BM are found to be expressing a panel of TLR mRNAs and our findings strongly implicate that these TLRs are functional in terms of cytokine secretion upon triggered by their proper ligands. Finally, we have identified that mouse MSC possesses different levels of critical surface markers such as CD11b, CD45, CD90 and CD117 at different passages and led us to think that either sub-populations or contaminating cell fractions may exist within the studied MSC population and furthermore may contribute to stimulatory potential of MSCs.
ÖZET
KARACİĞER REJENERASYONU: MEZENKİMAL KÖK HÜCRE
VE TOLL BENZERİ RESEPTÖRLERİN POTANSİYEL ROLLERİ
Hande Koçak
Moleküler Biyoloji ve Genetik, Yüksek Lisans Tezi
Danışmanlar: Yard. Doç. Dr. K. Can Akçalı ve Doç. Dr. İhsan Gürsel Ağustos 2008, 89 Sayfa
Karaciğer, viral enfeksiyonlara toksik reaksiyonlara ve kanser oluşumuna bağlı olarak oluşan hepatosit kaybına cevap olarak kendini yenileyebilme kapasitesine sahiptir. Şimdiye kadar karaciğer rejenerasyonu geniş çapta çalışılmış olmasına rağmen, bu işleme katılan faktörler hala yoğun olarak çalışılmaktadır. Mezenkimal kök hücrelerin (MKH) farklılaşması ve immün baskılayıcı potansiyelleri kadar hasarlı bölgeye yönelme ve yerleşme kapasiteleri de onları karaciğer rejenerasyonunda önemli kılar. Ayrıca MKH’lerin bağışıklılığı düzenleme mekanizmalarına katılan toll benzeri reseptörler (TLR) de bu işlemde rol alıyor olabilirler. Bu çalışmadaki ana amacımız karaciğer rejenerasyonu esnasında MKH ve TLR’lerin iyileşme sürecine olası katkılarını araştırmaktır. Öncelikle, kısmi hepatektomi sonrasında TLR mesaj dağılımı belirlendi. Sonra, MKH’ların karaciğer rejenerasyonu esnasında hasarlı bölgeye yerleşme kapasiteleri kısmi hepatektomi (PH) yapılmış veya normal sıçanlardan alınan MKH’lerin işaretlenmesi sonrasında yine PH’lı sıçanlara geri verilmesiyle araştırıldı. Çalışmanın ileri evresinde, karaciğer rejenerasyonunda önemli olan bazı TLR’lerin mRNA ifade temelli profilleri ya sadece PH yapılmış ya da PH yapıldıktan sonra işaretli MKH enjekte edilmiş sıçanlarda araştırılmıştır. Son olarak, TLR’lerin, MKH’lerin bağışıklılığı düzenleyici özelliklerindeki rolleri araştırılmıştır. Sonuçlarımız normal ve bir günlük PH geçirmiş sıçanlardan alınan MKH’lerin, PH geçirmiş hayvanlara verildikten sonra o bölgeye yerleştiğini göstermektedir. Ayrıca PCR çalışmalarımız MKH enjeksiyonunun, MKH almamış PH geçirmiş karaciğerdekine göre TLR2, 3 ve 9 gen mesaj ifadelerini arttırdığını saptadık. Bu nedenle, verilerimiz gösteriyor ki PH 3. gün sonrası karaciğer rejenerasyonu süresince, MKH’lerin yaralanma bölgesine yerleşmesi en yüksek seviyededir ve TLR’ler bu hücrelerin karaciğere çağırılmalarında rol oynamamaktadırlar. Bunun aksine enjekte edilmiş MKH’ler TLR ifadesini cis veya trans şekilde yönlendirmektedirler. MKH’lerin non-immünogenik olarak bilinmelerine rağmen, bu çalışmada kemik iliğinden izole edilen MKH’lerin birçok TLRı ifade ettikleri saptanmıştır ve bulgularımız bu TLR’lerin uygun ligandlarla uyarıldıklarında sitokin salgılanmasında fonksiyonel olduklarını göstermiştir. Son olarak, bu hücrelerin CD11b, CD45, CD90 ve CD117 gibi çok önemli yüzey belirteçlerine pasaj sayısına bağlı olarak farklı derecelerde değiştiğini saptadık ve bu bulgular kullandığımız MKH popülasyonunda ya alt grupların, ya da kontamine hücre gruplarının bulunduğunu düşündürmektedir. Belki de bu hücre grupları MKH’lerin uyarıcı özelliklerini yönlendirmektedirler.
TO MY PARENTS HATİCE, BASRİ YÜCEL AND MY SISTER EMİNE
ACKNOWLEDGEMENT
First of all, I would like to thank and express my deepest gratitude to my supervisors Assist. Prof. Dr. Can Akçalı and Assoc. Prof. Dr. İhsan Gürsel for their guidance, encouragement, support, and patience throughout my thesis work. I would additionally thank them for their invaluable personal advices.
I am very lucky to be a member of two groups with full of helpful and nice “lab” mates. I would like to thank my dearest friends Zeynep, Fatma, Gizem for their friendship, support and patience to my endless questions. I also would like to thank Sinan, Fuat, Rashad, Kutay, Tamer and Erdem for their friendship.
I would like to thank Burcu for helping me in all my animal work. I could not have completed my thesis without her valuable assistance.
I would like to thank Ceren, Şafak, Tolga, Elif, Bâlâ, Çiğdem, Serap, Aydan, Melda, Emre, Raşit who make me feel at home in Bilkent MBG as being excellent friends for me.
I would like to thank Prof. Dr. Mehmet Uğur for his helps in fluorescence microscopy studies.
I would like to thank The Scientific and Technological Research Council of Turkey (TÜBİTAK) for their financial support throughout my thesis work.
Finally, I would like to thank my dear family for trusting and encouraging me in my dreams to be a scientist. I would express my deepest love and appreciation to them for being always there for me. I would not find my way in life without their guidance.
TABLE OF CONTENTS
SIGNATURE PAGE II ABSTRACT III ÖZET IV DEDICATION PAGE V ACKNOWLEDGEMENTS VITABLE OF CONTENTS VII
LIST OF TABLES XI
LIST OF FIGURES XII
ABBREVIATIONS XIII
1. INTRODUCTION 1
1.1. Liver Regeneration 2
1.1.1. Liver Regeneration During Normal Tissue Turnover 2 1.1.2. Hepatocyte-Driven Regeneration after Partial Hepatectomy 3 1.1.2.1. Mitogenic Signals Associated with Initiation of Liver
Regeneration
4 1.1.3. Progenitor Dependent Regeneration After Liver Injury 6
1.1.3.1. Hepatic OvalCells 6
1.2. Mesenchymal Stem Cells 7
1.3. Immune System Responses 10
1.3.1. Pathogen Recognition Receptors 10
1.3.2. TLRs as Pattern-Recognition Receptors 10
1.3.2.1. TLR1, 2 and 6 12
1.3.2.3. TLR4 13
1.3.2.4. TLR 5 14
1.3.2.5. TLR7, TLR8 14
1.3.2.6. TLR 9 14
1.3.2.7. TLR Signalling 15
1.3.2.7.1. MyD88 Dependent Pathways 16 1.3.2.7.1. MyD88 Independent Pathways 17
2.AIM OF STUDY 20
3. MATERIALS AND METHODS 21
3.1. Animals 21
3.2. Standard Solutions and Buffers 21
3.3. Liver Regeneration Model 21
3.3.1. Partial Hepatectomy and Sham Operations Alone 21
3.3.2. Partial Hepatectomy Operation 21
3.3.3. Sham Operations 23
3.4. Cell Culture 23
3.4.1. Cell Number Count with Thoma Cell Counter 23
3.4.2. Spleen Cell Preparation 23
3.4.3. Cell Distribution 24
3.4.4. Stimulation with Different Toll Like Receptor Ligands 24
3.5. RNA Isolation and Quantification 25
3.5.1. Total RNA Isolation from The Liver Tissues 25 3.5.2. Total RNA Isolation from Murine Splenocytes and Mesenchymal
Stem Cells
26 3.5.3 Total RNA Isolation from Rat Mesenchymal Stem Cells 26
3.5.4 Quantification of RNA 27 3.5.4.1. Denaturing Gel Electrophoresis 27
3.6. The cDNA Synthesis 27
3.7. RT-PCR Studies 28
3.7.1. Conventional PCR 28
3.7.2. Agarose Gel for Visualization of PCR Products 28
3.8. The Real-Time RT-PCR Studies 29
3.9. Administration of CM-DiI Labeled Mesenchymal Stem Cells to Partially Hepatectomized Rats
31
3.9.1. Chloromethylbenzamido-1,1–Dioctadecyl-3,3,3’,3’-Tetramethyl
indocarbocyanine Perchlorate (CM-DiI; Lipophilic Carbocyanine) Labeling
31 3.9.2. Preparation of Labeled Mesenchymal Stem Cells For in vivo
Injection
31 3.9.3. Administration of Labeled Mesenchymal Stem Cells to PH Rats 32
3.10. Immunofluorescence Staining 32
3.11. Fluorescence Microscopy Studies 33
3.12. Isolation of the Bone Marrow From the Animals 33 3.13. TLR Mediated Morphological Changes of MSC 34 3.14. Enzyme Linked-Immunoabsorbent Assay(ELISA) 34
3.14.1 Cytokine ELISA 34
3.15. Magnetic Bead Cell Separation 35
3.16. Flow Cytometric Analysis of Cell Surface Markers 36
3.16.1. Fixation of Cells 36
3.16.2. Surface Marker Staining 36
3.16.3. Flow Cytometric Analysis of Cells 36
4. RESULTS 38 4.1. MSC Homing in Partial Hepatectomized Rats 38 4.1.1. Administration of MSC from Normal Rat 38 4.1.2. Administration of MSC from Hepatectomized Rats 40 4.1.3. CD90 Expression in Hepatectomized Livers 40 4.1.4. Flt3 Expression in Hepatectomized Livers 43
4.2. Real Time RT-PCR Results 44
4.2.1. TLR Expression in Partial Hepatectomized Rats 45 4.2.2. Expression of TLRs in MSC-administered PH Groups 48
4.3. Efforts to Delineate MSC Functions 53
4.3.1. TLR expression Pattern of Mesenchymal Stem Cells and Spleen Cells
54 4.3.2. Immunoregulatory Effects of Mesenchymal Stem Cells 55 4.3.3. Bone Marrow Cell Separation Before MSC Generation 60 4.3.4. MSC Characterization by Flow Cytometry 62 4.4. TLR mediated Proliferation and Morphological Changes of Murine
Mesenchymal Stem Cells
64
5. DISCUSSION 66
6. FUTURE PERSPECTIVES 71
7. REFERENCES 72
LIST OF TABLES
Table 3.1 PCR reaction composition 28
Table 3.2 PCR running conditions 28
Table 3.3 The sequences and the sizes of the rat TLR primers used in this study 30 Table 3.4. Reaction composition for real-time PCR 31 Table 4.1 Efficiency values of primer sets used during real-time RT PCR
studies
45
Table 4.2 TLR2 Real time RT-PCR data for PH and MSC-administered PH groups
49
Table 4.3 TLR3 Real time RT-PCR data for PH and MSC-administered PH groups
49
Table 4.4 TLR9 Real time RT-PCR data for PH and MSC-administered PH groups
50
Table 4.5. Product size of mouse TLRs and β-actin
55
Table 4.6. Expression of surface markers in different passages63
LIST OF FIGURES
Figure 1.1. Time kinetics of DNA synthesis in different liver cell types during liver regeneration after partial hepatectomy
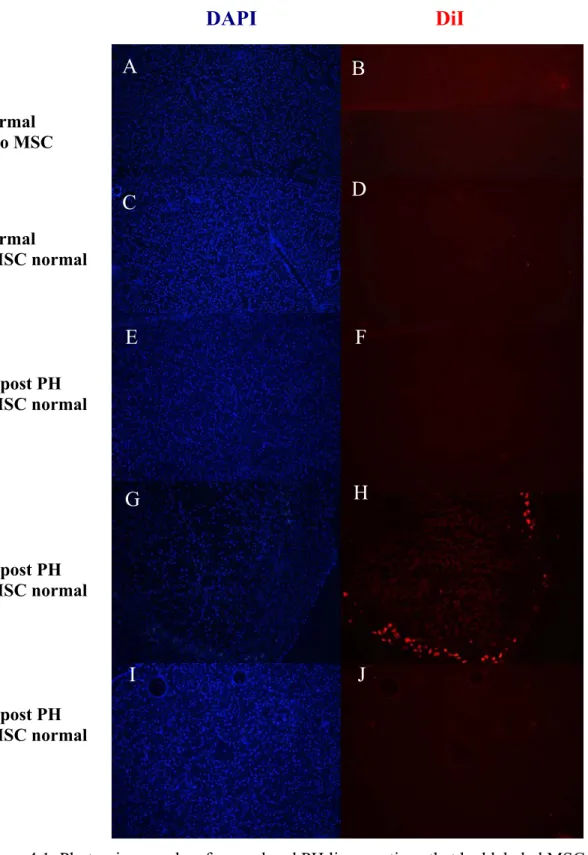
4 Figure 1.2. Immunemodulating effects of ex-vivo expanded MSCs 9 Figure 1.3. TLR signaling activation by bacterial ligands 18 Figure 1.4. TLR signaling activation by viral PAMPs 19 Figure 3.1. The steps of the liver resection surgery for PH 22 Figure 3.2. The isolation of the bone marrow of the rats 33 Figure 4.1. Photomicrographs of Normal and PH Liver Sections that had labeled MSC generated from normal rat
39 Figure 4.2. Photomicrograph of different liver sections that had labeled MSC
generated from 1d and 3day post PH rats
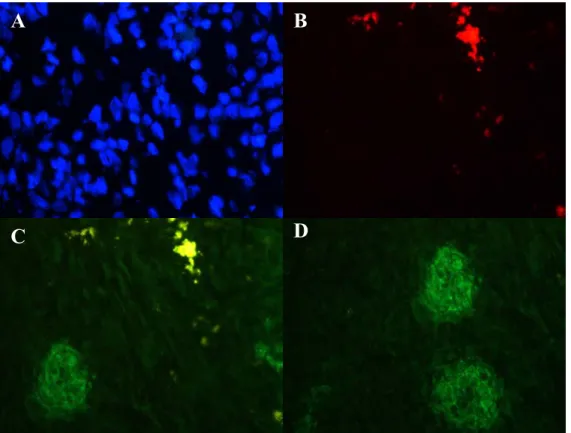
41 Figure 4.3. Photomicrograph showing CD90 expression in 3day post PH liver
sections that received MSC generated from normal rat BM
42 Figure 4.4. Photomicrograph showing Flt3 expression in 3day post PH liver
sections that received MSC generated from normal rat BM
44 Figure 4.5. Fold change in TLR2, TLR3, TLR4, TLR5, TLR6, and TLR9
expression in different time points (h) post PH
46 Figure 4.6. Fold change in TLR2, TLR3 and TLR9 expression in PH and
MSC-administered PH groups
51 Figure 4.7. Variations in the TLR expression profile between mouse MSC and
spleen cells
55 Figure 4.8. IL6 production after 48h stimulation of different ratios of
MSC-splenocyte co-culture with different TLR ligands
56 Figure 4.9. IL6 production after 5days stimulation of CD34- and CD34+ cells
with different TLR ligands
61 Figure 4.10. Surface marker expression change of different MSC passages 63 Figure 4.11. TLR mediated Proliferation and Morphological Changes of Murine MSC
ABBREVIATIONS
APC Antigen Presenting Cell
bp Base Pairs
BFB Bromophenol Blue
BSA Bovine Serum Albumin CD Cluster of differentiation
cDNA Complementary Deoxyribonucleic Acid CFU-F Colony-forming Units-fibroblastic CYC Cyclophilin
ddH2O Double Distilled Water
DC Dendritic Cell
DEPC Diethylpyrocarbonate dH2O Distilled Water
DMEM Dulbecco’s Modified Eagle Medium DNA Deoxyribonucleic Acid
DNase Deoxyribonuclease
dsRNA Double-stranded RNA
EAE Experimental Autoimmune Encephalomyelitis EGF Epidermal Growth Factor
ELISA Enzyme Linked-Immunosorbent Assay FACS Fluorescence Activated Cell Sorter FBS Fetal Bovine Serum
FLT3 Fms-related Tyrosine Kinase g Grams
GVHD Graft-versus-host Disease HGF Hepatocyte Growth Factor HSC Hematopoietic Stem Cell
HSCT Hematopoietic Stem Cell Transplantation ICAM Intercellular Adhesion Molecule
IF Immunofluorescent IFN Interferon
Ig Immunoglobulin IL Interleukin IRAK IL1R Associated Kinase IRF IFN- Regulatory Factor µg Microgram
µl Microliter
lt Liter
LCT Liver Cell Transplantation LBP LPS-binding protein
LPS Lipopolysaccharide LRR Leucine-rich-repeat
LTA Lipoteichoic Acid
Mac-1 Macrophage-1 antigen
M Molar
MetOH Methyl Alcohol
mg Milli Gram
mL Milli Liter
mM milliMolar
MOPS 4-Morpholinopropanesulfonic Acid
MS Multiple Sclerosis
MSC Mesenchymal Stem Cell
MyD88 Myeloid Differentiation Primary Response Gene 88 NF-κB Nuclear Factor-kappa B
NaCl Sodium Chloride
NK Natural Killer
NLR NOD-like Receptors
NOD Nucleotide Binding Oligomerization Domain OD Optical Density
ODN Oligodeoxynucleotide OLT Orthotopic Liver Transplantation PAMP Pathogen associated molecular pattern PBS Phosphate Buffered Saline
PFA Paraformaldehyde PGN Peptidoglycan
PH Partial Hepatectomy
PI3K Phosphotidyl Inositol 3-Kinase
pI:C Polyriboinosinic Polyribocytidylic Acid PNPP Para-nitrophenyl Pyro Phosphate PRR Pattern Recognition Receptor RIG-I Retinoic Acid-inducible Gene I
RLH RIG-I-like helicase
RNA Ribonucleic Acid
RPMI Roswell Park Memorial Institute
RT Room Temperature
RT-PCR Reverse-Transcriptase Polymerase Chain Reaction RTK Receptor Tyrosine Kinase
SA-AKP Streptavidin Alkaline-phosphatase SH Sham
ssRNA Single Stranded RNA TAE Tris Acetate EDTA
TGF Transforming Growth Factor
TIR Toll/IL1 Receptor
TIRAP Toll/IL1 receptor-associated Protein
TLR Toll-like Receptor
TNF Tumor Necrosis Factor
TRAF TNF-associated Factor TRAM TRIF-related adaptor molecules
TRIF TIR-domain containing adaptor inducing IFN-β XC Xylene Cyanol
1. INTRODUCTION
Since the first development of the technique of orthotopic liver transplantation (OLT) in the early 1960s (Starzl et al, 1963), several improvements have been made in this field. Although OLT is considered as a gold standard treatment for liver failure, organ shortage problem leads researchers to study on alternative solutions. Despite having limiting factors as cell viability, modest engraftment and limited tissue viability (Philippe et al, 2008), liver cell transplantation (LCT) is one of the developing alternative with increasing success (Najimi and Sokal, 2005; Stephenne et al, 2006). Stem cells are very potent candidates for LCT due to their plasticity (Verfaillie, Pera and Landsdrop, 2002). Besides hematopoietic stem cells (HSCs) and adult liver stem/progenitor cells, mesenchymal stem cells (MSCs) are also used in liver cell therapy because of their hepatic potential (Philippe et al, 2008).
In addition to their hepatic potential, MSCs have two other important properties that make them critical for LCT. One of them is their preferential migration into injured site, which results in targeting of the cells to the site of liver failure to a certain extent. The other one is their immunoregulatory properties. They are not only non-immunogenic but also immunosuppressive. Due to these features MSCs shine as a very promising tool for cell-based therapies including liver diseases. Being non-immunogenic is extremely important in every kind of transplantation providing a wide size of donor population.
In recent decades, immunoregulatory properties of MSCs have been extensively studied. Although mechanism is unclear yet, there seems to be several factors playing role in immunoregulation. Pevsner-Fisher et al. (2007) has recently shown that murine MSCs express several Toll-like receptors (TLRs) and in particular TLR2 was found to be important in differentiation potential of MSCs. This leads us
to think whether there is a connection between TLRs and immunoregulatory property of MSC.
In this context, firstly liver regeneration will be explained. Then, next part will be about general characteristics and immunoregulatory properties of MSCs. In the last part, general characteristics and individual TLRs will be defined.
1.1. Liver Regeneration
Liver is an interesting organ with high regenerative capacity and complex functions (Michalopoulos and DeFrances, 1997; Taub, 2004). Liver regeneration has been an object of curiosity since the ancient Greeks recognized it in the myth of Prometheus. It is likely to be evolved to protect animals from the catastrophic results of liver loss caused by food toxins in nature (Fausto et al, 2006). It has also been shown that animals can survive surgical removal up to 75% of the total liver mass in experimental conditions (Bucher and Swaffield, 1964).
Accumulating evidences has shown that there are at least three distinct liver regeneration mechanisms (Grompe and Finegold, 2001):
1. liver regeneration during normal tissue turnover 2. hepatocyte-driven regeneration after liver injury 3. progenitor-dependent regeneration after liver injury
1.1.1. Liver Regeneration During Normal Tissue Turnover
The average life span of adult mammalian hepatocyte has been estimated to be around 200–300 days. One of the models regarding the mechanism of normal liver turnover is termed as “streaming liver”. Ponder (1996) suggested that the normal turnover in adult animals was proceeded primarily by in situ cell division of hepatocyte and not by stem cells. According to this model, young hepatocytes
emerge in portal zone and migrate toward central vein. In parallel to this model, differential gene expression patterns were seen in different zones of liver and this was explained by aging during the migration representing typical lineage progression. Moreover, ploidy and size of hepatocytes depend on the location within the lobule (Zajicek et al, 1985; Arber et al, 1988). However, there were other studies opposing “streaming liver” hypothesis. In 1985, Thurman and Kauffman showed that the difference in gene expression was due to the direction of blood flow. Thus, lobular zonation seems to depend on metabolite-induced gene regulation rather than lineage progression. Besides, hepatocyte migration during normal hepatocyte turnover was also opposed by retroviral marking studies (Bralet et al, 1994; Kennedy
et al, 1995). These results were later confirmed in studies of hepatocyte growth
pattern analysis in mosaic pattern of X inactivation in female mice (Shiojiri et al, 1997, 2000).
1.1.2. Hepatocyte-Driven Regeneration After Partial Hepatectomy
Higgins and Anderson (1931) introduced the best experimental model with a precisely defined initiation of the regenerative stimulus, partial hepatectomy (PH), for the study of liver regeneration in response to liver injury. In partial hepatectomy, two-thirds of the liver is removed. Specific liver lobes are removed intact, without damage to the lobes left behind. Although the resected lobes never grow back, the residual lobes enlarge to compensate for the mass of the removed lobes in one week (Fausto et al, 2006).
The difference of liver regeneration from other regenerating tissues (bone marrow, skin) is that regeneration is not dependent on a small group of progenitor or stem cells except the case of large number of hepatocyte loss (see section 1.1.3). In order to rebuild the lost hepatic tissue, all the existing mature cellular populations in intact organ proceed liver regeneration by proliferating after PH. These include hepatocytes (the main functional cells of the organ), biliary epithelial cells (lining biliary ducts), fenestrated endothelial cells [a unique type of endothelial cells with large cytoplasmic gaps (fenestrae) that allow maximal contact between circulating blood and hepatocytes], Kupffer cells (macrophages in hepatic sinusoids) and cells of
Ito (satellite cells unique to the liver and located under the sinusoids; which surround hepatocytes with long processes, store vitamin A, synthesize connective tissue proteins, and secrete several growth factors ) (Michalopolus and DeFrances, 1997).
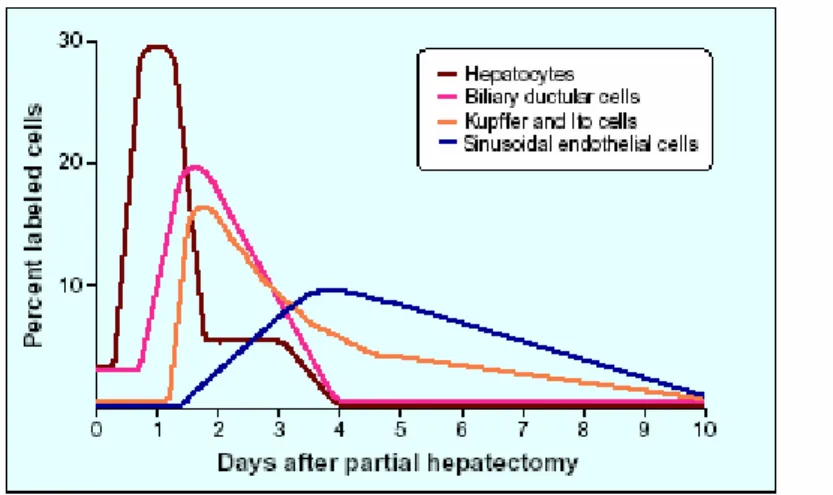
Hepatocytes are the first to proliferate with a peak of DNA synthesis at around 24 hours (Figure 1.1.). The other cells of the liver enter into DNA synthesis about 24 hours after the hepatocytes and peak at 48 hours or later. After two to three days during PH, all cellular elements of the liver proliferate. Liver histology at day three to four after PH is characterized by clumps of small hepatocytes surrounding capillaries (Martinez-Hernandez and Amenta, 1995). By day 7, original number of cells is restored and hepatic histology consists of lobules that are larger in size prior to regeneration (Ogawa et al, 1979; Michalopolus and DeFrances, 1997).
Figure 1.1. Time kinetics of DNA synthesis in different liver cell types during liver regeneration after partial hepatectomy.
1.1.2.1. Mitogenic Signals Associated With Initiation of Liver Regeneration
There are several factors affecting the induction of hepatocyte cell division. As indicated above, hepatocytes are the first cells of the liver to enter into the cell cycle and undergo proliferation, and they produce mitogenic signals for other hepatic cell types. Several studies have shown that mitogenic signals are present in the blood during liver regeneration. Initiation of liver regeneration may be attributed to that of mitogenic signals in a variety of mechanisms.
Amongst these factors, Hepatocyte growth factor (HGF) and its receptor Met-1 are key factors in liver growth and function (Naldini et al, Met-199Met-1). HGF is responsible for the early events after PH. Several studies in humans have shown that plasma concentrations of HGF rise substantially when hepatic mass is decreased and plasma concentrations of HGF rise more than 20-fold within one hour after PH in rats (Michalopoulos et a., 1984; Tomiya et al, 1992, Lindroos et al, 1991). It is thought that PH confers stored HGF to be released by remodeling extracellular matrix and releases HGF which triggers hepatocytes to re-enter cell cycle through a signal transduction pathway (Bottaro et al, 1991).
Besides HGF, there are a variety of factors associated with liver regeneration both directly and indirectly. Most important ones are TNFα, IL6, EGF and TGFα. In deficiency of IL6 and TNFα receptor 1 (TNFR1), there seems slow and incomplete response following PH (Yamada et al, 1997, 1998; Yamada and Fausto, 1998). Although TNFα is not a direct mitogen for hepatocytes, its level increases after PH. TNFα was found to enhance the mitogenic effects of direct mitogens such as HGF, both in vitro and in vivo (Webber et al, 1998). IL6 also is not a direct mitogen for hepatocytes and does not enhance the mitogenic effect of other growth factors. However, it is a direct mitogen for biliary cells (Liu et al, 1998) and has important effects on integrity of the intrahepatic biliary tree by regulating production of small proline-rich proteins by cholangiocytes (Nozaki et al, 2005; Demetris et al, 2006). IL6 increases in the plasma following PH.
Although plasma EGF concentrations rise only slightly after PH, EGF may play a mitogenic role in liver regeneration by quickly becoming more available to hepatocytes after PH.
TGFα mRNA is induced in hepatocytes within 2 - 3 hours after PH, with a peak between 12 and 24 hours, and remains elevated for at least 48 hours after PH, and its over expression is shown to drive hepatocyte replication in vivo.
Termination of liver regeneration is also as important as initiation. However, compared to initiation mechanism, termination is less understood. It is found that a small wave of apoptosis in hepatocytes occurs at the end of regeneration (Sakamoto
et al, 1999). Some studies suggest TGFβ as a potent terminating signal for liver
regeneration (Jirtle et al, 1991). No other specific candidate for termination is known at this point, though potential ones can be predicted depending on their function in physiological conditions such as tumor suppressor genes.
1.1.3. Progenitor Dependent Regeneration After Liver Injury
1.1.3.1. Hepatic Oval Cells
When there is a severe liver damage because of losing large number of hepatocyte and/or lack of their proliferation due to hepatoxins or carcinogens, liver utilizes a new source of cells to help repairing the liver. These small cells with high nucleus to cytoplasm ratio and ovoid shape are called hepatic “oval” cells. Oval cell proliferation is the result of progenitor-dependent regeneration since they are not derived from hepatocyte; rather they are associated with canals of Hering. However, the origins of oval cells are still debatable. Although most researchers tend to believe that the cells reside in the canals of Hering, it has been clearly indicated that at least a portion of the oval cells can be derived from bone marrow cells. In response to severe damage, these cells emerge in the portal zone, proliferate extensively and migrate into the lobule and eventually differentiate into hepatocytes (Farber, 1956; Shinozuka et al, 1978). These cells have the ability to proliferate-clonogenically and their bipotential capacity provides to differentiate into both hepatocytes and bile ductular cells (Oh et al, 2002). When hepatocytes do not respond to growth signals, oval cells are activated and proliferate rapidly as “facultative stem cells”. They initially appear near bile ductules and then migrate into the hepatic parenchyma. Oval cells were shown to change first into basophilic small hepatocytes and then differentiate into mature hepatocytes. There are several surface markers expressed on oval cells including hepatic markers and hematopoietic stem cell markers. Most commonly used markers are AFP, Thy-1, C-KIT, FLT3, CH18, CK19, GGT and OC2.
In order to induce progenitor-dependent regeneration, in rat liver, the combination of 2-AAF treatment with either two-thirds partial hepatectomy (PH) or LD50 dose of carbon tetrachloride can be used. The continuous administration of low dose 2-AAF suppress proliferation of hepatocytes. Thus, hepatocytes of rats can not proliferate for regeneration after PH resulting in rapid proliferation of oval cells.
1.2. Mesenchymal Stem Cells
Mesenchymal stem cells (MSCs) are adult stem cells constituting a rare population of non hematopoietic origin (0.01-0.001 % of total nucleated cells) in the adult bone marrow (Pitteger et al, 1999). They were identified during isolation of bone-forming progenitor cells from rat marrow by Friedenstein et al in 1966. They have the capacity to proliferate extensively and form colonies of fibroblastic cells which are defined as colony-forming units-fibroblastic; CFU-F (Friedenstein et al, 1970). They differentiate into multiple mesenchymal lineage including adipocytes, osteoblasts, chondrocytes and myocytes (Pitteger et al, 1999) and cardiomyoctes in
vitro (Makino et al, 1999). Besides mesenchymal lineage, it has been shown that
they can differentiate along a number of endodermal and ectodermal tissues such as neurons (Woodbury, 2000), epithelial cells in skin, lung, intestine, kidney, spleen and liver (Chapel et al, 2003). To be able to differentiate into non-mesenchymal cell lineages demonstrate their plasticity and their potential in cellular therapies in several tissue repair and regeneration processes (Baksh et al, 2004).
One of the most challenging aspects of working with MSCs is the lack of specific cell surface markers for identification and characterization. They have common characteristics with other types of cells including endothelial and epithelial cells rather than displaying non-unique antigen profile. They express a number of different adhesion-related antigens, such as integrin subunits 4, 5, 1, integrins v 3 and v 5, ICAM-1, and CD44H (Conget and Minguell, 1999). Besides these nonspecific markers, there are some widely used cell surface antigens for in vitro characterization of MSCs, such as STRO-1 in human (Gronthos et al, 1994) and
SH-2, SH-3, SH-4 (Baksh et al., 2004), CD71, CD90, CD106 and CD117 (Mangi et al, 2003) in rodents. Despite this controversy about surface markers defining “mesenchymal stem cell”, there is a general agreement that the absence of CD34, CD45, CD31, Mac1 (CD11b), CD19 and glycophorin A expression distinguishes MSCs from hematopoietic cells, endothelial cells and endothelial progenitors (Deans and Moseley, 2000).
In recent decades, MSCs received increased interest due to their intrinsic self-renewal capacity and ability to differentiate functional cell types in specific tissues. These properties provide MSC as a promising candidate for cell and gene therapies. There are several heartening therapeutical applications of MSCs including osteogenesis imperfecta (Horwitz et al, 1999), hematopoietic recovery (Koç et al., 2000), bone tissue regeneration (Pettite et al, 2000), cardiovascular repair, spinal cord injury, coronary artery disease (Minguell, 2001) and in also several organ failures such as lung fibrosis in animal models (Matty, 2008).
Besides their involvement in tissue repair and regeneration, one of the most crucial characteristics of MSCs is their immunoregulatory property (Bartholomew et
al, 2002; Inoue S. et al, 2006; Aggarwal and Pitteger, 2005). They can evade from
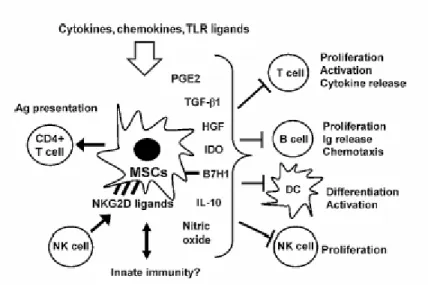
immunerecognition (Rasmusson, 2006), therefore they are ideal carriers for gene delivery. In particular, generating stable clones with high efficiency with adenovirus-mediated gene transfer make them popular in gene therapy (Baksh et al, 2004). Moreover, MSCs suppress immune responses (Rasmusson, 2006). Through multiple pathways, ex-vivo expanded MSCs have been shown to suppress a broad range of immune cells including T cells, B cells, NK cells and antigen presenting cells as shown in Figure 1.2. On the other hand, recent studies showed that MSCs have the dual ability to suppress and/or activate immune responses due to exposed stimulus (Stagg, 2007).
(Stagg, 2007) Figure 1.2. Immunemodulating effects of ex-vivo expanded MSCs.
MSCs also suppress immune responses in vivo. Acute graft-versus-host disease (GVHD) is a common complication of allogeneic hematopoietic stem cell transplantation (HSCT) in which the immunocompetent cells in the graft reacts against host-derived antigens. After transplantation, mature T cells in the graft attack recipient tissue resulting in activation of host with secretion of proinflammatory cytokines including TNF-α and IL-1. In acute GVHD, donor T cells react to host APCs by activating donor T cells in a sequential manner. Since human MSC suppress the formation of cytotoxic T cells and alter the cytokine profile and maturation of antigen presenting cells, they may be used in potential cellular therapy in GVHD (Rasmusson, 2006). However, conflicting results have been reported regarding benefits of using MSC on GVHD. Among several studies, one of the most striking one showed that intravenous injection of MSC was found to be effective therapeutically in humans (Le Blanc et al, 2004). On the other hand, MSCs were found to be suppressing lymphocytes in vitro but have no effect on GVHD in mice (Sudres et al, 2006). MSCs are also used in autoimmune diseases. Experimental autoimmune encephalomyelitis (EAE), which is the “paradigmatic” model of multiple sclerosis (MS), is an autoimmune inflammatory disease of the central nervous system mediated by T cells and macrophages. Zappia E. et al (2005)
reported that intravenous injection of murine MSCs attenuated EAE by inducing tolerance of peripheral T cell against the pathogenic antigen.
1.3. Immune System Responses
Immune system can be categorized into two distinct branches known as the “innate immunity” and the “adaptive immunity”. Adaptive immunity detects non-self through recognition of peptide antigens using antigen receptors expressed on the surface of B and T cells (Takeda et al, 2003) which is instructed by the innate immune arm. The initial immune response is mediated by the cells of the innate immunity that can recognize pathogens as well as altered self proteins expressed on host cells. One of the major and well studied receptor families of innate immunity is the toll like receptor family, which is a part of a broader group known as the pathogen recognition receptors.
1.3.1. Pathogen Recognition Receptors
Although the innate immune system lacks the fine specificity of adaptive immune system that is crucial for immunological memory, it can discriminate self from non-self. The basic machinery of innate immune recognition is highly conserved among species, from plants and fruit flies to higher mammals. Microbial pathogens possess specific molecular patterns called pathogen-associated molecular patterns (PAMPs). The host innate immune system recognizes these patterns with germ-line encoded pattern recognition receptors (PRRs) and elicits immune responses for eliminating pathogen and also activating adaptive immunity (Akira et
al, 2001).
Besides recognizing PAMPs which are crucial for survival of microorganism, there are several common characteristics of PRRs. First, they are expressed constitutively in the host. Second, PRRs are germ line encoded, nonclonal, expressed on all cells of a given type. Their expression is independent of immunologic memory. Different PRRs react with specific PAMPs and they can detect pathogens in
all stages of pathogen’s lifecycle. They show distinct expression patterns, activate specific signaling pathways, and lead to distinct anti-pathogen responses (Akira et
al., 2006).
Toll-like receptors (TLRs), which recognize a wide range of PAMPs including carbohydrates, lipids, proteins and nucleic acids, are well-known PRRs (Akira et al, 2006). Besides TLRs, there are two other important PPRs that play important roles in cytosolic recognition of invading pathogens: nucleotide binding oligomerization domain (NOD)-like receptors (NLRs) which have role in TLR-independent activation of several signaling pathways and retinoic acid-inducible gene I (RIG-I)-like helicases (RLHs) which have role in antiviral responses (Kawai and Akira, 2006). I would like to focus only on TLRs for the scope of my thesis work.
1.3.2. TLRs as Pattern-Recognition Receptors
TLRs are type I integral membrane glycoproteins that are characterized by the extracellular domains containing varying numbers of leucine-rich-repeat (LRR) motifs and a cytosolic signaling domain called the Toll/IL1R (interleukin 1 receptor) homology (TIR) domain which is homologous to the cytoplasmic signaling domain of IL-1 (Bowie and O’Neil, 2000). Toll, a receptor playing critical role in development of embryonic dorsoventral polarity and also antifungal response in
Drosophila, is the first identified member of TLR family (Lemaitre et al, 1996).
TLRs are also characterized by their evolutionary conservation from Caenorhabditis
elegans to mammals (Roach et al, 2005; Akira et al, 2006).To date, 13 murine TLRs
and 10 human TLRs have been identified (Kumagai et al, 2008). They have different ligand specificities and they presumably induce different target genes by same or different signaling pathways.
TLRs are expressed not only on various immune cells such as macrophages, dendritic cells (DCs), B cells, specific types of T cells but also on nonimmune cells including fibroblasts and epithelial cells (Kumagai et al, 2008). In addition, murine
MSCs have been shown recently to express several TLR molecules (Pervsner-Fischer et al, 2007). In all cell types, expression of TLRs is modulated in response to pathogens, cytokines and environmental stress. While TLR1, 2, 4, 5 and 6 are expressed on the cell surface, TLR3, 7, 8 and 9 are found in intracellular compartments such as endosomes (Figure 1.3. and Figure 1.4.). Ligands of latter ones, mainly nucleic acids, are required to be internalized to endosomes for recognition.
1.3.2.1. TLR1, 2 and 6
One of the most extensively studied TLRs is TLR2. It recognizes a wide range of microbial components including lipoproteins/lipopeptides from various pathogens, peptidoglycan (PGN) and lipoteichoic acid (LTA) from Gram-positive bacteria, lipoarabinomannan from mycobacteria, glycosylphosphatidylinositol anchors from Trypanosoma cruzi, a phenol-soluble modulin from Staphylococcus
epidermis, zymosan from fungi and glycolipids from Treponema maltophilum
(Takeda et al., 2003), LPS (lipoploysaccharide) preparation from non-enterobacteria such as Helicobacter pylori (Smith et al, 2003).
Although there is no certainty about mechanism of the wide spectrum of TLR2 recognition, it is thought that functional cooperation of TLR2 with several proteins accomplishes this task. For recognition of lipopeptide, TLR2 functions by forming heterodimers with structurally related TLRs such as TLR1 or TLR6. Forming heterodimers with either TLR6 or TLR1 may provide the recognition of diacyl or triacyl lipopeptides, respectively. This discrimination may be attributed to LRR domain topology, which is a unique property of TLR2 (Takeuchi et al, 2001; Takeuchi et al, 2002; Omueti et al, 2005). For recognition of fungal-derived components, TLR2 functions with members of the lectin receptor family, which may facilitate its activation by β-Glucan ligands (Gantner et al., 2003). In particular, C-type lectin, Dectin-1, with ITAM motif in its intracellular domain, was found to interact with TLR2 to recognize yeast pathogens (Brown et al, 2003).
The expression and activity of TLR2 was shown to be cooperatively regulated by pro-inflammatory molecules such as TNFα and anti-inflammatory molecules such as glucocorticoids (Hermoso et al, 2004).
1.3.2.2. TLR3
TLR3 is also an important PRR in the host defense against viral infection. In life cycle of most viruses (in replication), double-stranded RNA (dsRNA) is produced and triggers antiviral and immunostimulatory activities by inducing synthesis of type I interferon (IFNα/β). It was found that expression of human TLR3 in the dsRNA-non-responsive cell line 293 elicits activation of NF-κB in response to dsRNA. Moreover, TLR3 deficient mouse was found to lack antiviral activity in response to dsRNA (Alexopoulou et al, 2001). These showed that TLR3 has a major role in the recognition of dsRNA (Takeda et al, 2005). TLR3 is known to be expressed by dendritic cells (DCs), macrophages, and epithelial cells. Moreover NK cells were found to respond to polyriboinosinic polyribocytidylic acid (polyI: C; synthetic dsRNA) through production of proinflammatory cytokines, including IL6 and IL-8, as well as the antiviral cytokine IFN-γ (Schmidt, 2004).
1.3.2.3. TLR4
In last decade, importance of TLR4 in LPS (major component of the outer membrane of Gram-negative bacteria) recognition was demonstrated with the studies showing that TLR4 point mutation causes LPS hyposensitivity in mice (Poltorak et
al, 1998; Hoshino et al, 1999). Similar to TLR2, TLR4 respond not only to LPS but
also other molecules such as taxol derived from Taxus brevifolia (Kawasaki et al, 2000) and respiratory syncytial virus fusion protein (Kurt-Jones et al, 2000). In addition, TLR4 has been shown to be activated by very high concentrations of endogenous ligands, such as heat shock proteins (HSP60 and HSP70), extra domain A of fibronectin, oligosaccharides of hyaluronic acid, heparan sulfate and fibrinogen (Takeda and Akira, 2005).
LPS recognition by TLR4 requires several accessory molecules. LPS-binding protein (LBP) is a serum protein to which LPS is bound. It transfers LPS monomers to CD14 (Wright, 1989). CD14 which can be either secreted to serum or expressed as membrane-associated glycosylphosphatidyl inositol-linked protein at the surface of cells (especially in peripheral blood monocytes and macrophages) is a co-receptor of TLR4. After binding to CD14, LPS comes in close proximity with TLR4. Besides, MD-2 is another component of receptor complex (Shimazu, 1999).
1.3.2.4. TLR5
TLR5 recognizes flagellin subunits of flagellum, which is a complex structure required for bacterial motility (Smith et al, 2003). These flagellin subunits induce inflammatory mediators, such as TNFα and IL-8 in epithelial cells (Eaves-pyles et al, 2001). Moreover, it was found that flagellin signaling is abrogated by the TLR5 allele polymorphism 392STOP and it has been associated with Legionella
pneumophila pneumonia (Hawn et al, 2003). 1.3.2.5. TLR7, TLR8
TLR7 and TLR8 are structurally highly conserved proteins, and recognize same ligands in some cases. Both TLRs are expressed in mice but mouse TLR8 appears to be non functional (Akira et al, 2006). TLR7 is highly expressed in plasmacytoid dendritic cells. These cells produce IFN type I (α/β IFN) in response to viral infection. TLR7 and TLR8 recognize viral and nonviral single stranded RNA (ssRNA) and activate cytokine production through interferon regulatory pathway; IRF3 and IRF7 (Kawai et al, 2004; Ito et al, 2005). TLR7 and human TLR8 was found to recognize guanidine- or uridine-rich ssRNA from viruses including human immunodeficiency virus (Heil et al, 2004), vesicular stomatitis and influenza virus (Lund et al., 2004; Diebold et al, 2004). Moreover, imidazoquinoline (R848), which is crucial in treatment of genital warts, is also recognized by human TLR7 and TLR8 (Hemmi et al, 2002).
1.3.2.6. TLR9
CpG dinucleotides have recently gained attention because of their immunostimulatory properties. Although bacterial DNA contains several unmethylated CpG motifs, the frequency of CpG motifs decreases significantly in vertebrates. In addition to reduction in terms of quantity, cystein residues of CpG motifs are highly methylated in vertebrate. Methylation in vertebrates leads impairment of immunostimulatory effect of CpG (Krieg et al, 1995). TLR9 was found to be responsible for unmethylated CpG recognition in TLR9-deficient mice studies (Hemmi et al, 2000). It is primarily expressed on B cells, NK cells and DCs in the course of proliferation, maturation and cytokine, chemokine of immunoglobulin (Ig) secretion (Krieg, 2000). There are at least two types of CpG DNA which differentially activate plasmacytoid dendritic cells (pDC) versus B cells. First identified, conventional CpG is B/K- type CpG. It is made up of phosphorothioate backbone and it has more than one CpG motifs on a single backbone with no poly (G) tail. The other one, A/D- type CpG, is structurally different from conventional CpG in terms of having phosphodiester/phosphorothioate mixed backbone. It has a single palindromic sequence outside the CpG motif linked to a poly (G) tail at the 3’ and 5’ ends. B/K- type CpG can induce inflammatory cytokines including IL12 and TNFα and B cell proliferation. On the other hand, A/D-type CpG induce IFNα from pDC, but it has less ability to induce IL-12 and fails to stimulate B cells (Gursel et al, 2002; Verthelyi et al, 2001). Although TLR9 has found to be essential for recognition of both types of CpG (Hemmi, 2003), difference of these CpG-ODNs in terms of cellular specificity and functional effects are still under question. However, CXCL16, a co-receptor expressed on human pDC but not B cells, can be possible explanation for these differences since it selectively recognizes and mediates the subcellular localization of D ODN (Gursel et al, 2006). Besides bacterial CpG, virus-derived CpG, such as murine cytomegalovirus in PDC has been found to be recognized by TLR9 (Krug et al, 2004). Moreover, TLR9 appears to be involved in the pathogenesis of autoimmune disorders, such as systemic lupus erythematosus through chromatin structure recognition (Takeda and Akira, 2005).
1.3.2.7. TLR Signaling
Expressions of several genes that are involved in immune response are triggered by stimulation of TLRs by microbial components. Molecular mechanisms underlying induction of these genes through TLR signaling pathways are now being rapidly elucidated (Akira and Takeda, 2004). Microbial recognition of TLRs facilitates dimerization of TLRs either homo-or heterodimers similar to TLR2-TLR1 or TLR2-TLR6 heterodimers (Saito, 2004). TLR dimerization triggers activation of signaling pathway through their cytoplasmic TIR domain. A TIR domain-containing adaptor protein, particularly, MyD88, associates with TIR domain of receptor and provide induction of several pro-inflammatory cytokines such as TNFα and IL12 (Hemmi et al, 2002; Takeuchi et al, 2000). Activation of different TLRs leads to different pattern of gene expression through individual TLR signaling cascades, although MyD88 is common to all. However, there are also MyD88 independent pathways as well as MyD88 dependent pathways.
1.3.2.7.1. MyD88 Dependent Pathways
In almost all TLR signaling pathways, there is an adaptor molecule forming a complex with TIR domain to initiate signaling events. MyD88 functions as such for innate response activation. It has been shown that MyD88-deficient mice do not produce inflammatory cytokines including TNF-α and IL12p40 in response to all TLR ligands (Takeuchi et al, 2000; Kawai et al, 1999; Schnare et al, 2000). Therefore, MyD88 is essential for inflammatory cytokine production through all TLRs.
MyD88 has a TIR domain, through which it associates with TLRs, on its C- terminal portion between residues 155-296 (Hultmark, 1994). Besides, it has a death domain (DD) in its N-terminal that confers association with other DD-containing proteins (Boldin et al, 1995). This domain is found to be important for TLR-induced cell death (Aliprantis et al, 1999). MyD88 has also an intermediate domain (ID) that
is essential for TLR signaling in terms of interacting with IL1R associated kinases (IRAKs) (Arancibia et al, 2007).
Upon stimulation (Figure 1.3. and Figure 1.4.), MyD88 recruits IRAK4 to TLRs through interaction between their DD and this facilitates IRAK-4 mediated phosphorylation of IRAK-1. Activated IRAK1 associates with TRAF6 leading to activation of two distinct signaling pathways. In the first one, AP-1 transcription factors are activated through activation of MAP kinases. In the second one, TAK/TAB complex, which enhances the activity of IκB kinase (IKK) complex, is activated. Then the IKK complex induces phosphorylation and subsequent degradation of IκB leading to nuclear localization of transcription factor NF-κB (Takeda and Akira, 2005)
1.3.2.7.2. MyD88 Independent Pathways
In MyD88-deficient macrophages, despite the lack of TLR-4 induced production of proinflammatory cytokines, NF-κB activation is seen with delayed kinetics (Kawai, 1999). This indicates that although proinflammatory cytokine production is completely MyD-88 dependent, but yet there is a MyD88 independent component leading to the activation of NF-κB in TLR4 signaling. Furthermore later it has been shown that transcription factor IRF-3 is also activated in response to TLR4 stimulation in a MyD88-independent manner (Kawai, 2001). TLR4-induced activation of IRF3 leads IFN-β production which activates Stat1 and results in the induction of several IFN-inducible genes (Toshchakov et al, 2002; Hoshino et al., 2002; Doyle et al, 2002). Viral infection or dsRNA was also found to activate IRF-3 (Yoneyama et al, 1998). Thus, TLR3 and TLR4 utilize the MyD88-independent pathways to induce IFN- β (Figure 1.3. and Figure 1.4.). TLR3 and TLR4 expressed on APCs require the TIR-domain containing adaptor inducing IFN- β (TRIF) protein for the induction of NF-κB activation (Brint et al, 2002).
TLR4 activation by LPS may induce the expression of the TRIF-related adaptor molecule (TRAM/TICAM-2) and TRAM binds to both TLR4 and TRIF.
TLR4 utilizes TRIF and TRAM independently of other adaptor molecules, such as MyD88, to initiate late phase of NF-κB activation. It also induces the expression of IFN-β and other IFN-inducible genes via IRF-3 (Brint et al, 2004; Oshiuma et al, 2003, Figure 1.3.). TRAM is indispensably required for bridging TRIF and TLR4 in TLR4 mediated responses. TRAM-/- mice are completely impaired in their response to LPS, while response was seen in My88 deficient mice with delayed kinetics (Horng et al, 2002; Yamamoto et al, 2002).
Arancibia et al, 2007 Figure 1. 3. TLR signaling activation by bacterial ligands
In response to TLR3 signaling activation by viral dsRNA, TRIF is recruited to the receptor and induces IFN type I through TRIF-IKK-ζ (Figure 1.4.). In addition, agonist activation of TLR3 may promote tyrosine phosphorylation leading phosphotidyl inositol 3-kinase (PI3K) recruitment, Akt activation and eventually
IRF-3 phosphorylation (Sarkar et al, 2004). TLR3 can also stimulate pro-inflammatory cytokine expression through connecting the TRIF downstream signaling molecule to activation of NF-κB (Meylan et al, 2004).
Arancibia et al, 2007 Figure 1.4. TLR signaling activation by viral PAMPs
2. AIM OF STUDY
Liver transplantation is a well accepted treatment option for end-stage liver disease and acute liver failure. However, due to the donor shortage, new therapy strategies are becoming more important than ever. Amongst them liver cell transplantation (LCT) has been receiving great attention in recent years due to the improvement on the isolation and expansion of hepatocyte and stem/progenitor cells. In this context, MSCs are also important candidates as a source of cell due to their distinctive characteristics such as hepatic differentiation potential, homing to the site of injury and nonimmunogenicity.
By using a well established liver regeneration model of partial hepatectomy in rats, we aimed to investigate the followings in this thesis;
i) The effect of liver regeneration on the homing mechanisms of MSCs. ii) Potential roles of MSCs and TLRs during liver regeneration.
iii) Role of TLRs expression on MSCs and their contribution to the
3. MATERIALS AND METHODS
3.1. Animals
Adult male Spraque Dawley rats (7-9 months old) and adult male BALB/c mice (8-12 weeks old) were used for the entire study. The animals were kept in the animal holding facility of the Department of Molecular Biology and Genetics at Bilkent University under controlled ambient conditions (22o C ± 2) with 12 hour light and 12 hour dark cycles. They were provided with unlimited access of food and water. The experimental procedures have been approved by the animal ethical committee of Bilkent University (Protocol No: Bil-AEC 2005/2).
3.2 Standard Solutions and Buffers
For details of the solutions and buffers used for several assays, please refer to Appendix A section.
3.3. Liver Regeneration Model
3.3.1. Partial Hepatectomy and Sham Operations Alone
In this study, 7-9 months old male Sprague-Dawley rats were used. Partial hepatectomy procedure was standardized by Higgins and Anderson (1931).
3.3.2. Partial Hepatectomy Operation
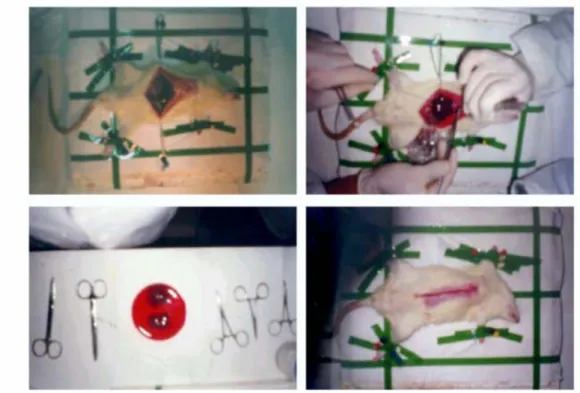
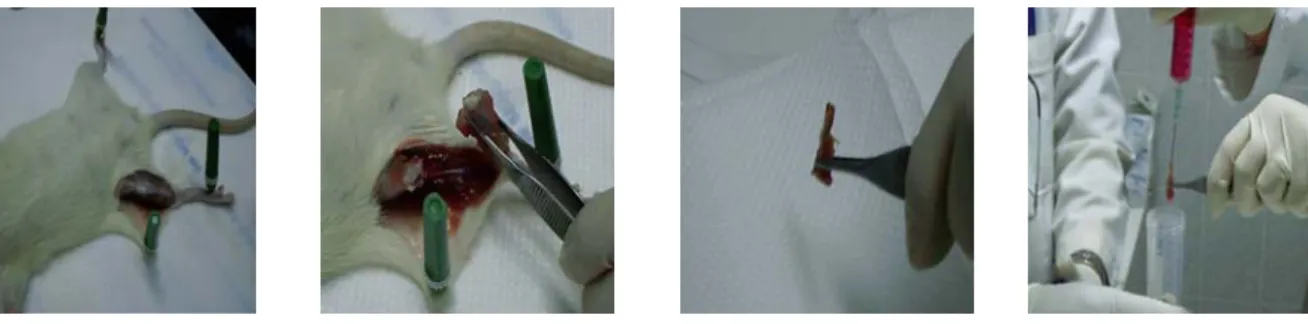
The rats were pre-anesthetized firstly with ether chamber and then anesthetized with ketalar (2, 5-2, 8 mL/g) by intraperitonal injection. They were immobilized on the operation stand. Under aseptic conditions, the skin was cut and the abdomen was opened by cutting the peritoneal membrane through the midline (in Figure 3. 1.).
Figure 3.1. The steps of the liver resection surgery for partial hepatectomy (PH) After opening of the abdomen, ligaments connecting liver to diaphragm and connecting the lobes of the liver was cut. The middle lobe (40% of total liver mass) and the front lobe (30% of total liver mass) were removed after the branches of vena cava inferior entering these lobes was tied with silk suture. The removed lobes were immediately washed with PBS and snap frozen in liquid nitrogen for further storage. The specimens (approximately 70% of the original liver) were stored in -80 oC until further use.
After removing the lobes, 10 mL of NaCl is injected into abdominal cavity to compensate dehydration. Then, the abdomen was sutured, and left in cages (one animal per cage); the cages were warmed and watched until the animals were conscious again.
For mRNA expression experiments, the animals (2 per time points) were sacrificed 2, 4, 12, 18, 24 hours after PH. Their livers were removed and washed
with PBS and were snap frozen in liquid nitrogen. The specimens were stored in -80
oC for further use.
3.3.3. Sham Operations
The surgical operations in sham group of rats were performed similar to PH operations (for details see Section 3.3.2.), but the exception in the procedure was that the livers of these animals (2 animals per time point as specified in previous section) were not removed.
3.4. Cell Culture
3.4.1. Cell Number Count With Thoma Cell Counter
After the heterogeneous bone marrow cells was washed and precipitated, they were suspended in 10 mL of MesenCult® (StemCell Technologies) media and the mixture was micropipetted into a hemocytometer.
The total number of cells in the chamber was determined by counting the cells under the light microscope from the four gridlines. The cell number was calculated according to the following formula:
Cell Number 106 = Total cell number in 10 mL media 4
3.4.2. Spleen Cell Preparation
Spleens were removed from the BALB/c male mice after cervical dislocation. In order to obtain single cell suspensions, the spleens were smashed with the back of a sterile syringe by circular movements and suspended in 2% FBS supplemented regular RPMI media. The cells were washed 3 times with media at 1500 rpm for 10 minutes. After removal of the cell debris, the cell pellet was gently dislodged with fresh media. The splenocyte suspension was counted as indicated in section 3.4.1.
3.4.3. Cell Distribution
For MSC and splenocyte interaction assays splenocytes were distributed into 96 well plates with a final cell number of 105 cells per well. Then MSCs were titrated on the splenocytes with a ratio of 1:1 to 1: 105 (MSC to splenocyte) in triplicate. Splenocyte alone (105cells per well) and MSC alone (105 cells per well) sets were also layered in triplicates as separate groups.
After magnetic bead separation cells, CD34- and CD34+ cells were distributed into 96 well plates with a final cell number of 105 cells per well. Stimulations were done in triple wells.
For TLR mediated morphological changes of mouse mesenchymal stem cells, the cell number was adjusted to 106 cells/well in 6 well plates. The ligands were replenished every three days for the duration of assay.
3.4.4. Stimulation With Different Toll like Receptor Ligands
Co-cultured splenocytes and MSCs were stimulated with TLR ligands (i) PGN (TLR2L or TLR2/6L); 5µg/mL, (ii) pI:C (TLR3L); 20µg/mL, (iii) LPS (TLR4L); 5µg/mL, (iv) R848 (TLR7/8L); 5µg/mL, (v) CpG DNA (TLR9L) ODN1555 a 15 mer ODN or ODN K23 a 12 mer ODN) ; 1µM, and (vi) Control ODNs (ODN1612 or ODN K23CGflip ODN); 1µM. Supernatants were collected 36 to 42 hours after stimulation.
CD34- and CD34+ cells were also stimulated with above indicated TLR ligands with different concentrations ((i) PGN; 1µg/mL, (ii) pI: C; 10µg/mL, (iii) LPS; 10µg/mL, (iv) CpG ODN1555; 1µM, and (v) Control ODN1612; 1µM). Supernatants were collected 5 days after stimulation. For TLR mediated morphological changes, mesenchymal stem cells were stimulated with TLR ligands
for 12 days (in every 3rd day the ligands were replenished). Similar concentrations were used as for CD34 cells.
Cells were cultured with 5% oligo FBS supplemented RPMI 1640 or DMEM media when they were stimulated with ODNs or dsRNA and were cultured with 5% regular FBS supplemented RPMI-1640 or DMEM when they were stimulated with other ligands.
3.5. RNA Isolation and Quantification
3.5.1. Total RNA Isolation From The Liver Tissues
All solutions and materials were prepared/treated with diethylpyrocarbonate (DEPC, Sigma) in order to avoid RNase contamination. Throughout the isolation process the centrifugations were conducted at 4oC. The total RNAs were isolated by using TriPure solution (Roche/Boehringer Mannheim, Indiana, USA) according to the manufacturer’s protocol. 100 mg of tissue sample was homogenized in 1 mL of TriPure solution by using the homogenizer. Then the homogenate was incubated for 5 minutes at room temperature (RT), and allowed complete dissociation of the nucleoprotein complexes. Afterwards, 0.2 mL of chloroform was added and the tube was shaken vigorously for 15 seconds. After incubation at RT for 15 minutes, the tube was centrifuged at 12000Xg for 15 minutes resulting in three distinct phases. The colorless upper part was transferred to a new eppendorf and 1mL isopropanol was added on the sample and immediately mixed gently by inverting the tube few times and left at RT for 10 minutes. After centrifugation at 12000Xg for 10 minutes the supernatant was discarded. The pellet was washed with 75% ethanol, and then centrifuged at 12000Xg for 5 minutes. The supernatant was discarded and pellet was air-dried on bench for about 10-15 minutes. The RNA pellets were resuspended in 100 µl of the DEPC-treated ddH2O.
3.5.2. Total RNA Isolation From Murine Splenocytes and Mesenchymal Stem Cells
The total RNAs form murine mesenchymal stem cells (for details, please see Section 3.10.) and murine splenocytes were isolated using TriZol® reagent (Invitrogen, USA) according to the manufacturer’s protocol. Adherent fraction of mouse MSCs were pooled (centrifuged at 1500 rpm for 5 minutes) following trypsinazation. Low Glucose DMEM (supplemented with 10 % FBS) was added to the trypsinized cells during centrifugation and the media was removed. The cell pellet was washed once with PBS and centrifuged again at the same setting. The cells were counted on hemocytometer. Afterwards, 1 mL of TriZol® was added onto per 107 cells and dislodged by 10-15 times successive mild pipetting. After incubating the cells in TriZol® for 15 minutes at RT, 0.2 mL of chloroform/mL of TriZol® was added to the cells and vigorously shaken for 15 seconds. The mixture was incubated for 5 minutes at RT and centrifuged at 1200Xg for 15 minutes at 4oC. Following centrifugation, the upper aqueous transparent fraction which contains total RNA was transferred into a new tube and 0.5 mL of isopropanol per 1 mL of TriZol® reagent was added and the tube was incubated for another 10 minutes at RT, the samples were centrifuged at 12000Xg for 10 minutes. The supernatant removed and the pellet was washed with 1 mL of 75 % ethanol per 1 mL of TriZol® reagent used. The samples were gently vortexed and centrifuged at 7500Xg for 5 minutes at 4oC. The supernatants were discarded and pellets were air-dried under laminar flow hood. The RNA pellets were resuspended in 20-30 µl of DEPC-treated water.
3.5.3. Total RNA Isolation From Rat Mesenchymal Stem Cells
On the 14th days of the cell culture, total RNAs from the MSCs were isolated. The cells were first washed with 1X PBS buffer in order to eliminate the non-adherent cells in the media. Then the cells were trypsinized and incubated at 37oC for 5 minutes. MesenCult® (StemCell Technologies) media was added to the trypsinized
cells and centrifuged at 1500 rpm for 5 minutes. Then the media was removed and the precipitated cells were washed with cold PBS buffer and centrifuged again at
1500 rpm for 5 minutes. Next, the buffer was removed and the total RNA was isolated from the precipitate by using RNeasy Mini Kit (Qiagen, Germany) according to the manufacturer’s protocol. The RNA isolated from several sources was stored at -80oC for further use.
3.5.4. Quantification of RNA
The concentrations of RNA samples were measured via NanoDrop® ND-1000 (Nano Drop Technologies, USA) and the quality of RNAs was determined by measuring the ratio of A260/A280. The OD260/OD280 ratios were calculated in order to
determine if there is a phenol, protein or DNA contamination in the RNA samples. The acceptable ratio was expected to be from 1.6 to 2.0. In order to check the integrity of the isolated RNAs denaturing agarose gel electrophoresis was performed.
3.5.4.1. Denaturing Gel Electrophoresis
In order to check the integrity of the isolated RNA denaturing agarose gel electrophoresis was performed for all samples. 1.2 % denaturing agarose gel was prepared with DEPC-treated water, including 10X MOPS, 3.6 % formaldehyde and 30 ng/mL ethidium bromide solution. The electrophoresis tank contained 1X MOPS during running the gels. The samples were prepared by addition of 2 µl agarose gel loading dye, 3 µl RNA and 3 µl DEPC-treated H2O. The samples were incubated at
65ºC for 15 minutes in order to allow RNA denaturation. The gel was run at 90V, for 45 minutes and visualized under transilluminator (Gel-Doc BIO-RAD, USA or Vilber Lourmat, France). Chemicapture (Vilber Lourmat, France) software was used to take photographs of the gels.
3.6. The cDNA Synthesis
The cDNA was synthesized from the extracted total RNA sample using a cDNA synthesis kit (Finnzymes, Finland) according to the manufacturer’s protocol. 2 µg RNA was mixed with 1.5 µl of Oligo (dT) primer and completed to a total volume of 14µl with DEPC-treated water. They were pre-denaturated at 65ºC for 5
minutes and incubated on ice for 3-5 minutes. 20 µl 2X RT buffer (includes dNTP mix and 10 mM MgCl2). Then a 4 µl M-MuLV RNase H reverse transcriptase
including RNase inhibitors were added to the mixture and incubated at 25ºC for 10 minutes, 40ºC for 45 minutes, 85ºC for 5 minutes, and on ice for 10 minutes, respectively. The cDNAs were stored at -20ºC for further use.
3.7. RT-PCR Studies
3.7.1. Conventional PCR
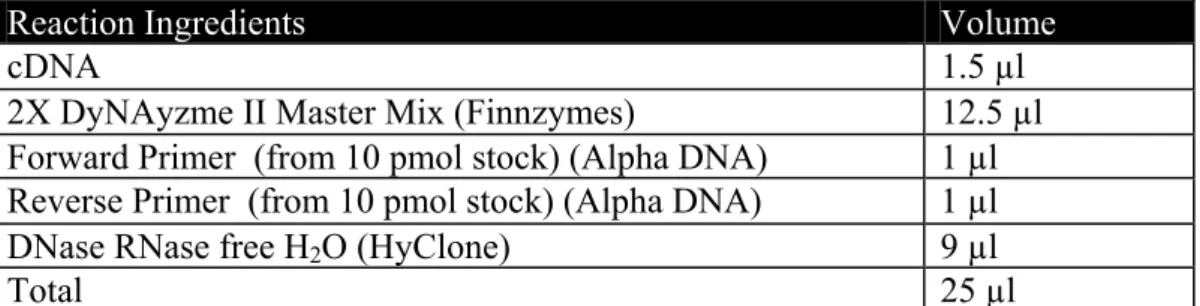
The reaction ingredients used in PCR reactions are shown in Table 3.1. and the condition of PCR reactions are shown in Table 3.2.
Table 3. 1. PCR reaction composition
Reaction Ingredients Volume
cDNA 1.5 µl
2X DyNAyzme II Master Mix (Finnzymes) 12.5 µl Forward Primer (from 10 pmol stock) (Alpha DNA) 1 µl Reverse Primer (from 10 pmol stock) (Alpha DNA) 1 µl
DNase RNase free H2O (HyClone) 9 µl
Total 25 µl
Table 3.2 PCR running conditions
30 sec @ 94oC
30 sec @ 55oC 35 cycles 1 min @ 72oC
Final Extension: 10 minutes @ 72oC
3.7.2. Agarose Gel For Visualization of PCR Products
2% agarose gel was prepared with 1X TAE buffer and 1 mg/mL ethidium bromide solution. Samples were prepared by addition of 5 µl Agarose Gel Loading dye to 10 µl of cDNA sample and loaded to the agarose gel. Agarose gel was run at
90V for 45 minutes and visualized under transilluminator (Gel-Doc BIO-RAD, USA and Vilber Lourmat, France). Chemicapture (Vilber Lourmat, France) software was used to take photographs of the gels. The low range DNA ladder (Jena Biosciences) was used as a marker and 5 µl was loaded to every gel.
3.8. The Real-Time RT-PCR Studies
The real time RT-PCR was done with DyNAmoTM HS SYBR® Green qPCR
Kit (Finnzymes, Finland) according to the manufacturer’s protocol. Rat TLR primer sequences were adopted from Hubert et al (2006) and the house keeping gene was selected to be cyclophillin (CYC) (Table 3.3). Before the real time RT-PCR, the efficiencies of the primers were tested using a standard dilution series. The reaction conditions of real-time PCR are shown in Table 3.4.
The real-time PCR reactions were carried out in iCycler™ (Bio-Rad, California, USA). After the amplification steps melting curve analysis was done.
Cyclophillin (CYC) gene was used as internal control. Samples from partial hepatectomized (PH) and sham (SH) animals obtained at different time points (please see Section 3.2) were detected in duplicates, and the readings from each sample and its internal control (CYC) were used to calculate gene expression level.
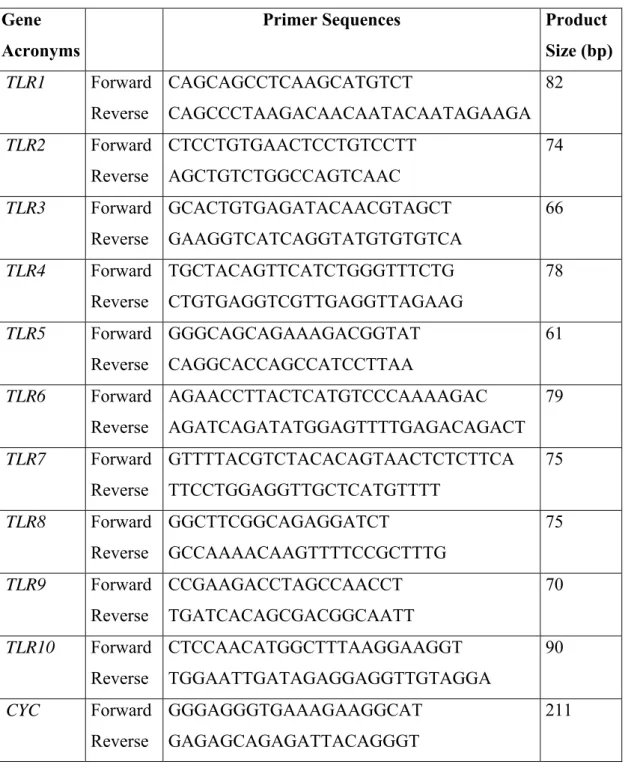
Table 3.3. The sequences and the sizes of the rat TLR primers used in this study (adopted from Hubert et al., 2006).
Gene Acronyms
Primer Sequences Product Size (bp) TLR1 Forward Reverse CAGCAGCCTCAAGCATGTCT CAGCCCTAAGACAACAATACAATAGAAGA 82 TLR2 Forward Reverse CTCCTGTGAACTCCTGTCCTT AGCTGTCTGGCCAGTCAAC 74 TLR3 Forward Reverse GCACTGTGAGATACAACGTAGCT GAAGGTCATCAGGTATGTGTGTCA 66 TLR4 Forward Reverse TGCTACAGTTCATCTGGGTTTCTG CTGTGAGGTCGTTGAGGTTAGAAG 78 TLR5 Forward Reverse GGGCAGCAGAAAGACGGTAT CAGGCACCAGCCATCCTTAA 61 TLR6 Forward Reverse AGAACCTTACTCATGTCCCAAAAGAC AGATCAGATATGGAGTTTTGAGACAGACT 79 TLR7 Forward Reverse GTTTTACGTCTACACAGTAACTCTCTTCA TTCCTGGAGGTTGCTCATGTTTT 75 TLR8 Forward Reverse GGCTTCGGCAGAGGATCT GCCAAAACAAGTTTTCCGCTTTG 75 TLR9 Forward Reverse CCGAAGACCTAGCCAACCT TGATCACAGCGACGGCAATT 70 TLR10 Forward Reverse CTCCAACATGGCTTTAAGGAAGGT TGGAATTGATAGAGGAGGTTGTAGGA 90 CYC Forward Reverse GGGAGGGTGAAAGAAGGCAT GAGAGCAGAGATTACAGGGT 211
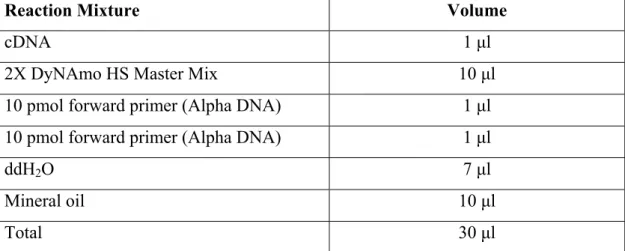
Table 3.4. Reaction composition for real time PCR
Reaction Mixture Volume
cDNA 1 µl
2X DyNAmo HS Master Mix 10 µl
10 pmol forward primer (Alpha DNA) 1 µl 10 pmol forward primer (Alpha DNA) 1 µl
ddH2O 7 µl
Mineral oil 10 µl
Total 30 µl
3.9. Administration of CM-DiI Labeled Mesenchymal Stem Cells to Partially Hepatectomized Rats
3.9.1. Chloromethylbenzamido-1,1–dioctadecyl-3,3,3’,3’-Tetramethylindocarbo- cyanine Perchlorate (CM-DiI) Labeling
A stock solution of 2 mg/mL Chloromethylbenzamido-1, 1–dioctadecyl- 3,3,3’,3’-tetramethylindocarbocyanine perchlorate (CM-DiI, Molecular Probes, USA) was prepared in dimethyl sulfoxide (DMSO) and stored at -20°C. 2x10⁶ of cells isolated form normal, one day and three days after PH were stained with CM-DiI at a concentration of 5 µg/mL in 1X PBS. The flasks were first incubated for 5 minutes at 37°C and further for 15 minutes at 4°C. After washing twice with PBS, MesenCult was added to the flasks. The cells were left in the CO2 incubator for
further use.
3.9.2. Preparation of Labeled Mesenchymal Stem Cells For in vivo Injection
Four days after CM-DiI labeling, the cells were taken form flasks by trypsinization. The cells were first washed with PBS buffer in order to eliminate the non-adherent cells in the media. Then the cells were trypsinized and incubated at 37oC for 5 minutes. Low Glucose DMEM (with 10% FBS) was added to the