Full Terms & Conditions of access and use can be found at
https://www.tandfonline.com/action/journalInformation?journalCode=lmsb20
Journal of Macromolecular Science, Part B
ISSN: 0022-2348 (Print) 1525-609X (Online) Journal homepage: https://www.tandfonline.com/loi/lmsb20
Critical Exponents of Kappa Carrageenan in the
Coil-Helix and Helix-Coil Hysteresis Loops
Özlem Tari , Selim Kara & Önder Pekcan
To cite this article: Özlem Tari , Selim Kara & Önder Pekcan (2009) Critical Exponents of Kappa Carrageenan in the Coil-Helix and Helix-Coil Hysteresis Loops, Journal of Macromolecular Science, Part B, 48:4, 812-822, DOI: 10.1080/00222340902956129
To link to this article: https://doi.org/10.1080/00222340902956129
Published online: 22 Jul 2009.
Submit your article to this journal
Article views: 76
View related articles
ISSN: 0022-2348 print / 1525-609X online DOI: 10.1080/00222340902956129
Critical Exponents of Kappa Carrageenan
in the Coil-Helix and Helix-Coil Hysteresis Loops
¨
OZLEM TARI,
1SELIM KARA,
2AND ¨
ONDER PEKCAN
31Department of Physics, Istanbul Technical University, Maslak, Istanbul, Turkey 2Department of Physics, Trakya University, Edirne, Turkey
3Kadir Has University, Cibali, Istanbul, Turkey
The steady-state fluorescence technique was used to study coil-helix (sol-gel) and helix-coil (gel-sol) transitions of the kappa carrageenan-water system with various car-rageenan contents. Fluorescence (I) and scattered light (Isc) intensities were measured
against temperature to determine critical phase transition temperatures and exponents. It was observed that the coil-helix transition temperatures, Tch were much lower than
the helix-coil (Thc) transition temperatures due to the hysteresis of the phase transition
loops. The gel fraction exponent (β) was measured and found to be in accord with the classical Flory-Stockmayer model.
Keywords carrageenan, critical exponent, fluorescence, hysteresis, transition
temper-ature
Introduction
Carrageenans are electrolytic polysaccharides containing ester sulphate groups. They are copolymers of alternating 1,4-linked α-D-galactose and 1,3-linked β-D-galactose. They are extracted from red seaweeds and come in three major types designated by means of the Greek letters κ, ι, λ. Carrageenans are used in the food, ceramic, paper, textile, and pharmaceutical industries.[1]
In κ-carrageenan gels, ionic interaction between SO4−3groups and K+ions together with intra- and interchain hydrogen bonds give rise to helical structures. κ-carrageenan assumes a random coil conformation in the sol state, and low temperature induces twisting of anhydro-galactose sequences into double helices. The gelation process of carrageenan solutions has been described by two mechanisms. In the first mechanism, crosslinks are formed by segments of the double helix. These segments are then aggregated by ions such as K+.[2]In the other mechanism, however, monohelices are formed that are subsequently
aggregated by K+ions to dimers, trimers, and so on.[3]
Gelation of κ-carrageenan has been investigated by a variety of techniques such as small-angle neutron scattering,[4]rheology,[5–7]light scattering,[5]photon transmission,[8] fluorescence,[9,10]and small-angle x-ray scattering.[11,12]The kinetics and equilibrium pro-cesses of the sol-gel transitions of agar or agarose gels as well as the effect of gelation conditions on gel’s microstructure and rheological properties have been studied in the past
Received 26 January 2009; accepted 7 February 2009.
Address correspondence to ¨Onder Pekcan, Kadir Has University, Cibali, 34320, Istanbul, Turkey. E-mail: pekcan@khas.edu.tr
few years.[13–15]It was observed that gelation of agar molecules results in a large sigmoidal increase in the magnitude of the sol’s shear modulus.[16,17]On reheating, the gel structure is destroyed and during the gel-sol transition, the shear modulus follows another sigmoidal path back to its initial value, forming a hysteresis loop.[18]The observed values of the sol-gel
and gel-sol temperatures found in those studies are 36◦C and 78◦C, respectively. It was un-derstood that the sol-gel (gelation) and gel-sol (liquefaction) temperatures can be affected by agar concentration and the thermal history of the gel. More recently, sol-gel and gel-sol hysteresis loops of κ-carrageenan-water system were studied by using photon transmission technique.[19]Time evolution of Raman and fluorescence spectra in heavy water and water
solutions of gelatin, also neutral, have been monitored during the sol-gel transition, where tyrosine residues in the peptide chains were employed as the source of fluorescence.[20]A
similar technique as described above was used to study kinetics of helix formation during gelation process of gelatin, in which the Flory-Stockmayer bond percolation model was applied.[21]Critical exponents were measured during the gelation process in gelatin-water,
gelatin-heavy water, and agarose-water systems; it was observed that these systems obeyed the percolation model.[22]
In this work, the coil-helix and helix-coil hysteresis loops of κ–carrageenan at various concentrations were studied using the fluorescence technique. Pyranine (P) (a derivative of the pyrene molecule) was introduced as a fluorescence probe. Both scattered, Isc, and
fluorescence intensities, I, were monitored against temperature. The necessary correction on the pyranine intensity due to the turbidity effect was made to produce the real phase transition curves. Coil-helix and helix-coil transition temperatures were determined for each curve of samples with various carrageenan concentrations. It was observed that Tch
and Thcvalues increased with increasing carrageenan content. The gel fraction exponents,
β, in the hysteresis loops were found to be in accord with the classical Flory-Stockmayer model during the thermal phase transitions. This theory predicts that helices and double helices should form Cayley tree structures in the gel network.
Theoretical Considerations
Several models for the sol-gel transition have been proposed; most well known are the Flory-Stockmayer theory,[23,24]and the percolation theory.[25–27]The Flory-Stockmayer theory,
which is also called the classical theory or kinetic theory, predicts one set of exponents, whereas scaling theories based on lattice percolation predict different exponents. The two groups of theories differ in their treatment of intramolecular loops, space dimensionality, and excluded volume effects. Historically, the exact solution of the sol–gel transition was given first by Flory and Stockmayer on a special lattice, called the Bethe lattice, on which closed loops were ignored. The exponents γ and β, for the weight average degree of polymerization, DPw, and the gel fraction G, both are equal to unity, independent of the
dimensionality in the Flory-Stockmayer model.
An alternative to this classical theory is the lattice percolation model, in which monomers are thought to occupy the sites of a periodic lattice.[27,28] A bond between
these lattice sites is formed randomly with probability p. At a certain bond concentration,
pc, defined as the percolation threshold, the infinite cluster is formed in the thermodynamic
limit. This is called the gel in polymer language. The polymeric system is in the sol state below the critical conversion, pc.
The predictions of the critical behavior of these two theories are different. The expo-nents γ and β for the weight average degree of polymerization, DPw, and the gel fraction
language) near the gel point, are defined as
DPw∝ (pc− p)−γ (1)
G∝ (p − pc)β (2)
where the Flory-Stockmayer theory gives β= 1 and γ = 1, independent of the dimension-ality, while the percolation studies (using series expansions or computer simulations) give
γand β around 1.80 and 0.41 in three dimensions.[27,28]
Experimental
Samples of κ-carrageenan (Sigma C-1013) at concentrations that ranged from 1% to 5% and pyranine (8-hydroxypyrene-1,3,6-trisulfonic acid trisodium salt, Fluka 56360) were prepared in distilled water by heating. These samples were named as C1, C2, C3, C4, and C5, respectively. Pyranine concentration was taken as 2× 10⁻⁴M for all samples. The heated carrageenan sol was held at 80◦C and was continuously stirred by a magnetic stirrer. Then the sol was allowed to cool to room temperature. The compositions and the symbols of the studied gels are listed in Table 1.
The fluorescence intensity measurements were carried out using a Varian Cary Eclipse Fluorescence Spectrophotometer equipped with temperature controller. Pyranine was ex-cited at 323 nm and emission was detected at 515 nm during in situ experiments. Variation in the scattered and fluorescence emission intensity of the pyranine were monitored as a function of temperature.
Coil-helix and helix-coil transitions paths were monitored in a 1× 1 × 4.5 cm3glass
cell equipped with a heat reservoir. Before measurements, the sample was melted and then cooled to ambient temperature so that the sample in the glass cell was distributed uniformly. Then the κ-carrageenan gel was reheated up to 85◦C with a scan rate of 0.72◦C/min to obtain the helix-coil transition. Cooling of the carrageenan sol from 85◦C to room temperature was then performed at the same rate to detect the coil-helix transition. Both scattered, Isc,
and fluorescence intensities, I, were monitored against temperature.
Results and Discussion
Temperature variation of Isc and I between 20◦C to 85◦C for the C3 and C4 gels are
shown in Figures 1(a) and (b) and 2(a) and (b), respectively. In both cases, Iscincreased
Table 1
The compositions, the symbols, coil-helix (Tch), and helix-coil (Thc) transition temperatures
and the critical exponent, β, for the gels
Coil-helix transition Helix-coil transition Carrageenan Gels content (wt%) Tch(◦C) β Thc(◦C) β C1 1 27.9± 0.5 0.905± 0.017 48.5± 0.5 0.948± 0.008 C2 2 36.4± 0.5 0.884± 0.019 57.8± 0.5 0.966± 0.006 C3 3 42.1± 0.5 0.859± 0.023 63.3± 0.5 0.962± 0.005 C4 4 48.2± 0.5 0.918± 0.019 69.1± 0.5 0.941± 0.007 C5 5 52.3± 0.5 0.886± 0.024 72.8± 0.5 0.948± 0.006
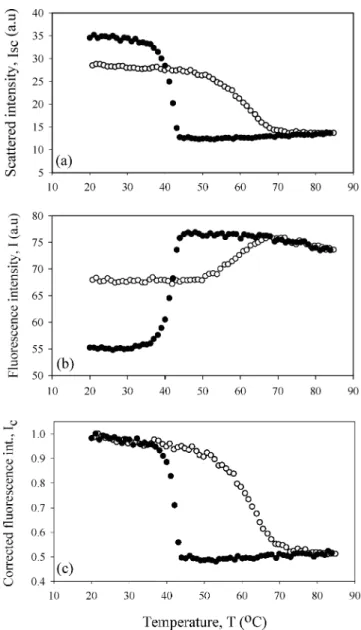
Figure 1. Temperature variation of a) scattered, b) fluorescence, c) corrected fluorescence intensities
originating from C3 sample. The heating and cooling runs are represented by open and closed circles, respectively.
upon cooling the carrageenan samples, indicating that the turbidity of the gel increased considerably [Figs. 1(a) and 2(a)]. During cooling, double helices are formed through the association of carrageenan molecules, then the double helices are aggregated to higher-ordered assemblies to create a three-dimensional network. During gelation, carrageenan-water system starts to decompose into two phases with different network concentrations, which creates concentration fluctuations. In other words, double helix aggregates formed a separate phase by excluding water from their domains. As a result, the contrast between carrageenan and water phases can scatter light. On reheating, initially the double helix aggregates are destroyed, then the double helices are decomposed to carrageenan coils and
Figure 2. Temperature variation of a) scattered, b) fluorescence, c) corrected fluorescence intensities
originating from C4 sample. The heating and cooling runs are represented by open and closed circles, respectively.
molecules, which results in the destruction of the gel structure. As the carrageenan-water system becomes homogeneous, scattered light intensity decreases.
On the other hand, the fluorescence intensity, I, presented exactly the reverse behavior compared to Isc [Figures 1(b) and 2(b)]. Here one expects to see the decrease in I at
high temperature, due to quenching of pyranine in the liquid-like medium. In order to elaborate the above results, the observed fluorescence intensity, I, has to be corrected by taking into account the behavior of the scattered light intensity to produce the real change in the fluorescence intensity. Figures 1(c) and 2(c) present the corrected fluorescence intensity, Icor, obtained from theII
k, where Ikis the intensity of the light source, and behaves
asI1
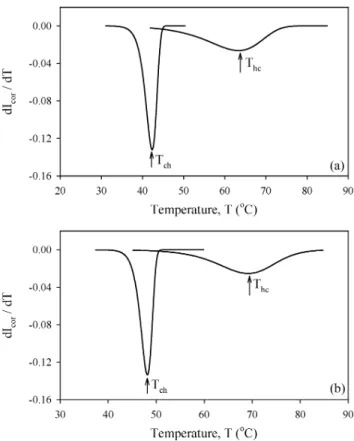
Figure 3. The first derivative of Icorversus temperature T for the samples a) C3 and b) C4. The peak
positions correspond to coil helix, Tchand helix coil, Thctransition temperatures.
obeying the expectations of fluorescence quenching in liquid medium (i.e., in a coil-rich environment). As the temperature decreased, fluorescence intensity increased due to the more solid medium formed by helices and dimers. Figures 1(c) and 2(c) present nice hysteresis loops that need to be understood.
The coil-helix and helix-coil transition temperatures (Tchand Thc) were determined
from the peak positions of the first derivative of the Icorcurves. The plots of dIdTcor versus T
for the samples C3 and C4 are shown in Figures 3(a) and (b); the transition temperatures are listed in Table 1 for all gel samples. It is known that the gelation process involves the transformation of carrageenan molecules from coil to helical conformation and the subsequent helix aggregation. Both the formation of the helices and helix aggregation occur in a narrow temperature range, resulting in a sharp dIcor
dT peak. On the other hand, melting
a helical structure occurs in a broad temperature range. Figure 4 presents the behavior of
Tchand Thctemperatures versus the carrageenan content, where the increase in carrageenan
content resulted in an increase in Tchand Thcvalues. In other words, for high carrageenan
content samples, the coil-helix and helix-coil transitions require higher temperatures. The value of Thc is higher than that of Tch, in agreement with previous optical rotation[2]and
differential scanning calorimetry (DSC)[29]results on kappa carrageenan. Lower T
chvalues
compared to Thctemperature are the origin of the hysteresis behavior during coil-helix and
helix-coil transition loops. In other words, forming helices from the coils is energetically more possible and occurs at lower temperatures; however, the disassociation of helices to coils needs more energy, thus requires higher temperatures.
Figure 4. The variation of the coil-helix (Tch) and helix-coil (Thc) transition temperatures versus
carrageenan content.
According to Stauffer, the conversion factor p determines the behavior of the gelation process, where p may depend on the temperature.[25]It can be assumed that in the critical
region, i.e., around the critical point, pc, that|p − pc| is linearly proportional to the |T − Tc|
where Tcis Tchand Thcfor coil-helix and helix-coil transitions, respectively. For T < Tc,
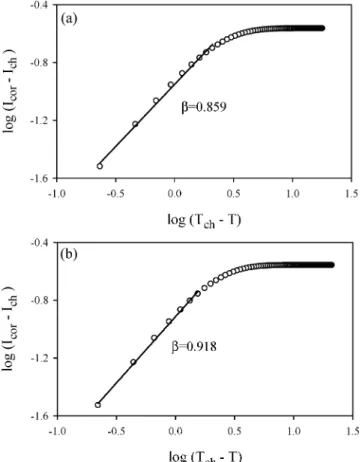
Figure 5. Double logarithmic plots of the data near the coil-helix transition for the samples a) C3
the corrected fluorescence intensity, Icor, measures the gel fraction, G, and can be written
as a power law near the coil-helix and helix-coil transitions.
|Icor− Ich| = A|T − Tch|β, T → Tch− (3)
|Icor− Ihc| = B|T − Thc|β, T → Thc− (4)
where Ichis the critical value of intensity at Tchand Ihcis the critical value of intensity at
Thc.
The double logarithmic plots of the data and their fits to Equations (3) and (4) are presented in Figures 5 and 6, respectively. The slope of the straight lines produce critical exponent β values, which are listed in Table 1. It is seen that the average β (0.922) values are very close to the value of the classical Flory-Stockmayer model. In this study, the critical region obeys the relation 10−2 <|T−Tc
Tc | < 10
−1, in agreement with the literature.[25]Since
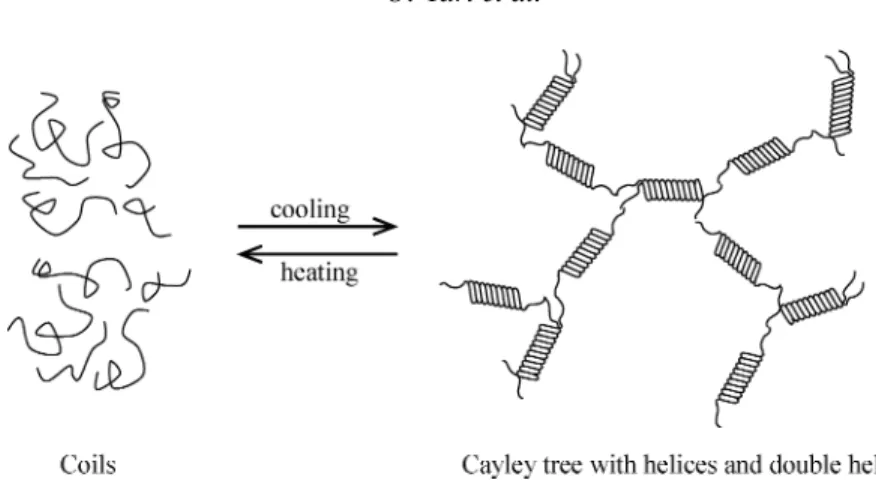
the formation of gel from helices and double helices should obey the classical Bethe lattice, the connection of helices and doubles helices must be in the Cayley tree form. In Fig-ure 7, a cartoon presentation of coil-helix and helix-coil transitions in accord with the classical approach is given in which the formation of a Cayley tree is shown.
Figure 6. Double logarithmic plots of the data near the helix-coil transition for the samples a) C3
Figure 7. Cartoon presentation of thermal phase transition accord with the classical approach where
the formation of Cayley tree is shown.
We can compare these results with the results produced in similar systems. The sol-gel transition of the polysaccharide gellan gum has been investigated by the dynamic and static light-scattering techniques.[30]The critical exponents, γ and ν, corresponding to the cluster mass and correlation length, were measured and found to be 1.66 and 0.88, respectively, which are in good agreement with the lattice percolation model. The critical exponents of the elastic modulus t and correlation length γ were measured near the sol-gel transition temperature of agarose gel, using a combination of rheolograph, differential scanning calorimetry and circular dichroism spectroscopy techniques; these were found to be 0.8 and 1.87, respectively.[31] Critical behavior of κ-carrageenan gels was studied using the
photon transmission method and the critical exponent β was found to range from 0.89 to 1.05, in accord with the classical Flory-Stockmayer theory.[32]
Conclusion
This article has shown that the gel fraction, G, for coil-helix and helix-coil transitions in carrageenan systems obeyed the classical Flory-Stockmayer model, in which the critical exponent was measured around 1.0. It is important to note that the behavior of both coil-helix and coil-helix-coil transitions are independent of the concentration of the κ-carrageenan system, i.e., the value of β does not change by raising the carrageenan content in the system. In other words, all κ-carrageenan systems under consideration were found to belong to the same universality class.
The most important finding in this article is the hysteresis behavior of the back-and-forth phase transitions, which occur at different energy regions.
References
1. Guenet, J.-M. Thermoreversible Gelation of Polymers and Biopolymers. Academic Press: New York, 1992.
2. Morris, E.R.; Rees, D.A.; Robinson, C. Cation-specific aggregation of carrageenan helices: domain model of polymer gel structure. J. Mol. Biol. 1980, 138, 349.
3. Grasdalen, H.; Smidsrod, O. Iodide specific formation of kappa carrageenan single helices-I-127 NMR spectroscopic evidence for selective site binding of iodide anions in the ordered conformation. Macromolecules 1981, 14, 1845.
4. Sugiyama, M.; Yuasa, C.; Hara, K.; Hiramatsu, N.; Nakamura, A.; Hayakawa, Y.; et al. Structural change of κ-carrageenan gel near sol-gel state transition point. Physica B 1998, 241, 999. 5. Mangione, M.R.; Giacomazza, D.; Bulone, D.; Martrana, V.; San Biagio, P.L. Thermoreversible
gelation of κ-carrageenan: relation between conformational transition and aggregation. Biophys. Chem. 2003, 104, 95.
6. Takemasa, M.; Chiba, A.; Date, M. Gelation mechanism of kappa- and iota-carrageenan inves-tigated by correlation between the strain-optical coefficient and the dynamic shear modulus. Macromolecules 2001, 34, 7427.
7. Chen, C.; Liao, M-L.; Dunstan, D.E. The rheology of K+-κ-carrageenan as a weak gel. Carbohydr. Polym. 2002, 50, 109.
8. Kara, S.; Tamerler, C.; Bermek, H.; Pekcan, ¨O. Cation effect on sol-gel and gel-sol transitions of κ-carrageenan-water system. Int. J. Bio. Macromol. 2003, 31, 177.
9. Pekcan, ¨O.; Tarı, ¨O. Universality of sol-gel phase transition of kappa-carrageenan in various salts: a steady state fluorescence study. Phase Transitions 2007, 80, 799.
10. Pekcan, ¨O.; Tarı, ¨O. Cation effect on gel-sol transition of kappa carrageenan. Polym. Bull. 2008,
60, 569.
11. Yuguchi, Y.; Thuy, T.T.T.; Urakawa, H.; Kajiwara, K. Structural characteristics of carrageenan gels: temperature and concentration dependence. Food Hydrocolloids 2002, 16, 515.
12. Yuguchi, Y.; Urakawa, H.; Kajiwara, K. Structural characteristics of carrageenan gels: various types of counter ions. Food Hydrocolloids 2003, 17, 481.
13. Kusukawa, N.; Ostrovosky, M.V.; Garner, M.M. Effect of gelation conditions on the gel structure and resolving power of agarose-based DNA sequencing gels. Electrophoresis 1999, 20, 1455. 14. Lai, V.M.F.; Huang, A.L.; Lii, C.Y. Rheological properties and phase transition of red algal
polysaccharide-starch composites. Food Hydocolloids 1999, 13, 409.
15. Norton, I.T.; Jarvis, D.A.; Foster, T.J. A molecular model for the formation and properties of fluid gels. Int. J. Biol. Macromol. 1999, 26, 255.
16. Mohammed, Z.H.; Hember, M.W.N.; Richardson, R.K.; Morris, E.R. Kinetic and equilibrium processes in the formation and melting of agarose gels. Carbohydr. Polym. 1998, 36, 15. 17. Hugerth, A.; Nilsson, S.; Sundelof, L.O. Gel-sol transition in κ-carrageenan systems:
microvis-cosity of hydrophobic microdomains, dynamic rheology and molecular conformation. Int. J. Bio. Macromol. 1999, 26, 69.
18. Lai, V.M.F.; Wong, P.A.; Lii, C.-Y. Effects of cation properties on sol-gel transition and gel properties of κ-carrageenan. J. Food Sci. 2000, 65, 1332.
19. Kara, S.; Tamerler, C.; Bermek, H.; Pekcan, ¨O. Hysteresis during sol-gel and gel-sol phase transitions of kappa carrageenan: A photon transmission study. J. Bioact. Compat. Pol. 2003, 18, 33.
20. Gadomski, W.; Ratajska-Gadomska, B.; Boniecki, M. Time evolution of the Raman and fluores-cence spectra of the D2O and H2O gelatin solutions during the sol-gel transition. J. Mol. Struc. 1999, 512, 181.
21. Ratajska-Gadomska, B. A percolation approach to dye fluorescence quenching during the gelation process. J. Phys.B-At. Mol. Opt. 1999, 32, 3463.
22. Ratajska-Gadomska, B.; Gadomski, W. Critical exponents in a percolation picture of the fluores-cence quenching during the sol-gel transition. Eur. Phys. J. B. 2000, 17, 281.
23. Flory, P.J. Molecular size distribution in three dimensional polymers. I. Gelation. J. Am. Chem. Soc. 1941, 63, 3083.
24. Stockmayer, W.H. Theory of molecular size distribution and gel formation in branched-chain polymers. J. Chem. Phys. 1943, 11, 45.
25. Stauffer, D.; Coniglio, A.; Adam, M. Gelation and critical phenomena. Adv. Polym. Sci. 1982,
44, 103.
26. Del Gado, E.; de Arcangelis, L.; Coniglio, A. A percolation dynamic approach to the sol-gel transition. J. Phys. A 1998, 31, 1901.
27. Sahimi, M. Application of Percolation Theory; Taylor and Francis: London, 1994.
29. Nishinari, K.; Watase, M. Effects of sugars and polyols on the gel sol transition of kappa carrageenan gels. Thermochim. Acta. 1992, 206, 149.
30. Okamoto, T.; Vubota, K. Sol-gel transition of polysaccharide gum. Carbohydr. Polym. 1996, 30, 149.
31. Fujii, T.; Yano, T.; Kumagai, H.; Miyauraki, O. Scaling analysis on elasticity of agarose gel near the sol-gel transition temperature. Food Hydrocolloids 2000, 14, 359.
32. ¨Ozbek, H.; Pekcan, ¨O. Critical exponents of thermal phase transitions in κ-carrageenan-water system. J. Mol. Struct. 2004, 676, 19.


