c
T ¨UB˙ITAK
Water content changes along shear planes in drained and undrained
triaxial compression tests on unsaturated cohesive soils
Hasan C¸ ET˙IN
Department of Geology, C¸ ukurova University, 01330, Adana-TURKEY
Received 05.08.1998
Abstract
Drained and undrained triaxial compression tests were run on undisturbed samples of two unsaturated cohesive soils to study water content changes in drained and undrained conditions along shear planes. The results show that while there is a noticeable water content increase away from the failure planes in the undrained tests, there seems to be an insignificant water content change in the drained tests.
Key Words: Water content, drained and undrained shear, triaxial compression tests, failure plane, unsat-urated soils, cohesive soils
Suya doygun olmayan kohezyonlu zeminlere uygulanan drenajlı ve drenajsız ¨
u¸
c
eksenli basın¸
c deneylerinde kayma d¨
uzlemi boyunca olu¸
san su i¸
ceri˘
gi de˘
gi¸
simleri
¨ Ozet
Drenajlı ve drenajsız ko¸sullarda kayma d¨uzlemi boyunca olu¸san su i¸ceri˘gi de˘gi¸simlerini incelenmek i¸cin suya doygun olmayan iki kohezyonlu zeminden alınan ¨orselenmemi¸s numuneler ¨uzerinde drenajlı ve drenajsız ¨
u¸c eksenli basın¸c deneyleri yapılmı¸stır. Sonu¸clar drenajsız deneylerde kırılma d¨uzleminden uzakla¸stık¸ca su i¸ceri˘ginin arttı˘gını g¨osterirken, drenajlı deneylerde kayma d¨uzlemi boyunca su i¸ceri˘ginin belirgin bir ¸sekilde de˘gi¸smedi˘gini g¨ostermi¸stir.
Anahtar S¨ozc¨ukler: Su i¸ceri˘gi, drenajlı ve drenajsız kesme, ¨u¸c eksenli basın¸c deneyi, yenilme d¨uzlemi, suya doygun olmayan zeminler, kohezyonlu zeminler
Introduction
Studies show that the shear strength of a cohe-sive soil generally increases as the rate of shear is increased. Casagrande and Shannon (1948a) found from undrained tests that the strength of a very soft organic clay when sheared in 1.7 minutes was 40% greater than the strength of the same clay when sheared in 7 hours. Several clays, when they failed in dynamic tests (in which only 0.02 seconds elapsed be-tween the start of shear and the attainment of
max-imum compressive stress), showed strengths 1.4 to 2.6 times those obtained with a 10-minute loading time and 1.4 to 3.2 times those obtained with a 4-hour loading time (Casagrande and Shannon, 1948b) and the same is true for direct shear tests (Lambe, 1951). Olson and Parola (1967) report a compres-sive strength increase of 18% for the range of 60 mil-liseconds to 6 milmil-liseconds for a clay compacted near optimum moisture content . Similar to Ward et al.
(1959), Simons (1965), Tchalenko (1967) and Esu and Calabresi (1969), Cetin (1997) conducted stan-dard consolidation tests using Casagrande (1936) construction method, and determined vertical and horizontal preconsolidation stresses and in turn, the failure envelopes for two unsaturated cohesive soils, namely B and C, along an active fault in Oklahoma, USA. Because the failure envelopes are above the
failure envelopes needed for slow (drained) failure of the same soils, he concluded that the faulting of these soils was probably caused by sudden or fast slip on the fault (under undrained conditions). Comparing the two failure envelopes, he reported a 40% increase in effective shear stress in the soil unit B and 70% in the soil unit C (Table 1).
Table 1. Relationship between shear strength and shear rate or failure time.
Shear Strength Failure Time Reference Increase (%)
140-260 0.02s - 10 min Casagrande and Shannon, 1948b 140-320 0.02s - 4 hr Casagrande and Shannon, 1948a 40 1.7 min - 7 hr Casagrande and Shannon, 1948b 40-70 0.1-0.3ms -2-3d Cetin, 1997
Any force will cause approximately twice as much stress and deformation when applied suddenly as when applied progressively, but because the stress conditions are complex and depend upon the prop-erties of the material as well as upon the nature of the load, truly sudden loading is very hard to secure (Roark, 1954). Most of the complexity comes from the unequalization of pore pressures throughout the specimen at failure (ASTM D 4767-88, 1993).
This increase in shear strength is because of the fact that during shear, effective stress increases as the rate of shear increases (Henkel, 1960; Kulhawy and Mayne, 1990; Mitchell, 1993) and pore water moves away from the plane of shear (Taylor, 1951; Bishop and Henkel, 1953; Crawford, 1961). For this reason, effective failure envelopes for undrained tests are above the effective failure envelopes for drained tests (Casagrande and Wilson, 1953; Hirschfeld, 1960).
Taylor (1951), Bishop and Henkel (1953) and Crawford (1961) studied water migration away from shear planes for saturated soils. But a significant portion of the earth’s surface is subjected to arid and semiarid climatic conditions, and as a result, many of the soils encountered in engineering practice are un-saturated or partially un-saturated (Fredlund and Ra-hardjo, 1993). Therefore, the aim of this study was to study water migration along shear planes under drained and undrained conditions for unsaturated or partially saturated cohesive soils.
1. Materials and Methodology
Thirty-tree triaxial and nine unconfined compression tests were performed on undisturbed samples from the two cohesive soils (Soil B and C) of Cetin (1997). The tests were run in general accordance with the American Society for Testing Materials (ASTM D 4767-88 and ASTM D 2166-91) (1993), respectively. Samples were taken according to ASTM D 1587-83 (1993) specifications. They were wrapped tightly in aluminum foil and then coated with wax, cheese-cloth, and again wax layers in the field as soon as they were extruded, to retain their natural field mois-ture contents. Some of the properties of the soils are given in Table 2.
As soon as failure was accomplished, the tests were stopped, and the samples were removed as quickly as possible from the triaxial chamber and divided into five slices parallel to the failure plane in order to measure moisture content variation between slices. When the failure was accompanied by shear along a well-defined plane, the shear plane was in-cluded in the middle slice (slice 3). In few tests, the failure occurred as bulging or barreling. Then, the middle slice was taken diagonally making a 60◦ an-gle with the base (horizontal) of the sample assuming the failure plane would occur in this zone.
In addition to these tests, to study the water con-tent in the samples after consolidation but before shearing, two samples (one from B, one from C) were consolidated under 20.59 and 41.19 kpa representing the maximum sampling depths of 2.4 and 5.5 m, re-spectively, for 24 h and then removed from the cell quickly without shearing. End slices were removed 466
and the specimens were divided into upper, middle, and lower sections. Each section was trimmed con-centrically into an outer, intermediate, and central portion. Water contents of each portion were deter-mined.
The test apparatus consisted of a triaxial cell (Model 1020), a loading frame (Model T-56-B), a pressure board (Model 1277), a pressure chamber (Model 13000), made by Wykeham Farrance and a data acquisition system.
Table 2. Properties of the soils
Soil Soil Properties B C
Depth (m) 0-2.4 0-5.5 Elevation (m) 386.0-383.6 383.6-378.1 Natural water content (%) 5.0-21.0 5.0-33.0
Liquid limit (%) 31.0 33.0 Plastic limit (%) 18.7 17.7 Shrikage limit (%) 15.5 13.8 Plasticity index (%) 12.4 15.3 Specific gravity 2.70 2.72 Grain sizes (%) Gravel 1.0 1.0 Sand 30.0 38.0 Silt 31.0 23.0 Clay 38.0 38.0
Soil type (USCS) CL CL Name Silty clay Sandy clay Preconsolidation press. (kpa) 107.88 117.68
2. Results and Discussion
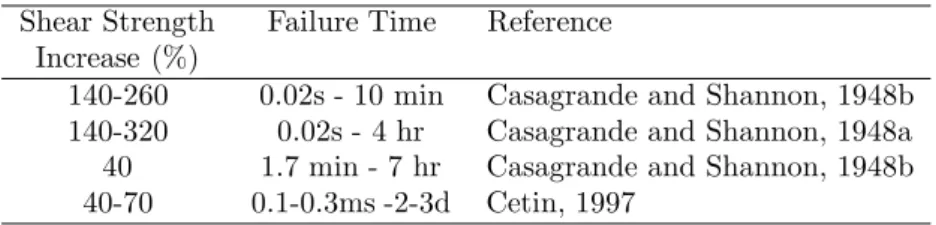
Test results are summarized in Table 3 and the av-erage variations are shown in Figures 1 and 2. The average water contents of the slices in the undrained tests were 15.27 % for soil B and 17.20 % for soil C. The average water contents of the slices enclos-ing the failure planes were 15.10 % and 16.58 %, respectively. The water contents decreased consis-tently toward the failure planes averaging 15.19 % and 15.10 %, and 17.35 % and 17.26 % at the extrem-ities to 15.10 % and 16.58 % at the failure plane, re-spectively. There was a noticeable water movement away from the failure planes during undrained tri-axial shear tests (Figure 2). The difference between the average water content for the five slices and the slice enclosing the failure plane was 0.17 % for soil B and 0.62 for soil C. Taylor (1951) and Crawford (1961) measured 1.5 % and 1.2 % variations in water content for saturated cohesive soils, respectively.
The two tests run to study water content before shear and after consolidation revealed a pattern of water content that suggests different degrees of con-solidation throughout the specimen. The tests show the outer shell to have been about 0.70-0.80 % dryer
than the central portions (Figures 2 and 3). The slice 3s from sheared specimens were from the in-ner portion of the sample, while the slices 1s and 5s came from the outer shell, and it is therefore rea-soned that slice 3 was wetter than average before shearing. Since it was dryer than average after shear-ing, this suggests an even greater movement of water during shear than is indicated by measurements on slices parallel to the failure plane. This water move-ment may have been due to stress concentration, mi-crocracks opening and increasing connectivity near the failure plane before the failure, driving the water away from it.
(b)
(a)
15.10 15.42 15.10 15.53 15.19 Undrained 1 2 3 4 5 15.89 16.09 16.16 16.30 15.98 Drained 14.92 15.39 15.56 15.56 15.54 Drained 17.26 17.20 16.58 17.60 17.35 UndrainedFigure 1.Average water contents of slices 1, 2, 3, 4, and 5 for the soils (a) B and (b) C after undrained and drained triaxial compression tests.
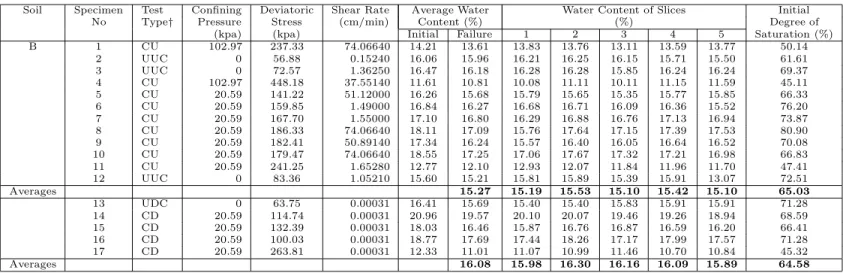
Table 3. Summary of the test results
Soil Specimen Test Confining Deviatoric Shear Rate Average Water Water Content of Slices Initial
No Type† Pressure Stress (cm/min) Content (%) (%) Degree of
(kpa) (kpa) Initial Failure 1 2 3 4 5 Saturation (%)
B 1 CU 102.97 237.33 74.06640 14.21 13.61 13.83 13.76 13.11 13.59 13.77 50.14 2 UUC 0 56.88 0.15240 16.06 15.96 16.21 16.25 16.15 15.71 15.50 61.61 3 UUC 0 72.57 1.36250 16.47 16.18 16.28 16.28 15.85 16.24 16.24 69.37 4 CU 102.97 448.18 37.55140 11.61 10.81 10.08 11.11 10.11 11.15 11.59 45.11 5 CU 20.59 141.22 51.12000 16.26 15.68 15.79 15.65 15.35 15.77 15.85 66.33 6 CU 20.59 159.85 1.49000 16.84 16.27 16.68 16.71 16.09 16.36 15.52 76.20 7 CU 20.59 167.70 1.55000 17.10 16.80 16.29 16.88 16.76 17.13 16.94 73.87 8 CU 20.59 186.33 74.06640 18.11 17.09 15.76 17.64 17.15 17.39 17.53 80.90 9 CU 20.59 182.41 50.89140 17.34 16.24 15.57 16.40 16.05 16.64 16.52 70.08 10 CU 20.59 179.47 74.06640 18.55 17.25 17.06 17.67 17.32 17.21 16.98 66.83 11 CU 20.59 241.25 1.65280 12.77 12.10 12.93 12.07 11.84 11.96 11.70 47.41 12 UUC 0 83.36 1.05210 15.60 15.21 15.81 15.89 15.39 15.91 13.07 72.51 Averages 15.27 15.19 15.53 15.10 15.42 15.10 65.03 13 UDC 0 63.75 0.00031 16.41 15.69 15.40 15.40 15.83 15.91 15.91 71.28 14 CD 20.59 114.74 0.00031 20.96 19.57 20.10 20.07 19.46 19.26 18.94 68.59 15 CD 20.59 132.39 0.00031 18.03 16.46 15.87 16.76 16.87 16.59 16.20 66.41 16 CD 20.59 100.03 0.00031 18.77 17.69 17.44 18.26 17.17 17.99 17.57 71.28 17 CD 20.59 263.81 0.00031 12.33 11.01 11.07 10.99 11.46 10.70 10.84 45.32 Averages 16.08 15.98 16.30 16.16 16.09 15.89 64.58 †Test Type: CU:Consolidated undrained CD: Consolidated drained
UUC: Unconfined undrained compression UDC: Unconfined drained compression
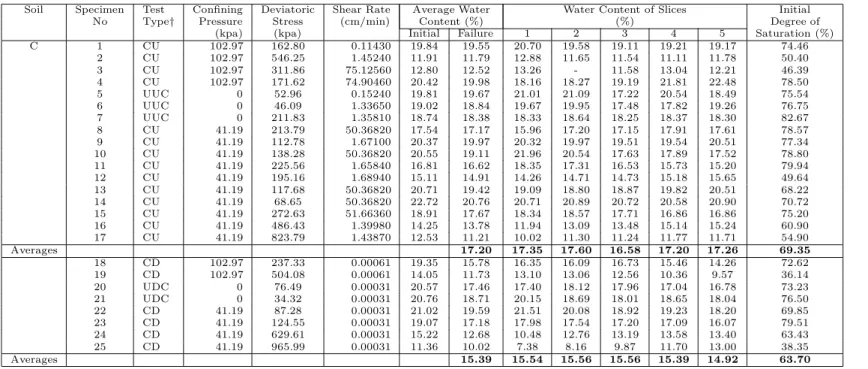
Table 3. Continued
Soil Specimen Test Confining Deviatoric Shear Rate Average Water Water Content of Slices Initial
No Type† Pressure Stress (cm/min) Content (%) (%) Degree of
(kpa) (kpa) Initial Failure 1 2 3 4 5 Saturation (%)
C 1 CU 102.97 162.80 0.11430 19.84 19.55 20.70 19.58 19.11 19.21 19.17 74.46 2 CU 102.97 546.25 1.45240 11.91 11.79 12.88 11.65 11.54 11.11 11.78 50.40 3 CU 102.97 311.86 75.12560 12.80 12.52 13.26 - 11.58 13.04 12.21 46.39 4 CU 102.97 171.62 74.90460 20.42 19.98 18.16 18.27 19.19 21.81 22.48 78.50 5 UUC 0 52.96 0.15240 19.81 19.67 21.01 21.09 17.22 20.54 18.49 75.54 6 UUC 0 46.09 1.33650 19.02 18.84 19.67 19.95 17.48 17.82 19.26 76.75 7 UUC 0 211.83 1.35810 18.74 18.38 18.33 18.64 18.25 18.37 18.30 82.67 8 CU 41.19 213.79 50.36820 17.54 17.17 15.96 17.20 17.15 17.91 17.61 78.57 9 CU 41.19 112.78 1.67100 20.37 19.97 20.32 19.97 19.51 19.54 20.51 77.34 10 CU 41.19 138.28 50.36820 20.55 19.11 21.96 20.54 17.63 17.89 17.52 78.80 11 CU 41.19 225.56 1.65840 16.81 16.62 18.35 17.31 16.53 15.73 15.20 79.94 12 CU 41.19 195.16 1.68940 15.11 14.91 14.26 14.71 14.73 15.18 15.65 49.64 13 CU 41.19 117.68 50.36820 20.71 19.42 19.09 18.80 18.87 19.82 20.51 68.22 14 CU 41.19 68.65 50.36820 22.72 20.76 20.71 20.89 20.72 20.58 20.90 70.72 15 CU 41.19 272.63 51.66360 18.91 17.67 18.34 18.57 17.71 16.86 16.86 75.20 16 CU 41.19 486.43 1.39980 14.25 13.78 11.94 13.09 13.48 15.14 15.24 60.90 17 CU 41.19 823.79 1.43870 12.53 11.21 10.02 11.30 11.24 11.77 11.71 54.90 Averages 17.20 17.35 17.60 16.58 17.20 17.26 69.35 18 CD 102.97 237.33 0.00061 19.35 15.78 16.35 16.09 16.73 15.46 14.26 72.62 19 CD 102.97 504.08 0.00061 14.05 11.73 13.10 13.06 12.56 10.36 9.57 36.14 20 UDC 0 76.49 0.00031 20.57 17.46 17.40 18.12 17.96 17.04 16.78 73.23 21 UDC 0 34.32 0.00031 20.76 18.71 20.15 18.69 18.01 18.65 18.04 76.50 22 CD 41.19 87.28 0.00031 21.02 19.59 21.51 20.08 18.92 19.23 18.20 69.85 23 CD 41.19 124.55 0.00031 19.07 17.18 17.98 17.54 17.20 17.09 16.07 79.51 24 CD 41.19 629.61 0.00031 15.22 12.68 10.48 12.76 13.19 13.58 13.40 63.43 25 CD 41.19 965.99 0.00031 11.36 10.02 7.38 8.16 9.87 11.70 13.00 38.35 Averages 15.39 15.54 15.56 15.56 15.39 14.92 63.70
There was, however, little moisture content dif-ference between the middle slice and the neighboring slices when the tests were drained (Figures 1 and 2). The average water contents of the slices enclosing the failure planes were 16.16 % and 15.56 % for soils B and C, respectively. The average water contents in the neighboring slices were 16.09 % and 16.30 %, and 15.39 % and 15.56 %, respectively. The average water contents at the extremities were 15.89 % and 15.98 %, and 14.92 % and 15.54 %. This may be be-cause during drained tests there is enough time for water to equilibrate. 15 16 17 1 2 3 4 5 W ater Content (%) Slice (a) 15 16 17 18 19 20 21 1 2 3 4 5 After Consolidation After Undrained Test After Drained Test
W
ater Content (%)
Slice (b)
Figure 2.Water content variations after consolidation and drained and undrained triaxial compres-sion tests. (a) soil B, (b) soil C.
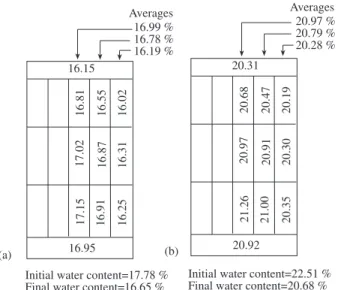
16.15 16.81 17.02 17.15 16.55 16.87 16.91 16.02 16.31 16.25 16.95 20.31 20.68 20.97 21.26 20.47 20.91 21.00 20.19 20.30 20.35 20.92 16.99 % 16.78 % 16.19 % 20.97 % 20.79 % 20.28 % Averages Averages (a) (b)
Initial water content=17.78 % Final water content=16.65 %
Initial water content=22.51 % Final water content=20.68 %
Figure 3.Water content variation after triaxial consoli-dation before shearing for the soils (a) B and (b) C.
After all undrained, drained, and the two triaxial consolidation tests, moisture contents of the upper parts of the samples were always less than the mois-ture contents of the lower parts also suggesting a downward water movement (Figures 1 and 2). 3. Conclusions
While pore water moves away from the plane of shear in unsaturated or partially saturated cohesive soils under undrained conditions there seems to be not much water movement under drained conditions. This may be one of the reasons why effective stress increases as the rate of shear increases. Also, there seems to be a downward water movement causing differences between the water contents of the upper parts and the lower parts. The water contents of the lower parts are always higher.
4. Acknowledgements
The tests for this study were run in the soil mechan-ics laboratories of both C¸ ukurova and Texas A&M Universities. Azim Yıldız helped in many of the tests here at C¸ ukurova University, Bucky L. Turk helped in many of the tests at Texas A&M Univer-sity. Lester Brown was helpful by providing unlim-ited access to his land.
References
ASTM D 1587-83. (1993). Standard practice for thin-walled tube sampling of soils. Annual book of ASTM standards, Philadelphia, PA, 04.08, 246-248.
ASTM D 2166-91. (1993). Standard test method for unconfined compressive strength of cohesive soils. An-nual book of ASTM standards, Philadelphia, PA, 04.08, 280-284.
ASTM D 4767-88. (1993). Standard test method for consolidated-undrained triaxial compression test on cohesive soils. Annual book of ASTM standards, Philadelphia, PA, 04.08, 1071-1081.
Bishop, A.W. and Henkel, D.J. (1953). Pore pressure changes during shear in two undisturbed clays. Proc. 3rd. Int. Conf. Soil Mech. Found. Eng. Zurich, Switzer-land, 94-99.
Casagrande, A., 1936. The determination of the pre-consolidation load and its practical significance. Proc. 1st. Int. Conf. on Soil Mech. and Found. Eng., Cam-bridge, Massachusetts, 3:60-64.
Casagrande, A. and Shannon, W.L. (1948a). Stress-deformation and strength characteristics of soils under dynamic loads. Proc. 2nd ICOSMFE, Rotterdam, 5, 29-34.
Casagrande, A. and Shannon, W.L. (1948b). Research on stress deformation and strength characteristics of soils and soft rocks under transient loading. Pub. Har-vard Univ. Grad. Sch. Eng. Soil Mechanics Series, No. 31. 132 pp.
Casagrande, A. and Wilson, S.D. (1953). Prestress in-duced in consolidated-quick triaxial tests. Proc. 3rd. ICOSMFE, Zurich, 1, 106-110.
Cetin, H. (1997). How did the Meers fault scarp form? Paleoearthquake or aseismic creep? A soil mechanical perspective. Engineering Geology, 47, 289-310. Crawford, C.B. (1961). The influence of strain on shearing resistance of sensitive clay. ASTM, 61, 1250-1265.
Esu, F. and Calabresi, G., 1969. Slope stability in an overconsolidated clay. Proc. 7th. Int. Conf. Soil. Mech. Found. Eng., Mexico City, Mexico, 2, 555-563.
Fredlund, D.G. and Rahardjo, H. (1993). Soil Mechan-ics for Unsaturated Soils. John Wiley & Sons, New York.
Henkel, D.J. (1960). The relationship between the ef-fective stresses and water content in saturated clays. Geotechnique, 10, 41-54.
Hirschfeld, R.C. (1960). The relation between shear strength and effective stress. Proc. 1st. Pan-American Conf. Soil Mech. Found. Eng., Mexico City, 2, 517-536. Kulhawy, F.H. and Mayne, P.W. (1990). Manual of estimating soil properties for foundation design. Elec-tric Power Research Institute, Palo Alto, California, U.S.A., Final Report, Project 1493-6, EL-6800. Lambe, T.W. (1951). Soil Testing for Engineers. John Wiley & Sons, New York.
Mitchell, J.K. (1993). Fundamentals of Soil Behavior. John Wiley & Sons, New York.
Olson, R.E., and Parola, J.F. (1967). Dynamic shear-ing properties of compacted clay. Proc. Int. Symp. on Wave Propagation and Dynamic Properties of Earth Materials, Albuquerque, 173-182.
Roark, R.J. (1954). Formulas for Stress and Strain. McGraw-Hill, New York.
Simons, N.E., 1965. Consolidation investigation on undisturbed Fornebu clay. Norwegian Geotech. Inst., 62, 1-9.
Tchalenko, J.S., 1967. The Influence of Shear and Con-solidation on the Microscopic Structure of Some Clays. Ph D Thesis, University of London, London, UK. Taylor, D.W. (1951). Research on shearing resistance of clay: Sections on water migration studies. U.S. Army Engineers Waterways Experiment Station Re-port 36/42, Vicksburg, Mississippi, 9-12.
Ward, W.H., Samuels, S.G., Butler, M.E., 1959. Fur-ther studies of the properties of London clay. Geotech-nique, 9, 33-58.