Research Article
A Clustering-Based Approach for Improving the Accuracy of
UWB Sensor-Based Indoor Positioning System
Taner Arsan
and Mohammed Muwafaq Noori Hameez
Computer Engineering Department, Kadir Has University, Istanbul 34083, Turkey Correspondence should be addressed to Taner Arsan; [email protected]
Received 6 July 2019; Revised 20 August 2019; Accepted 3 September 2019; Published 26 September 2019 Academic Editor: Jinglan Zhang
Copyright © 2019 Taner Arsan and Mohammed Muwafaq Noori Hameez. This is an open access article distributed under the Creative Commons Attribution License, which permits unrestricted use, distribution, and reproduction in any medium, provided the original work is properly cited.
There are several methods which can be used to locate an object or people in an indoor location. Ultra-wideband (UWB) is a specifically promising indoor positioning technology because of its high accuracy, resistance to interference, and better pen-etration. This study aims to improve the accuracy of the UWB sensor-based indoor positioning system. To achieve that, the proposed system is trained by using the K-means algorithm with an additional average silhouette method. This helps us to define the optimal number of clusters to be used by the K-means algorithm based on the value of the silhouette coefficient. Fuzzy c-means and mean shift algorithms are added for comparison purposes. This paper also introduces the impact of the Kalman filter while using the measured UWB test points as an input for the Kalman filter in order to obtain a better estimation of the position. As a result, the average localization error is reduced by 43.26% (from 16.3442 cm to 9.2745 cm) when combining the K-means al-gorithm with the Kalman filter in which the Kalman-filtered UWB-measured test points are used as an input for the proposed system.
1. Introduction
With the expansion of information technology, indoor positioning technology has developed rapidly. Positioning methods are mainly divided into two categories: the lo-cation fingerprint positioning method and the trilateration algorithm [1]. The need for high-accuracy indoor posi-tioning is a very important issue. Determining the location of patients in the hospital, locating workers in a large office, and also people trapped in a burning building are all part of scenarios that require a high accuracy indoor positioning systems. Numerous solutions are presented for location estimation of indoor targets [2, 3]. A large number of these solutions rely on multilateration and triangulation methods by utilizing ultrasound, infrared, and radio sig-nals. These solutions manage to provide information re-lated to the location. Triangulation utilizes the properties of triangles to determine the target position. It includes two derivations: first, the lateration, and second, the angulation. The lateration derivations determine the location of the
target by measuring the distances of this target from a number of reference points, instead of directly measuring the distance. The time difference of arrival (TDoA), the time of arrival (ToA), or received signal strengths (RSS) are usually measured; and the distance is obtained by calcu-lating the attenuation of the transmitted signal strength or, in another case, by multiplying the travel time and the velocity of the radio signal. The round trip time of flight (RToF) method is also used for range estimation purposes in some systems. However, angulation helps us to locate a target by calculating the angles relative to the reference points in the angle of arrival (AoA) method [4, 5]. Many positioning systems have different architectures, configu-rations, accuracies, and reliabilities to determine the po-sition of objects or people. Some of the indoor popo-sitioning systems are GPS, infrared, Wi-Fi, RFID, BLE Beacon, ul-trasonic location-based systems, and UWB [6, 7]. UWB signals have an extremely large bandwidth, more than 500 MHz. UWB transmitters allow better power efficiency due to its low consumption of power, compared to other
Volume 2019, Article ID 6372073, 13 pages https://doi.org/10.1155/2019/6372073
indoor positioning technologies [7, 8]. UWB offers a good multipath resolution since the indoor wireless system must cope with several multipath situations [8, 9]. Such a wide bandwidth offers many benefits in terms of communica-tions and radar applicacommunica-tions. In other words, the large bandwidth will enhance reliability since the signal includes a different variety of frequency components. Thus, at least some of them can go around or through obstacles. Hence, the UWB enables a more reliable and accurate positioning [10, 11].
One of the most important applications of the indoor positioning system is to achieve efficient manufacturing processes in industrial facilities where it is necessary to track products, objects, and machines. Such an environment is considered to be more complex compared to other regular indoor positioning scenarios in which large machines block the line of sight path and increase the reflections and multipath effects. Thus, in [12], the use of ultra-wideband-based (UWB) time difference-of-arrival positioning system is investigated. It includes four transceivers since UWB offers a solution to the multipath problem. In this study, the evaluation of the proposed system is performed in three different measurement setups. In single and the multi-channel setups, the result refers to an increase in accuracy with four transceivers per base station. And in situations where there are several multipath signals, the standard deviation of the measured positions is reduced by the multichannel anchors.
For the UWB systems to perform reliably in indoor areas, error mitigation techniques are applied based on the ranging error modelling methods [13]. In this, a commercial UWB system is used to develop error calibration models based on data obtained from an indoor area. Three cali-bration methods are implemented for static and kinematic test scenarios in order to generate the respective calibration models. When it comes to the evaluation of the calibration models, raw and calibrated ranges obtained at validation points of known positions are compared with the corre-sponding reference distances.
Another feature that can benefit from the indoor posi-tioning system is determining the position of assets within a network. The GPS is sufficient for an outdoor environment; however, the GPS is hard to apply in an indoor environment because of walls and obstacles. In [14], UWB direct chaotic communication is proposed, which has multiple advanta-geous features, such as low hardware complexity, lower power consumption, low cost, and large bandwidth, greater than 500 MHz. They investigate the feasibility of the ranging system by using a noncoherent chaotic transceiver. Location experiments are conducted in which the fuzzy logic algo-rithm is employed to lower the effect of the nonline-of-sight (NLoS) error on real indoor environments. The two-way ranging (TWR) method is applied in order to measure the signal round trip time (RTT) between two asynchronous transceivers. To achieve a high ranging accuracy, despite using noncoherent reception and low clock rate, fuzzy logic is used. The fuzzy logic algorithm produces fuzzy input membership function (FIMF) that can mitigate NLoS propagation effect.
There is a wide range of medical applications that can benefit from the indoor positioning functionality. Patients that suffer from dementia often show wandering behaviour because of memory loss or boredom. Such cases are con-sidered hard to understand and manage. Yang et al. [15] proposed a design and evaluated the wandering scenarios related to people who suffer from this condition using the S band (2–4 GHz) sensing technique. In an indoor environ-ment, different behaviours that include lapping, random, and pacing movements can be monitored and characterized by using such a frequency. The wandering patterns are recognized based on two factors: phase information and its received amplitude, that measures any disturbance caused in the ideal radio signal. A support vector machine is also used as a secondary analysis in order to classify the observed patterns.
In [16], a study is presented on monitoring and detection of freezing of gait (FOG). FOG is a nonmotor condition that appears on aging patients. The evaluation of FOG can reduce the chances of any secondary disorders. In this study, the amplitude and phase information of the radio signals are explored for a specified time duration using a single leaky wave cable (LWC), which can be used later to differentiate the motor and nonmotor symptoms. The reason for using LWC is to obtain a better performance when it comes to directivity and ease of deployment. The support vector machine method is used to classify the amplitude in-formation, whereas the linear transformation is performed to acquire sanitized phase information that can be used for detection purposes. The application of this method delivers a high-accuracy (around 99%) performance, based on the observation of several patients.
A nonintrusive breathing monitoring system that ben-efits from the C-band sensing technique is proposed in [17]. The respiratory motions of diabetic patients are monitored by this technique in order to identify diabetic ketoacidosis in indoor areas, which can be accessed from outside through the connectivity of tactile internet. When it comes to col-lecting wireless signals, the proposed system utilizes a mi-crowave-sensing platform (MSP) at the C-band. In addition to that, the respiratory sensor is utilized to verify the pro-posed system accuracy.
Most of the predescribed works utilize UWB for the indoor positioning system because of the wide range of ad-vantageous properties that the UWB indoor positioning system offers. It especially offers accuracy better than 30 cm. In our paper, a UWB development kit is utilized to implement this experiment and to provide the dataset for this study. Moreover, this UWB development kit provides accuracy better than 20 cm, and with the help of clustering algorithms, it provides accuracy better than 10 cm, around 9 cm.
Regarding the machine learning methods that are employed in these references, the support vector machine method is used in more than one study for classification purposes. Offered methods in our paper investigate the benefits of using the clustering methods that involve the grouping of data points with similar properties. Our paper presents the effect of using the clustering method on the accuracy of UWB indoor positioning system.
2. Related Works
Because of its many advantages, UWB is an emerging and promising technology in indoor environments. However, the existence of a line-of-sight (LoS) blockage can affect the location accuracy. First, the effects occur because the LoS blocking material, which has a high level of dielectric constant, introduces propagation delay. Second, by making the propagation channel’s multipath structure complicated, it makes it difficult to estimate the ToA of the path signal [18, 19].
A method is proposed to estimate the positions of a moving object instantaneously by combining the machine learning algorithm with the Kalman filter [20]. In [21], a method is proposed for indoor wireless localization, based on Wi-Fi K-means. First, the outcome distance formula is utilized to consider the effect of attribute values first. Second, the difference between different objects is considered, which can be computed more accurately. Despite the improve-ment, several technical problems remain in the indoor lo-calization based on Wi-Fi which is not fixed very well. The most important remaining problem is the accuracy of indoor positioning.
A method for using the multilateration with probabilistic RFID map-based technique is developed to determine the position of the unknown tag. The Kalman filter is also implemented to improve the estimation of the tag position. The application of this method can obtain the accurate estimation of position and accelerations as well [22].
In [23], the fuzzy c-means (FCM) clustering algorithm for indoor localization method is used; and a new imple-mentation in fingerprint for radio frequency is proposed. Using such an implementation makes the localization sys-tem more effective; and it is beneficial in terms of low power consumption and time efficiency.
A detailed similarity analysis is presented in [24] by adopting the K-means clustering algorithm with Squared Euclidean. The average silhouette method is utilized to validate how well separated the produced clusters are.
The issue of selecting the right cluster number is studied in [25]. The K-means algorithm is implemented, whereas the cluster number set is based on the highest average silhouette width. As a result, the optimum number of clusters is found from the given dataset. Moreover, there is also no need to use user-defined parameters.
The intelligent centroid localization (ICL) method is proposed in [26]. This method is a conversion of previously implemented centroid localization method, with the aim to determine the position of the unknown sensor location. The RSSI values are used as an input to the fuzzy system in the developed ICL method.
3. Experimental Setup and Indoor
Positioning Dataset
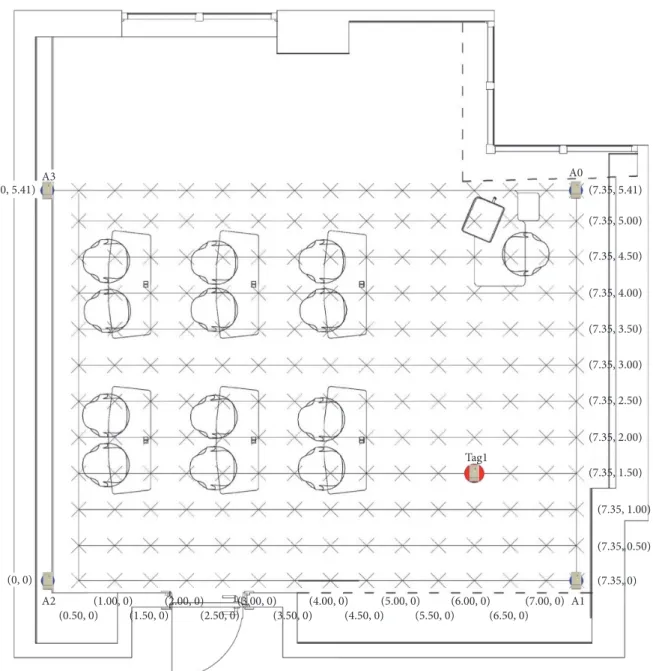
In this work, a dataset is used, collected from an active learning classroom (ALC), shown in Figure 1. The classroom contains moveable tables, chairs, and desks, so it provides multiple choices for seating. The classroom capacity is 28
people; and the area is developed to provide full control to the users. A total of 12 people setup is used when the dataset is collected. The design features are expected to support the use of all the locations in this classroom while performing different activities.
While the active learning classroom, measuring 7.35 m × 5.41 m, is designed as a test bed for collecting data, a ceiling system, attached to the ceiling and the anchors (shown as A0, A1, A2, and A3 in Figure 1), are held on each corner of the test bed at 2.85 m constant height.
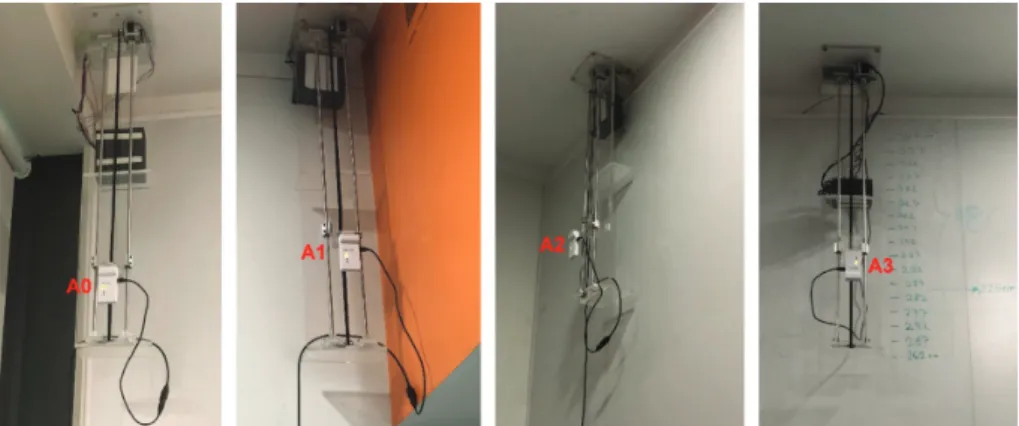
As shown in Figure 2, Decawave MDEK1001 UWB development kit [27] is utilized to implement this experi-ment, by including 4 anchors on the ceiling and a test tag for the test user. A total of 180 locations are marked for the test user who has a UWB sensor tag to wear around his/her neck. Then, the test user’s location data are collected. The total time of data collection is 9 hours excluding the time for the setup and change of observation cycles. A total of 27,000 location measurements are collected.
A special ceiling system shown in Figure 3 is developed to offer better LoS and also a direct path between the anchors and the tags [11]. The test user stayed in the test bed for at least 3 minutes providing 150 samples for each marked location.
4. Proposed Methods
The proposed methods employed in this study are briefly described in the following sections. These methods are K-means, fuzzy c-means, and mean shift for clustering, the Kalman filter, and finally, the average silhouette method to initialize the optimal number of clusters.
4.1. K-Means Clustering Algorithm. K-means is considered
to be one of the most important clustering algorithms. The K-means algorithm selects k initial number of centroids randomly. k in this case is the number of defined clusters by the user. Now, each point is assigned to the cluster center closest to this point. Based on the points in the cluster, the centroid gets updated. This process continues until there is no change in points within their clusters. The algorithm is composed by the following steps [28]:
(1) Set the cluster number
(2) Select k cluster centroids randomly
(3) Calculate the distance between points of data and cluster centroids
(4) If similar points of data are close to the centroid, move that cluster
(5) Acquire new cluster centers by averaging data points in each cluster
(6) Repeat Steps (3) to (5) until there is no change in cluster centroids or the maximum number of iter-ations is reached
4.2. Fuzzy C-Means Algorithm. FCM is an algorithm for data
of data belong to two or more clusters where fuzzy means “unclear” or “not defined” and C denotes “clustering.”
The advantages of this algorithm are its robust behav-iour, ability of uncertainty data modelling, applicability to multichannel data, and its straight-forward implementation [23].
The objective function given in equation (1) is con-sidered; and the aim is to minimize this objective function [23]: N i�1 C j�1 uijm�����xi− Cj�����2, (1)
where m refers to a real number higher than 1, uijrefers to
the membership degree of xiin the cluster j, xirefers to the
ith measured d-dimensional data, and cj refers to the
d-dimensional cluster center, while ‖∗‖is the norm which
expresses the similarity between the center and any mea-sured data.
The fuzzy partitioning process through the iterative optimization of the objective function is shown in equation
(1), with the update of membership uij and the cj cluster
centers by [29]: uij � 1 k�C1�����xi− cj�����/ x���� i− ck���� 2/(m− 1), (2) c � N i�1umij· xi Ni�1um ij . (3)
The iteration stops when [29]
A3 A2 (0, 5.41) (0, 0) (0.50, 0)(1.00, 0)(1.50, 0)(2.00, 0)(2.50, 0)(3.00, 0)(3.50, 0)(4.00, 0)(4.50, 0)(5.00, 0)(5.50, 0)(6.00, 0)(6.50, 0)(7.00, 0) (7.35, 0) (7.35, 0.50) (7.35, 1.00) (7.35, 1.50) (7.35, 2.00) Tag1 (7.35, 2.50) (7.35, 3.00) (7.35, 3.50) (7.35, 4.00) (7.35, 4.50) (7.35, 5.00) (7.35, 5.41) A0 A1
Figure 1: Active learning classroom, measuring 7.35 m × 5.41 m and installation of the four anchors expressed as A0, A1, A2, and A3, tag expressed as Tag1, and the test points expressed as ✕.
maxij u k+1 ij − u k ij < ε, (4)
where ε refers to the termination criterion, which is between 0 and 1, whereas k is the iteration step. This process con-verges to a local minimum. The FCM algorithm includes the following steps:
(1) Initialize U � [uij] matrix, U(0)
(2) Calculate the center vectors at k step, C(k) � [cj] with
U(k) using equation (3)
(3) Update both U(k) and U(k + 1) in equation (2) (4) STOP If ||U(k + 1) − U(k)|| < ε; otherwise, return to
Step (2)
4.3. Mean Shift Algorithm. The mean shift algorithm is based
on the general idea that locally averaging data result in moving to a higher density and, therefore, more typical regions [30]. This algorithm is a nonparametric estimator of
the density gradient. Using the iterative method, the local maximum can be obtained.
The algorithm is used for a variety of purposes. Clus-tering analysis, image segmentation, object tracking, in-formation fusion, edge detection, and filtering are some examples. The Kernel function is used in the mean shift algorithm to compute the steps of the algorithm and esti-mate the point gradient orientation [31].
The mean shift algorithm is very attractive because it is based on nonparametric kernel density estimates (KDE) in which the user does not need to define the number of clusters. The only parameter the user needs to specify is the scale of the clustering (bandwidth). In the mean shift clustering, the input of the algorithm is the data points and
the bandwidth or scale. Call x n
N n�1 ⊂ R
D, the data points
to be clustered. The kernel density estimate is defined as follows [30]: p(x) � 1 N N n�1 K x − xn σ �� �� �� ������ 2 , x∈ RD, (5)
Figure 2: A sensor kit of Decawave MDEK1001 development kit which can be assigned as an anchor or a tag.
where bandwidth σ > 0 and the kernel K (t), K (t) � e − t/2, for the Gaussian kernel. The Gaussian mean shift algorithm is shown in Algorithm 1 [30].
The results of the mean shift are carried over to kernels where each test point has its own weight and also its own bandwidth. The Gaussian kernels are utilized since it is easier to analyze and it leads to simpler formulas.
4.4. The Kalman Filter. The Kalman filter uses a series of data
observed over time that may contain inaccuracies such as noise with the aim to estimate the unknown variables with better accuracy. The Kalman filter has become a standard approach in optimal estimation due to its merits of real time, efficiency, speed, and strong anti-interference. And now, the Kalman filter is applied in the fields of target tracking and navigation, such as tracking of a maneuvering target and positioning of GPS [32]. The Kalman filter was firstly proposed by R. E. Kalman in 1960 [33]. Algorithm 2 summarizes the Kalman filter steps.
Xest, Pest, z, T, M, R, and Q are the state vector, covariance
of the state vector, the observation vector, the state transition matrix, observation matrix, covariance matrix of the mea-surement noise, and covariance of the process noise,
re-spectively. Here, s−
t and P
−
t fully parameterize the posterior
distribution, which is an improved estimate of the system
state vector and Xest its covariance Pest.
4.5. Average Silhouette Method. The average silhouette is a
way of defining the number of clusters, by measuring the quality of clustering. In other words, it determines how well each data point lies within its cluster. The silhouette ranges from − 1 to +1, the high value refers to good clustering. The higher the average silhouette coefficient is (closer to 1 than
0), the higher to its cluster the data points get [24]. If aiis
the average dissimilarity between the ithdata point and all
other points in the cluster and bi(k)is the average distance
from the ithpoint to points in another cluster k, then the
silhouette coefficient of the ithdata point is [25]
si� minkbi(k) − ai
max ai,minkbi(k)
. (6)
The steps of the average silhouette are as follows: (1) Perform the clustering algorithm, such as K-means
or fuzzy c-means for different values of k
(2) Calculate the average silhouette of observations for each k
(3) Consider the appropriate number of clusters based on the location of the maximum
5. Experimental Studies and Results
Experiments are performed using the ALC dataset. Our goal focuses on improving the accuracy of UWB indoor posi-tioning system using machine learning methods. Accuracy is used as the performance metrics in comparison among the
clustering methods. The accuracy metric is related to the distance between the real location and measured location for a given point. The distance is calculated using the Euclidean distance equation: d � �������������������� xr− xm2+ yr− ym2 , (7)
where (xr, yr)are the coordinates of the real location and
(xm, ym)are the coordinates of the measured location. The
ALC dataset has a 180 test point location, and each test point has 150 samples. The dataset is partitioned ran-domly into training data and test data in which the training dataset includes 70% of the samples, and the test dataset has 30% of the samples. The proposed system is shown in Figure 4.
5.1. Standalone Clustering Implementation. The proposed
system is applicable for K-means, FCM, and mean shift algorithms. The average silhouette method is used in order to define the optimal number of clusters in K-means and FCM algorithms for each test point by varying k (number of clusters) from 2 to 6 clusters. For each k, the average sil-houette coefficient is calculated using equation (6). Then, the number of clusters is selected with the highest average sil-houette coefficient, for both the training set and the test set. Figures 5 and 6 show the maximum average silhouette coefficient for K-means and FCM for the training set, re-spectively. Figures 7 and 8 show the maximum average silhouette coefficient for K-means and FCM for the test set, respectively.
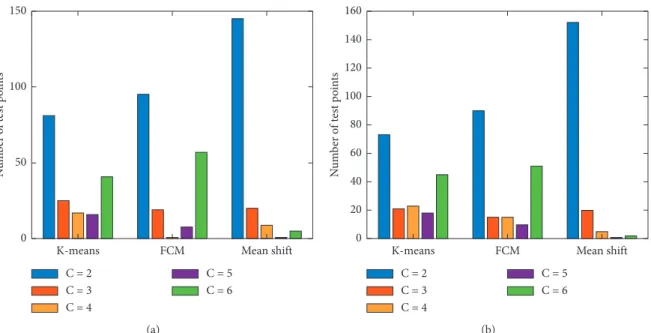
Figure 9(a) shows the optimal distribution of the mea-sured UWB test points (180 points) over clusters when applying the clustering algorithms for the training set. After setting the obtained number of clusters in all the imple-mented algorithms for the training set, one of the outcome clusters is chosen as a delegate based on its distance to the
real location (xr, yr)using equation (7). Then, the center of
the selected cluster (xc, yc) is calculated. At this step, the
selected cluster center is given for each test point in the training set, which is coordinate dependent, since there are 180 coordinates that represent the real locations.
When it comes to the test set, the average silhouette method is also used to define the optimal number of clusters for K-means and FCM algorithms. The optimal distribution of the test set over clusters is shown in Figure 9(b). One of the outcome clusters is chosen as a delegate based on its
distance to (xc, yc)for each test point. In order to identify
which (xc, yc)value belongs to which test point in the test
set, the average for each test point (xAvg, yAvg)in both the
training set and the test set is calculated. Then, the average of
test points (xAvg, yAvg) in the test set that has the nearest
distance to the test point (xAvg, yAvg) in the training set is
taken. It uses the corresponding (xc, yc)value to select the
delegate cluster.
The average location error comparison for the training set is shown in Figure 10(a), whereas the comparison in average location error for the test set is shown in Figure 10(b).
5.2. Clustering Implementation with the Kalman Filter. To
acquire a better optimized result and improve the accuracy of the clustering algorithms, in the second simulation, the Kalman filter is applied on the ALC dataset first.
Filtering noisy signals are important since many sensors have an output too noisy to be used directly; and utilizing the Kalman filter lets you take the uncertainty in the signal/state into account.
The same simulation is repeated, but instead of using the row UWB-measured test points, now the Kalman filtered UWB test points are used as an input.
Figures 11 and 12 show the maximum average sil-houette coefficient when applying the Kalman filter on the training set for K-means and FCM algorithms, re-spectively. The maximum average silhouette coefficient when applying the Kalman filter on the test set is shown in Figure 13 for the K-means algorithm, and Figure 14 for the FCM algorithm.
The distribution of test points over clusters after applying the Kalman filter for the training set and test set is shown in Figures 15(a) and 15(b), respectively. The average error comparison after applying the Kalman filter for test is shown in Figure 16.
As shown in Figure 16, the results significantly im-proved, and again, the K-means algorithm outperforms both FCM and mean shift algorithms.
6. Discussion
The primary purpose of this study is to investigate the use of different clustering algorithms to improve the accuracy of the UWB indoor positioning system and check the performance of each algorithm. The highest accuracy is obtained when applying the K-means algorithm. Thus, applying the K-means algorithm in relevant studies is recommended based on the obtained results. One of the limitations of using the K-means clustering algorithm is to initialize the number of clusters in advance, so it is difficult to predict the k value. This drawback is overcome by implementing the average silhouette method to define the number of clusters to be used as input to the K-means algorithm.
The secondary purpose is to introduce the impact of employing the Kalman filter on the accuracy. Hence, the raw UWB dataset is fed to the Kalman filter first. Then, the Kalman-filtered UWB dataset is used as input to the clus-tering algorithms. By combining the Kalman filter with K-means, the highest possible accuracy is obtained in this study. Implementing the Kalman filter should be highly considered when improving the accuracy of the indoor positioning system. The cost factors should also be con-sidered when combining both the Kalman filter and any of the clustering algorithms, especially the computation time factor. for n ∈ 1, . . . , N{ } x⟵ xn repeat ∀n : p(n ∣ x) ⟵ (exp(− (1/2)‖(x − xn)/σ‖2))/( N n′�1exp(− (1/2)‖(x − xn′)/σ‖2)) x⟵ Nn�1p(n∣ x)xn until stop zn⟵ x end connected components ( z nNn�1,ε)
ALGORITHM 1: Gaussian mean shift algorithm [30].
Input: Q, R, z, Xest, Pest
Output: s−
t, P
−
t
Step 1. Initialize T matrix and M matrix
Step 2. Predict the state vector and the covariance: Xprd�T ∗ Xest
Pprd�T ∗ Pest∗ T′+ Q
Step 3. Estimation step: S � M ∗ Pprd′ ∗ M′+ R
B � M ∗ Pprd′
Step 4. Compute the Kalman gain factor: klm_gain � (S/B)′
Step 5. Correction based on observation: s− t�Xprd+ klm_gain ∗ (z− M ∗ Xprd) P− t�Pprd−klm_gain ∗ M ∗ Pprd Step 6. Return s− t, P − t
Start
Input test points Tsi
i = (1, ..., 180)
Randomly select 30% for test
Calculate the average for x and
y coordinates
(xAvg, yAvg)
Randomly select 70% for training Chose k based on average silhouette method Apply K-means algorithm Chose k based on average silhouette method Apply K-means algorithm
Calculate each cluster center
Calculate each cluster center
Select the cluster with nearest distance
to (xc, yc)
Select the cluster with nearest distance to the real location (xr, yr)
Obtain the selected cluster center (xc, yc) End
Calculate the average for x and
y coordinates
(xAvg, yAvg)
Compare (xAvg, yAvg) from the two sources based
on distance Ts1(xAvg, yAvg) :(xc, yc) Ts2(xAvg, yAvg) : (xc, yc) Ts180(xAvg, yAvg) : (xc, yc) · · ·
Figure 4: Proposed system flow chart.
0 0.2 0.4 0.6 0.8 1 0 60 120 180 Silhouette coefficient Test points
Figure 5: The maximum average silhouette coefficient in K-means for the training set.
0 0.2 0.4 0.6 0.8 1 0 60 120 180 Silhouette coefficient Test points
0 0.2 0.4 0.6 0.8 1 0 60 120 180 Silhouette coefficient Test points
Figure 7: The maximum average silhouette coefficient in K-means for the test set.
0 0.2 0.4 0.6 0.8 1 0 60 120 180 Silhouette coefficient Test points
Figure 8: The maximum average silhouette coefficient in FCM for the test set.
N um ber o f t est p oin ts 150 100 50 0
K-means FCM Mean shift
C = 2 C = 3 C = 4 C = 5 C = 6 (a) 160 140 120 100 80 60 40 20 0 N um ber o f t est p oin ts
K-means FCM Mean shift
C = 2 C = 3 C = 4 C = 5 C = 6 (b)
Figure 9: The distribution of UWB test points over clusters (a) for the training set and (b) for the test set.
13.72 13.92 13.96 16.3378 12 13 14 15 16 17 K-means Mean shift FCM Raw data Average error in cm (a) 14.09 14.27 14.47 16.3442 12 13 14 15 16 17 K-means FCM Mean shift Raw data Average error in cm (b)
0 0.2 0.4 0.6 0.8 1 0 60 120 180 Silhouette coefficient Test points
Figure 11: The maximum average silhouette coefficient in K-means after applying the Kalman filter for the training set.
0 0.2 0.4 0.6 0.8 1 0 60 120 180 Silhouette coefficient Test points
Figure 12: The maximum average silhouette coefficient in FCM after applying the Kalman filter for the training set.
0 0.2 0.4 0.6 0.8 1 0 60 120 180 Silhouette coefficient Test points
Figure 13: The maximum average silhouette coefficient in K-means after applying the Kalman filter for the test set.
0 0.2 0.4 0.6 0.8 1 0 60 120 180 Silhouette coefficient Test points
7. Conclusions
In this paper, three clustering algorithms are compared in terms of accuracy, using the ALC dataset. As a conclusion, it can be deduced that the K-means algorithm is superior to all other methods, with the highest accuracy (14.0864 cm) for the test set, especially when the average silhouette method is used to determine the optimal number of clusters. However, the mean shift algorithm has the lowest accuracy (14.4748 cm), when it is compared with K-means and FCM algorithms, despite its advantage. The main advantages of mean shift algorithms stem from the nonparametric nature of the kernel density estimate (KDE); and the user needs to set only one parameter, the bandwidth. This is often more convenient than having to select the number of clusters explicitly or utilizing other methods to define the number of clusters such as the average silhouette or the elbow methods. The FCM algorithm has an accuracy of 14.2743 cm, which is very close to the result obtained from the K-means algorithm. However, the FCM algorithm tends to run more
slowly when it is compared with K-means because more work is done during the processes where each data point is evaluated with each cluster; and with each evaluation, more operations are involved. FCM needs to do a full inverse-distance weighting, whereas K-means just needs to do a distance calculation. Thus, K-means is simpler and com-putationally faster.
In [26], the measured RSSI values are applied as an input to the fuzzy system, and the base values of the fuzzy system’s output membership functions are adjusted by using genetic algorithm to reduce location error. The error in location is reduced by approximately 57%, and 65% when compared with the centroid localization method and the APIT (ap-proximate point in triangle) algorithm. In our paper, the UWB measured values are used as an input to the proposed system. The number of clusters for each test point in K-means and FCM algorithms is selected based on the value of the silhouette coefficient to determine how well each object lies within its cluster. As an advantage of imple-menting the Kalman filter, the accuracy is enhanced
150 100 50 0 N um ber o f t est p oin ts
K-means FCM Mean shift
C = 2 C = 3 C = 4 C = 5 C = 6 (a) N um ber o f t est p oin ts
K-means FCM Mean shift
C = 2 C = 3 C = 4 C = 5 C = 6 160 140 120 100 80 60 40 20 0 (b)
Figure 15: The distribution of test points over clusters after applying the Kalman filter (a) for the training set and (b) for the test set.
9.27 9.32 9.89 11.27 16.3442 0 2 4 6 8 10 12 14 16 18 KF K-means KF FCM KF mean shift Kalman filtered-KF Raw data Average error in cm
significantly where the average location error is reduced by 31.05% for the test set.
Finally, the Kalman-filtered UWB data are applied as an input to the clustering algorithm for the training and the test sets. The best result is obtained from the K-means algorithm in which the average error is reduced by 43.26% (from 16.3442 cm to 9.2745 cm). As it can be clearly observed by considering the Kalman filter effect on the raw data, noise and interference effects can be removed from the signal. Then, if filtered data can be considered for the clustering method, it will be much more effective and much more accurate. Based on the obtained results from the clustering algorithms, it can be concluded that the K-means is the most appropriate one for indoor positioning system due to its simplicity, fast computations, and especially its high accu-racy. Another feature to recommend the K-means algorithm for consideration is that it can be scaled to large datasets. Advanced versions of the K-means should be taken into account for future studies to select better values of the initial centroids. Since the K-means has a gradient descent nature, the algorithm is highly sensitive to the initial placement of the cluster centers.
Data Availability
The raw data used to support the findings of this study are available from the corresponding author upon request.
Conflicts of Interest
The authors declare that they have no conflicts of interest.
Acknowledgments
This research was funded by Personal Research Project (BAP) grants received from Kadir Has University (Grant number: 2017-BAP-09).
References
[1] W. Xue, X. Hua, Q. Li, W. Qiu, and X. Peng, “Improved clustering algorithm of neighboring reference points based on KNN for indoor localization,” in Proceedings of the 2018 Ubiquitous Positioning, Indoor Navigation and Location-Based Services (UPINLBS), pp. 1–4, Wuhan, China, March 2018.
[2] R. F. Brena, J. P. Garc´ıa-V´azquez, C. E. Galv´an-Tejada, D. Muñoz-Rodriguez, C. Vargas-Rosales, and J. Fangmeyer Jr., “Evolution of indoor positioning technologies: a survey,” Journal of Sensors, vol. 2017, Article ID 2630413, 21 pages, 2017.
[3] B. G. Lee, Y. S. Lee, and W. Y. Chung, “3D navigation real time RSSI-based indoor tracking application,” JUCT: Journal of Ubiquitous Convergence Technology, vol. 2, no. 2, pp. 67–77, 2008. [4] A. Ren, F. Zhou, A. Rahman, X. Wang, N. Zhao, and X. Yang, “A study of indoor positioning based on UWB base-station configurations,” in Proceedings of the 2017 IEEE 2nd Advanced Information Technology, Electronic and Automation Control Conference (IAEAC), pp. 1939–1943, Chongqing, China, March 2017.
[5] Y. U. Lee, “Weighted-average based AOA parameter esti-mations for LR-UWB wireless positioning system,” IEICE Transactions on Communications, vol. E94-B, no. 12, pp. 3599–3602, 2011.
[6] K. Pahlavan, P. Krishnamurthy, and A. Beneat, “Wideband radio propagation modeling for indoor geolocation applica-tions,” IEEE Communications Magazine, vol. 36, no. 4, pp. 60–65, 1998.
[7] A. Alarifi, A. Al-Salman, M. Alsaleh et al., “Ultra wideband indoor positioning technologies: analysis and recent ad-vances,” Sensors, vol. 16, no. 5, 707 pages, 2016.
[8] T. Gigl, G. J. Janssen, V. Dizdarevic, K. Witrisal, and Z. Irahhauten, “Analysis of a UWB indoor positioning system based on received signal strength,” in Proceedings of the 2007 4th Workshop on Positioning, Navigation and Communica-tion, pp. 97–101, Hannover, Germany, March 2007. [9] S. Gezici, Z. Zhi Tian, G. B. Giannakis et al., “Localization via
ultra-wideband radios: a look at positioning aspects for future sensor networks,” IEEE Signal Processing Magazine, vol. 22, no. 4, pp. 70–84, 2005.
[10] T. Dag and T. Arsan, “Received signal strength based least squares lateration algorithm for indoor localization,” Com-puters & Electrical Engineering, vol. 66, pp. 114–126, 2018. [11] T. Arsan and O. Kepez, “Early steps in automated behavior
mapping via indoor sensors,” Sensors, vol. 17, no. 12, 2925 pages, 2017.
[12] G. Schroeer, “A real-time UWB multi-channel indoor posi-tioning system for industrial scenarios,” in Proceedings of the International Conference on Indoor Positioning and Indoor Navigation (IPIN), pp. 1–5, Nantes, France, September 2018. [13] H. Perakis and V. Gikas, “Evaluation of range error cali-bration models for indoor uwb positioning applications,” in Proceedings of the 2018 International Conference on Indoor Positioning and Indoor Navigation (IPIN), pp. 206–212, Nantes, France, September 2018.
[14] S. Y. Lee and W. C. Yang, “A non-coherent UWB direct chaotic indoor positioning system using fuzzy logic algo-rithm,” in Proceedings of the 9th International Conference on Advanced Communication Technology, vol. 3, pp. 2021–2025, Okamoto, Kobe, Japan, February 2007.
[15] X. Yang, S. A. Shah, A. Ren et al., “Wandering pattern sensing at S-band,” IEEE Journal of Biomedical and Health In-formatics, vol. 22, no. 6, pp. 1863–1870, 2018.
[16] X. Yang, S. A. Shah, A. Ren et al., “Freezing of gait detection considering leaky wave cable,” IEEE Transactions on Antennas and Propagation, vol. 67, no. 1, pp. 554–561, 2019.
[17] X. Yang, D. Fan, A. Ren, N. Zhao, and M. Alam, “5G-based user-centric sensing at C-band,” IEEE Transactions on In-dustrial Informatics, vol. 15, no. 5, pp. 3040–3047, 2019. [18] J. Y. Lee and R. A. Scholtz, “Ranging in a dense multipath
environment using an UWB radio link,” IEEE Journal on Selected Areas in Communications, vol. 20, no. 9, pp. 1677– 1683, 2002.
[19] N. A. Alsindi, B. Alavi, and K. Pahlavan, “Measurement and modeling of ultrawideband TOA-based ranging in indoor multipath environments,” IEEE Transactions on Vehicular Technology, vol. 58, no. 3, pp. 1046–1058, 2009.
[20] S. Mahfouz, F. Mourad-Chehade, P. Honeine, J. Farah, and H. Snoussi, “Target tracking using machine learning and Kalman filter in wireless sensor networks,” IEEE Sensors Journal, vol. 14, no. 10, pp. 3715–3725, 2014.
[21] Y. Zhong, F. Wu, J. Zhang, and B. Dong, “WiFi indoor lo-calization based on K-means,” in Proceedings of the 2016 International Conference on Audio, Language and Image
Processing (ICALIP), pp. 663–667, Shanghai, China, April 2016.
[22] A. Bekkali, H. Sanson, and M. Matsumoto, “RFID indoor positioning based on probabilistic RFID map and Kalman filtering,” in Proceedings of the Third IEEE International Conference on Wireless and Mobile Computing, Networking and Communications (WiMob 2007), White Plains, NY, USA, October 2007.
[23] D. J. Suroso, P. Cherntanomwong, P. Sooraksa, and J. Takada, “Location fingerprint technique using fuzzy C-means clus-tering algorithm for indoor localization,” in Proceedings of the TENCON 2011-2011 IEEE Region 10 Conference, pp. 88–92, Bali, Indonesia, November 2011.
[24] M. Yesilbudak, “Clustering analysis of multidimensional wind speed data using k-means approach,” in Proceedings of the 2016 IEEE International Conference on Renewable Energy Research and Applications (ICRERA), pp. 961–965, Birmingham, UK, November 2016.
[25] N. Paivinen and T. Gronfors, “Finding the optimal number of clusters from artificial datasets,” in Proceedings of the 2006 IEEE International Conference on Computational Cybernetics, pp. 1–6, Budapest, Hungary, August 2006.
[26] T. Tuncer, “Intelligent centroid localization based on fuzzy logic and genetic algorithm,” International Journal of Com-putational Intelligence Systems, vol. 10, no. 1, pp. 1056–1065, 2017.
[27] Decawave, MDEK1001 Kit User Manual Module Devel-opment & Evaluation Kit for the DWM1001, https://www. decawave.com/wp-content/uploads/2019/01/MDEK1001_ System_User_Manual-1.1.pdf, 2017.
[28] B. S. Shedthi, S. Shetty, and M. Siddappa, “Implementation and comparison of k-means and fuzzy c-means algorithms for agricultural data,” in Proceedings of the 2017 International Conference on Inventive Communication and Computational Technologies (ICICCT), pp. 105–108, Coimbatore, India, March 2017.
[29] A. Naik, S. C. Satapathy, and K. Parvathi, “Improvement of initial cluster center of C-means using teaching learning based optimization,” Procedia Technology, vol. 6, pp. 428–435, 2012. [30] M. ´A. Carreira-Perpin´an, A Review of Mean-Shift Algorithms
for Clustering, https://arxiv.org/abs/1503.00687, 2015. [31] Q. Guo, X. Chang, and H. Chu, “Clustering analysis based on
the mean Shift,” in Proceedings of the 2007 International Conference on Mechatronics and Automation, pp. 309–313, Harbin, China, August 2007.
[32] Q. Li, R. Li, K. Ji, and W. Dai, “Kalman filter and its appli-cation,” in Proceedings of the 2015 8th International Confer-ence on Intelligent Networks and Intelligent Systems (ICINIS), pp. 74–77, Tianjin, China, November 2015.
[33] R. E. Kalman, “A new approach to linear filtering and pre-diction problems,” Journal of Basic Engineering, vol. 82, no. 1, pp. 35–45, 1960.
Computer Games Technology International Journal of Hindawi www.hindawi.com Volume 2018 Hindawi www.hindawi.com Journal of
Engineering
Volume 2018 Advances inFuzzy
Systems
Hindawi www.hindawi.com Volume 2018 International Journal of Reconfigurable Computing Hindawi www.hindawi.com Volume 2018 Hindawi www.hindawi.com Volume 2018Applied
Computational
Intelligence and Soft
Computing
Advances inArtificial
Intelligence
Hindawi www.hindawi.com Volume 2018 Hindawi www.hindawi.com Volume 2018Civil Engineering
Advances inHindawi
www.hindawi.com Volume 2018 Electrical and Computer Engineering Journal of Journal of Computer Networks and Communications Hindawi www.hindawi.com Volume 2018 Hindawi www.hindawi.com Volume 2018
Multimedia
International Journal ofBiomedical Imaging
Hindawi www.hindawi.com Volume 2018 Hindawi www.hindawi.com Volume 2018 Engineering Mathematics International Journal ofRobotics
Journal of Hindawiwww.hindawi.com Volume 2018 Hindawiwww.hindawi.com Volume 2018
Computational Intelligence and Neuroscience Hindawi www.hindawi.com Volume 2018 Mathematical Problems in Engineering Modelling & Simulation in Engineering Hindawi www.hindawi.com Volume 2018
Hindawi Publishing Corporation
http://www.hindawi.com Volume 2013 Hindawi www.hindawi.com