CHARACTERIZATION OF MPS CAPPED CdS QUANTUM DOTS AND FORMATION OF SELF-ASSEMBLED QUANTUM DOTS THIN FILMS ON A GLASSY SUBSTRATE
KENAN KOÇa,b, FATMA Z. TEPEHANb, GALIP G. TEPEHANc*
aDepartment of Physics, Yildiz Technical University, Esenler, 34220 Istanbul,
Turkey
bDepartment of Physics, İsanbul Technical University, Maslak, 34469 Istanbul,
Turkey
cFaculty of Arts and Sciences , Kadir Has University,Cibali Campus,Fatih,
Istanbul 34083, Turkey
Colloidal, powdered and thin film forms of MPS capped CdS quantum dots have been produced by combination of colloidal chemistry and sol-gel method. Nanoparticles were self-assembled directly on a glass substrate using spin coating method without introducing any matrix. Colloidal, powdered and thin film forms were characterised by absorbance, photo-luminescence, XRD, FT-IR, HRTEM and AFM measurements. The HRTEM images give a grain size of 2.5-3.0 nm and this is in agreement with the values found in the absorbance and XRD measurement. Average size of the quantum dots increase with increasing of heat treatment temperature due to Oswald ripening.
(Recieved March 29, 2011; revised April 30,; accepted after revision May 4, 2011) Keywords: CdS quantum dots; Self-assembled thin film precursor; 3-Mercaptopropyl- trimethoxysilane (MPS); Sol-gel method
1. Introduction
Nano sized materials are attractive because of their unique optical, electrical, chemical properties. Unlike the bulk materials, the emission wavelength of the nanoparticles (quantum dots) depends on their crystal dimension. They exhibit size dependent molecular like emission spectra due to quantum confinement effect [1]. Therefore, many researches have been focused on the production of nanomaterials with controllable size. Among the semiconductor nanocrystals, CdS is one of the most important II-VI group elements possesing size tunable optical transitions. Much effort has been given to the synthesis and optical property study of CdS related nano paticles and quantum dots because they have wide applications for laser light emitting diodes, solar cells and some optoelectronic devices based on nonlinear properties [2-7]. There has been extensive work on the production and deposition of CdS nanoparticle. Among the various available techniques [2-4], sol-gel method has advantages to produce CdS in nano-structured, powdered and thin film form. Some of the work described the preparation of quantum dots involve colloidal routes during which the particles are capped with organic molecules. The combination of sol-gel technology and colloidal chemistry improves the solution stability [8]. It was also shown that concentration of capping agent has a strong influence on the final size of the CdS nanocrystals [9].
3-Mercaptopropyl-trimethoxysilane (MPS) contains bi-functional groups molecule; the silane in one side can bond to the glass surface or metal oxide films, the thiol group on the other side can work as a capping agent [7-16]. Typical hydrolysis and condensation reactions in sol-gel methods helps organosilanes to bond to the surface of the substrates[17]. There have been various studies that used 3-Mercaptopropyl-trimethoxysilane (MPS) as capping agent to produce QDs. They were used in biological applications [18] and nonlinear optical materials [ 9, 10].
In the present work, we have used combination of colloidal chemistry and sol-gel method to produce MPS capped CdS nanoparticles. Several properties of the MPS such as control of the size of the QDs, bonding on the glass surface and QDs were used together. The nano particles were produced and self-assembled directly on a glass substrate using spin coating method without introducing any matrix. CdS in powder form were obtained by graining gelled solution. Different size of the quantum dots were got by applying heat treatment at various temperatures.
2. Experimental
Production of quantum dots and thin films
CdS nanoparticles were produced using the reaction of cadmium acetate (Cd(CH3COO)2.2H2O) with thioacetamide ((CH3CSN2) at a molar ratio of one. The molar ratios of cadmium acetate /methanol and of thioacetamide /methanol were equal to 0.02. MPS was mixed with cadmium acetate at a molar ratio of MPS/Cd=0.3 [9,10]. This ratio was decided after analyzing the absorption spectrum of the nano CdS at several other ratios (0.1M, 0.2M, 0.5M) and considering the previous works [9-11]. Then the solutions in two bakers were mixed and stirred for 10 minute at 60 0C in Nitrogen medium. The sol which was colorless at the begining turned to yellow at the end of the stirring.
MPS caped CdS sols were first left in room atmosphere for two weeks to bring it in gel form and then it was grained to produce nano particles in powder form.
On the other hand MPS capped sol was coated on glass substrates (Corning 2947) with spin coating method at spining rate of 2000 rot/min for 10 seconds. The coated substrates dried at 60 oC for 10 minutes for each coating. Dried films were heat treated at 300 oC and 350 oC for 15 minutes. Another heat treatment were carried out at 550 oC for 18 hours and the crystal structure. Was investigated.
Characterization
The optical absorption spectra of the samples were recorded with an UV- visible spectrometer (Agilen 8453). The fluorescence spectra of coloidal CdS quantum dots were recorded using a Varian Cary Eclipse spectrometer. X-ray diffraction measurements were performed by a diffractometer (XRD, GBC-MMA) operated at 35 kV and 28 mA using CuKα radiation. High resolution transmission electron microscope (HRTEM) images of the MPS capped CdS quantum dots in powder form has been recorded using a JEOL 2100 HRTEM microscope operated at 200 kV. The nanoparticles in powder form and KBr were thoroughly mixed, and the mixture was pressed to form pellets. The spectrum was recorded using a Fourier transform-infrared (FT-IR) spectrometer (Perkin Elmer Spectrum One). The surface roughness of the film was characterized by an atomic force microscope (AFM, SPM-9500J3, Shimadzu) operating in the dynamic mode.
3. Results and discussion
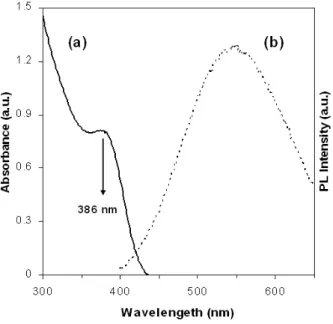
The absorbance and luminescence spectra of coloidal CdS quantum dots recorded at room temperature are shown in Fig. 1. Energy band gap for the 1s-1s transition of quantum dots, using quantum confinement theory is given as
1 * * 2 2 4 2 * * 2 2 2 1 1 1 1 2 248 . 0 786 . 1 1 1 2 − ⎟⎟ ⎠ ⎞ ⎜⎜ ⎝ ⎛ + − − ⎟⎟ ⎠ ⎞ ⎜⎜ ⎝ ⎛ + + = h e h e g s s m m e R e m m R E E h h
ε
ε
π
(1)where Eg is the band gap energy of the bulk CdS, h is Planck constant, me is the effective mass of an electron, mh is the effective mass of a hole, R is the diameter of the nanocrystal, e is the electron charge, ε is the relative dielectric constant. Second, third and fourth terms in the equations are, confinement kinetic energy of the exciton, Coulomb potential energy between the electron and the
hole and polarization energy of the tunneling electron, respectively [1,19-22]. First minimum of the second derivative of absorbance graph specifies E1s1s energy levels of quantum dots. Using the values of Eg = 2.42 eV (for bulk CdS), me = 0.19 m0, mh=0.8 me, ε = 5.7 [1] and E1s1s= 3.21 eV in eq 1, the size of the quantum dots (R) was calculated as 2.92 nm. The photoluminescence (PL) spectra of the CdS were recorded at room temperature using the excitation wavelength of 350 nm. The emmision peak was observed at 550 nm and the width of the peak can be attributed to the surface defect emmision of the CdS nanoparticles. [23]
Fig 1. Absorbance (a) and luminescence (b) spectra of coloidal CdS quantum dots
XRD powder graph of CdS is shown in Fig. 2. The XRD pattern exhibits prominent broad peaks at 2θ values of 25.03o, 26.65o, 28.38o, 43.76o, 47.87o, 51.88o and d-spacing values (nm) are 0.3555, 0.3342, 0.3142, 0.2067, 0.1899 ve 0.1761 respectively. These results are in agreement with 100, 002,101, 102, 110, 103, 112 and 201 planes and show hexagonal structure [24].
Fig. 2. XRD patterns of the MPS capped CdS quantum dots in powder form.
Average particle size can be found from XRD measurements using Debye-Scherrer formula [25].
θ
β
λ
cos
9
.
0
=
L
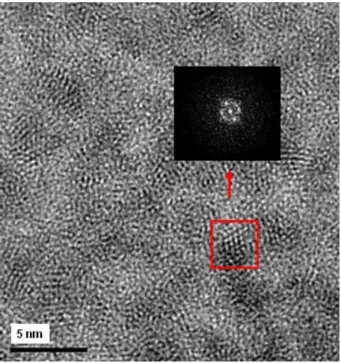
(2) where λ is the wavelength of X-ray (0.154 nm), β is the full width at half maximum (FWHM), θ is the angle of diffraction and L is the coherence length. In the case of spherical crystallites, the relation between L and D, the diameter of the crystallite, is given by L = 3/4D. Average particle size of the quntum dot were calculated as 2.73 nm using {101} peak.Fig. 3. HRTEM picture of MPS capped CdS quantum dots in powder form and FFT pictures of a quantum dot.
HRTEM and FFT (Fast Fourier Transform) pictures of a quantum dot is shown in Fig.3. The HRTEM images gives a grain size of 2.5-3.0 nm and this is in agreement with the values found in the absorbance and XRD measurement.
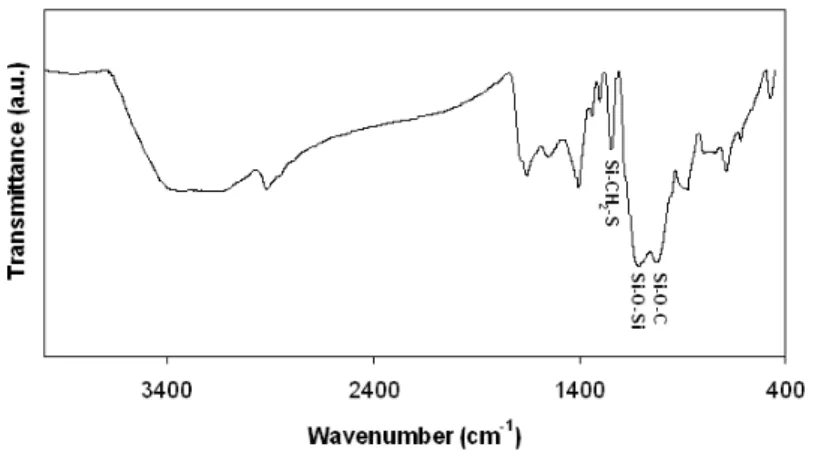
FT-IR graph of MPS capped CdS is shown in Fig. 4. The FT-IR analysis shows the characteristic peaks belonging to MPS. The most prominent peaks of these are at 1024 cm-1 and 1110 cm-1 belonging to asymmetric stretchings of Si-O-C and Si-O-Si bonds respectively [26-28]. The peak at 471 cm-1 may belong to Si-O-Si bond [29] or S-S bond [30]. The peaks at 688 cm-1 and 892 cm-1 belong to C-Si and Si-OH bonds respectively [27]. The peak at 1248 cm-1 is for Si-CH2-S stretching [26]. The peak at 1404 cm-1 comes from assymmetric deformation of C-H in CH3 [31]. The peak 1550 cm-1 may be attributed to S-S bond [29]. The peak at 1660 cm-1 belongs to C=C bond [32]. The peaks at 2920 cm-1 and 3153 cm-1 are belong to C-H and O-H respectively [26,27].
Fig. 4. FT-IR graph of MPS capped CdS quantum dots in powder form.
OH goups on the glass surface and Si –O bonds of MPS are used for the production of self-assembled CdS thin films of quantum dots. CdS quantum dots and glass surface are bonded with Si-O-Si bonds. Bonding of self-assembled CdS is shown below.
Quantum dots are also bonded with Si-O-Si bonds between themselves. Bonding of MPS to CdS quantum dots is done through thiol groups. Cd and S atoms on the quantum dots are bonded to S atoms of thiol groups through S-S and S-Cd bonding. [33]. Fig. 5. shows schematically the coating machanism of such type of sol on a glass substrate.
Fig. 5. Scheme of formation of the self-assembled MPS capped CdS quntum dots thin film precursor on the glass substrate.
Fig. 6. Absorbance graph of MPS capped CdS quntum dots thin film heat treated at different temperatures and second derivatives of absorption spectra for CdS nanoparticles. The numbers on the graph show the position of the first peak.
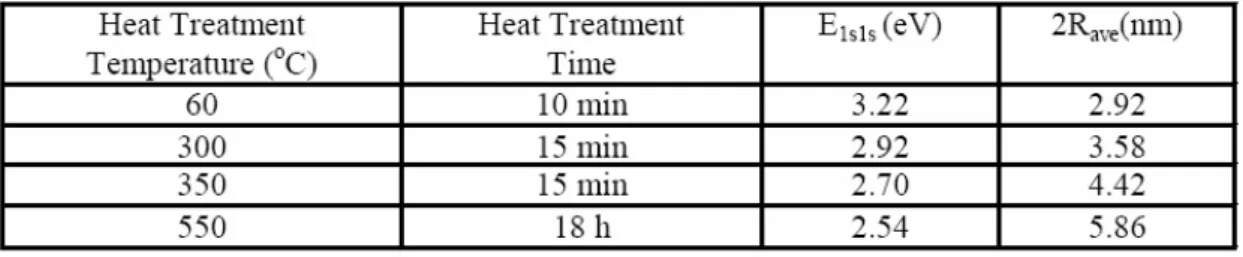
Absorbance graph of MPS capped CdS quntum dots thin film is shown in Fig. 6. The second derivative of absorbance graph is also shown in the same graph. First minimum of the second derivative graph of absorbance graph defines E1s1s energy levels of quantum dots. E1s1s values at varius heat treatment temperatures and corresponding diameter of quantum dots using eq. 1 are shown in Table 1. One observes that the particle sizes of the films dried at 60 oC are the same as those of coloidal CdS quantum dots. The results also show that the average size of the quantum dots increases with increasing the heat treatment temperature. Small crystals of CdS are disolved with increasing heat treatment temperature and they are redeposited on the larger crystals due to Oswald ripening [34-36].
Table 1. Calculated value of average radius (Rave) by using the first exciton peak. First exciton peak (Elsls) values are extracted from the second derivative of the absorption spectra
XRD measurements were carried out in order to characterize the CdS particles. Figure 7 shows the XRD pattern of three CdS films heat treated at 300 0C, 350 0C and 550 0C. Two of them were heat treated for 15 min and the third one was heat treated for 18 hours. The films heat treated at 300 0C and 350 0C have shown no observable peaks because the structure is amorphous or has very small crystallites dimensions. It is, therefore, difficult to analyze the crystal structure of these films. On the other hand, the films heat treated at 550 0C for 18 hours have observable crystalline structure. The XRD pattern exhibits prominent broad peaks at 2θ values of 24.940, 26.560, 28.410, 36.660, 43.820, 47.850, 51.920 and 53.040 with d-spacing (in nm) of 0.3567, 0.3353, 0.3139, 0.2449, 0.2064, 0.1899, 0.1760 and 0.1725 nm respectively. These results are in agreement with 100, 002,101, 102, 110, 103, 112 and 201 planes and show hexagonal structure [24]. Average
particle size of the quntum dot were calculated as 5.90 nm using {101} peak. This is in agreement with the result of 5.86 nm found in absorbance measurements.
Fig. 7. XRD patterns of the MPS capped CdS quantum dots thin films heat treated at different temperatures and times.
Fig. 8. AFM image of MPS capped CdS quntum dots thin film heat treated at 350°C.
Fig. 8 shows the AFM image of CdS thin film heat treated at 350°C. The root mean square surface roughness of the film is 44 nm. The image shows that the film is homogeneous and without cracks.
4. Conclusions
We have investigated optical and structural properties of colloidal, powdered and thin film forms of MPS capped CdS quantum dots produced by combination of colloidal chemistry and sol-gel method. Absorption, photo-luminescence and HRTEM, XRD analysis proved the existence of CdS nanocrystals. The size of the particles are situated in the range 2.5 -3.0 nanometers, smaller than Bohr radius. Nanoparticles were self-assembled directly on a glass substrate using sol-gel and spin coating method without introducing any matrix. It was found from the absorbance measurements that the average size of the particles increases from 2.92 nm to 5.86 nm when the heat treatment temperature of the films increase from 60 0C for 10 minutes to 550 0C for 18 hours of treatment, which is in good agreement with the result of 5.90 nm found in XRD measurements of the film heated at 550 oC for 18 hours. The results prove the existence of the quantum confinement effects. It was found an appreciable blue shift of the exciton peak as compared to the band gap of bulk CdS.
Acknowledgments
Financial support from Research Grant of Istanbul Technical University is greatly acknowledged
References
[1] L.E.Brus, Journal of Chemical Physics 80, 4403 (1984).
[2] J. Zhang, F. Jiang, L. Zhang, J. Phys. Chem. B. 108, 7002 (2004).
[3] F. D’Amore, S.M. Pietralunga, P. Lorusso, M. Martinelli, A. Zappettini, E.D. Bo, F. Tassone, P.Tognini, M. Trvagnin, Physica Status Solidi (C) 1, 1001(2004).
[4] A. Podesta`, N. Armani, G. Salviati, N. Romeo, A. Bosio, M. Prato, Thin Solid Films 511 –
512, 448 (2006).
[5] P. Sudhagara, J. H. Junga, S. Parka, R. Sathyamoorthyb, H. Ahnc, Y. S. Kanga,’ Electrochimica Acta 55, 113 (2009).
[6] A. Schüler, M. Python , M. V. del Olmo, E. de Chambrier, Solar Energy 81, 1159 (2007). [7] Y.-J. Shen,Y.-L. Lee, Nanotechnology 19, 045602 (2008).
[8] B. Capoen, A. Martucci, S. Turrell, M. Bouazaoui, Journal of Molecular Structure 651–653, 467 (2003).
[9] M. Guglıelmı, A. Martuccı, E. Menegazzo, G. C. Rıghını , S. Pellı, J. Fıck, G. Vıtrant, Journal of Sol-Gel Science and Technology 8, 1017 (1997).
[10] V.Q. Lam, S. Turrell , A. Martucci , M. Bouazaoui , B. Capoen, Journal of Non-Crystalline Solids 352, 3315 (2006).
[11] S. F. Wuister, A. Meijerink, J. Luminescence 105, 35 (2003).
[12] K.-H. Lee, K.-M. Huang, W.-L. Tseng, T.-C. Chiu, Y.-W. Lin and H.-T. Chang, Langmuir 23, 1435 (2007)
[13] J. Singh, J. E. Whitten, J. Phys. Chem. C 112, 19088 (2008).
[14] D. Yang, B. Paul, W. Xu, Y. Yuan , E. Liu , X. Ke, R. M. Wellard, C. Guo, Y. Xu, Y. Sun , H. Zhu, Water Research 44, 741(2010).
[15] J. Mu, Y. Zhang, Applied Surface Science 252, 7826 (2006).
[16] K. C. Grabar, P. C. Smith, M. D. Musick, J. A. Davis, D. G. Walter, M. A. Jackson, A. P. Guthrie, M. J. Natan, J. Am. Chem. Soc. 118, 1148 (1996).
[17] A. Scott, J.E. Gray-Munro, Thin Solid Films 517, 6809 (2009).
[18] H. Li, W. Y. Shih and Wei-Heng Shih, Nanotechnology 18, 495605 (2007) [19] L.E. Brus, J. Chem. Phys. 79, 5566 (1983).
[20] L. Brus, Journal of Quantum Electronics, 22, 1909(1986). [21] Y. Kayanuma, Solid State Communications, 59, 405 (1986) [22] Y. Kayanuma, Physical Review B 38, 9797 (1988).
[24] JCPD file no Hex 06-0314, Published by Joint Committee on Powder Diffraction Standards, Pennsylvania (1974).
[25] J. Nanda, S. Sapra, D. D. Sarma, Chem. Mater. 12, 1018 (2000).
[26] B. Stuart, Modern Infrared Spectroscopy, John Wiley & Sons, New York, (1996). [27] W. R. Thompson, M. Cai, M. Ho, J. E. Pemberton, Langmuir 13, 2291 (1997). [28] J. Habsuda, G. P. Simon, Y. B. Cheng, D. G. Hewitt, D. A. Lewis, H. Toh , Polymer 43, 4623 (2002)
[29] N. Hebalkar , S. Kharrazi, A. Ethiraj, J. Urban, R. Finkc, S .K. Kulkarni, Journal of Colloid and Interface Science 278, 107 (2004)
[30] R. Brito, V. A. Rodrı́guez, J. Figueroa, C. R. Cabrera, Journal of Electroanalytical Chemistry 520, 47 (2002)
[31] A. G. Hardie, J. J. Dynes, L. M. Kozak and P. M. Huang, Annals of Environmental Science 1, 91 (2007).
[32] E. Tang, H. Liu, L. Sun, European Polymer Journal 43, 4210 (2007)
[33] U. Winkler, D. Eich, Z. H. Chen, R. Fink, S. K. Kulkarni, E. Umbach, Phys. Stat. Sol. (a) 173, 253 (1999).
[34] Y.-M. Sung, K.-S. Park, Y.-J. Lee, T.-G. Kim, J. Phys. Chem. C 111, 1239 (2007) [35] S. K. Apte, B. B. Kale, R. S. Sonawane, S. D. Naik, S. S. Bodhale, B. K. Das, Materials Letters 60, 499 (2006).