FLUORESCENT AEROGEL FILMS FOR TNT
SENSING
A THESIS
SUBMITTED TO THE GRADUATE PROGRAM OF MATERIALS SCIENCE AND NANOTECHNOLOGY
AND THE INSTITUTE OF ENGINEERING AND SCIENCES
OF BILKENT UNIVERSITY
IN PARTIAL FULLFILMENT OF THE REQUIREMENTS
FOR THE DEGREE OF
MASTER OF SCIENCE
By Adem Yildirim
i I certify that I have read this thesis and that in my opinion it is fully
adequate, in scope and in quality, as a thesis for the degree of Master of Science.
Assist. Prof. Dr. Mehmet Bayındır (Supervisor)
I certify that I have read this thesis and that in my opinion it is fully adequate, in scope and in quality, as a thesis for the degree of Master of Science.
Assist. Prof. Dr. Mustafa Özgür Güler (Co-supervisor)
I certify that I have read this thesis and that in my opinion it is fully adequate, in scope and in quality, as a thesis for the degree of Master of Science.
ii I certify that I have read this thesis and that in my opinion it is fully adequate, in scope and in quality, as a thesis for the degree of Master of Science.
Prof. Adil Denizli
Approved for the Institute of Engineering and Sciences:
Prof. Dr. Mehmet B. Baray
iii
ABSTRACT
FLUORESCENT AEROGEL FILMS FOR TNT SENSING
Adem YildirimM.S. in Graduate Program of Materials Science and Nanotechnology
Supervisor: Assist. Prof. Dr. Mehmet Bayındır August 2009
Silica aerogels are unique materials with extraordinary properties such as, high porosity, large surface area and low refractive indices. Due to these properties, they can be applied to a wide range of areas including, insulation, catalyst support, sensors and dielectric materials. However, until know because of their poor mechanical properties and costly production a few applications of aerogels were realized. Ambient pressure drying method is a promising way to produce low cost aerogels and thus expanding the realized application areas of aerogels. This method is based on lowering the surface tension on the gel network, in order to minimize the collapse of the gel during drying. For this purpose gel surface can be modified to make it hydrophobic.
In the first part of this work, ambient pressure production of fluorescent aerogel thin films are described. The produced fluorescent films were
iv characterized to identify their morphological, optical and surface properties. The gel was produced by using methlyltrimethoxysilane (MTMS) to produce hydrophobic gel. A porphyrin derivative (TCPPH2) was simply mixed with the sol before gelation for the fluorescence property. After gelation and aging the produced gels are homogenized and spin coated on glass substrates. The produced films were found to be highly porous (60.3-77.1%), fluorescent and transparent in visible region (82-89%). In the second part, sensing performances of the films were examined by using the common explosive trinitrotoluene (TNT). All films show fluorescence quenching based sensing against TNT exposure. The quenching efficiency of the films is highly thickness dependent. For the thinnest film (120 nm) the quenching efficiency was found to be 8.6% in 10 seconds and for the thickest film (1100 nm) film 2.1% in 10 seconds.
v
ÖZET
TNT TESPİTİ İÇİN FLORESAN AEROGEL İNCE
FİLMLERİN HAZIRLANMASI
Adem Yildirim
Malzeme Bilimi ve Nanoteknolji Yüksek Lisans Programı Yüksek Lisans Tez Yöneticisi: Yar. Doç. Prof. Dr. Mehmet Bayındır
August 2009
Silika aerojeller yüksek boşluk oranı, yüksek yüzey alanı ve çok düşük kırılma indislerinden dolayı eşsiz katı malzemelerdir. Bu özelliklerinden dolayı ısı ve ses yalıtımı, katalizörler, sensörler için destek malzemeleri ve optik yapılar gibi pek çok uygulama alanında kullanılabilecekleri düşünülmektedir. Ancak düşük mekanik özellikleri ve yüksek maliyetlerinden dolayı uygulamaları sınırlı kalmaktadır. Atmosferik koşullarda kurutma tekniği, düşük maliyetli aerojellerin üretilmesi için umut veren bir tekniktir. Bu sayede aerogellerin günlük hayatta kullanım alanlarının artacağı düşünülmektedir. Bu method jel yüzeyinin hidrofobik gruplarla modifiye edilerek kurutma işlemi sırasında oluşan ve jelin çökmesine sebep olan yüzey geriliminin azaltılması prensibine dayanmaktadır.
vi Bu çalışmada ilk olarak atmosferik koşullarda kurutulmuş floresan aerojel ince filmlerin üretim aşamaları başarıyla tamamlanmıştır. Hazırlanan filmlerin morfolojileri, optik özellikleri ve yüzey özellikleri detaylı şekilde karakterize edilmiştir. Metiltrimetoksisilan (MTMS), jele hidrofobik özellik kazandırmak için kullanılmıştır. TCPPH2 floresan molekül olarak kullanılmıştır. Jelleşme gerçekleştikten sonra jel homojenize edilmiş ve cam substratlar üzerine kaplanmıştır. Hazırlanan filmlerin yüksek boşluklu (60.3-77.1%), floresan ve görünür ışıkta transparan (82-89%) oldukları tespit edilmiştir. Çalışmanın ikinci kısmında ise hazırlanan filmlerin algılama özellikleri yaygın bir patlayıcı olan TNT için denemiştir. Hazırlanan bütün filmler için TNT varlığında floresan şiddeti düşmesi gözlemlenmiştir. Filmlerin floresan şiddetlerinde azalmanın kalınlığa duyarlı olduğu gözlemlenmiştir. En ince film için floresan şiddetindeki azalma 10 saniyede %8.6 olarak bulunmuşken en kalın film için bu değer %2.1 olarak bulunmuştur.
Anahtar kelimeler:Aerojel, İnce film, Patlayıcı algılama, Sol-jel method, Silika
vii
ACKNOWLEDGMENTS
First of all, I would like thank my supervisors Mehmet Bayındır and Mustafa Özgür Güler for their guidance and encouragement.
Also I would like to thank Hülya Budunoğlu for her help and friendship. I would like to thank Dr. Hakan Deniz for his contribution at electron microscopy imaging.
I would like to thank all my group members: Dr. Mecit Yaman Dr. Abdullah Tülek, Kemal Gürel, Mert Vural, Murat Kılınç, Yavuz N. Ertaş, Özlem Köylü, Duygu Akbulut, Özlem Şenlik, H. Esat Kondakçı, Ozan Aktaş, Erol Özgür, Can Koral, Tarık Çeber, Ekin Özge Özgür, Ahmet Ünal, Tural Hudiyev, Mehmet Kanık, Serkan Kasırga, Yunus Çetin, Muhammed Çelebi, Y. Emre Akbas and M. Halit Dolaş.
I also would like to thank UNAM engineers, Burkan Kaplan, Mustafa Güler, Emre Tanır and Koray Mızrak.
I wish to give my special thanks to my parents and Gülsu. I especially thank to Gülsu for her encouragement, support and love. I would like to thank my parents for their support and patience.
The financial support from TUBİTAK and TUBA is also gratefully acknowledged.
viii
Table of Contents
Introduction ... 1
Sol-gel Chemistry of Silica ... 4
2.1 Water Silica Systems ... 4
2.2 Effect of pH ... 5
2.2.1 Polymerization between pH 2-7 ... 6
2.2.2 Polymerization above pH 7 ... 6
2.2.3 Polymerization below pH 2 ... 7
2.3 Hydrolysis and Condensation ... 7
2.3.1 General Concepts ... 7
2.3.2 Hydrolysis ... 8
2.3.2.1 Acid Catalyzed Hydrolysis ... 11
2.3.2.1 Base Catalyzed Hydrolysis ... 12
2.3.2.2 Base Catalyzed Condensation ... 13
2.4 Gelation ... 13
2.5 Aging of Gels ... 13
2.6 Drying of Gels ... 16
2.7 Sol-Gel Materials According to Drying Methods ... 17
2.7.1 Xerogels ... 17
2.7.2 Aerogels ... 18
2.7.3 Cryogels ... 18
Aerogels... 19
3.1 Drying methods ... 19
3.1.1 Supercritical Drying Methods ... 20
3.1.1.1 High Temperature Supercritical Drying (HTSCD) ... 20
3.1.1.2 Low Temperature Supercritical Drying (LTSCD) ... 21
ix 3.2 Mechanical Properties ... 23 3.3 Chemistry of Hydrophobicity ... 24 3.4 Hybrid Aerogels ... 24 3.5 Applications of Aerogels ... 25 3.5.1 Thermal Insulation ... 25 3.5.2 Dielectric Materials ... 25 3.5.3 Cherenkov Counters ... 26
3.5.4 Cosmic Dust Collection ... 27
3.5.5 In Catalysis ... 27
Detection of Explosives ... 29
4.1 Explosives ... 29
4.2 Necessity of Explosive Sensors ... 31
Production and Characterization of Fluorescent Aerogel Thin Films ... 35
5.1 Experimental ... 36
5.1.1 Materials ... 36
5.1.2 Synthesis ... 36
5.1.2.1 Hydrophobic Gel Preparation ... 36
5.1.2.2 Aerogel Film Production ... 36
5.1.3 Characterization ... 38
5.1.3.1 Scanning Electron Microscopy (SEM) ... 38
5.1.3.2 Transmission Electron Microscopy (TEM) ... 38
5.1.3.3 Contact Angle Measurements ... 38
5.1.3.4 X-ray photoelectron spectroscopy (XPS) ... 38
5.1.3.5 Ellipsometeric Measurements ... 39
5.1.3.6 Atomic Force Microscopy (AFM) ... 39
5.1.3.7 UV-Visible Spectroscopy (UV-Vis) ... 40
5.2 Results and Discussion ... 41
x
5.2.2 Transmission Electron Microscopy (TEM) ... 42
5.2.3 X-ray photoelectron spectroscopy (XPS) ... 43
5.2.4 Contact Angle Measurements ... 45
5.2.5 Thickness Measurements ... 46
5.2.5.1 Thickness Measurements with Ellipsometer ... 47
5.2.5.2 AFM and Fluorescence Spectroscopy Results ... 48
5.2.6.1 Optical Properties ... 52
5.2.6.1 UV-Visible Spectroscopy (UV-Vis) ... 52
5.2.6.2 Fluorescence Spectroscopy ... 53
5.2.6.3 Transmission Measurements ... 54
5.2.6.4 Refractive Index Measurements... 55
5.2.7 Porosity Measurements ... 56
Sensing Experiments ... 57
6.1 Fluorescence Quenching Experiments with TNT ... 58
6.2 Fluorescence Quenching Experiments with DNT ... 61
6.3 Comparison with Other Sensing Materials ... 64
Conclusion ... 65
xi
List of Figures
Figure 2.1 Polymerization behavior of aqueous silica. Adopted from Ref. [17]. . 5
Figure 2.2 Schematic representation of viscosity during gelation.
Adopted from Ref. [35]. ...14
Figure 2.3 Schematic representation of neck growth. Adopted from Ref. [18] .. 15
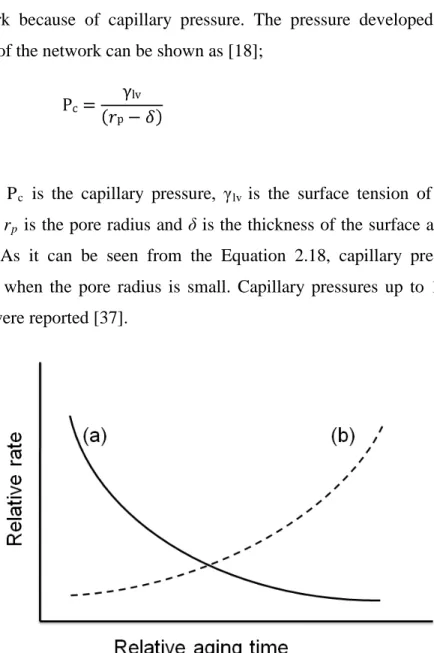
Figure 2.4 Relative aging rates (a) Reprecipitation on to the necks (b)
Repreciritation as larger particles. Adopted from Ref. [36]. ... 16
Figure 2.5 Adopted from Sol-gel drying flowchart (*) the aging and washing
steps are optional. Adopted from Ref. [2]. ... 17
Figure 3.1 Schematic representation of high temperature supercritical drying on
phase diagram. Adopted from Ref. [2]. ... 21
Figure 3.2 Schematic representation of low temperature supercritical drying on
phase diagram. Adopted from Ref. [2]. ... 22
Figure 3.3 Comparison of thermal conductivity of typical aerogels with other
insulation materials. Adopted from Ref. [52]. ... 26
Figure 3.4 Representation of the encapsulation of enzymes in silica aerogels.
Adopted from Ref. [59]. ... 28
Figure 4.1 Classification of explosives according to their performance. Adopted
from Ref. [62]. ... 29
Figure 4.2 Flurescence quenching in porphyrin dyes by electron transfer
mechanism. Adopted from [69] ... 33
Figure 5.1 Schematic diagram aerogel thin film production ... 37
Figure 5.2 SEM micrographs of aerogel thin films. (a,b) AF-1 , (c,d) AF-2 and
xii
Figure 5.3 TEM micrograph of AF-1. ... 42
Figure 5.4 XPS spectrum of AF-1. ... 44
Figure 5.5 Water droplets on aerogel thin films (a) AF-1, (b) AF-2 and (c) AF-3.
... 45
Figure 5.6 Experimental and generated data of ellipsometric measurements (a)
for AF-1, (b) for AF-2, (c) for AF-3. ... 47
Figure 5.7 AFM images of AF-3 (a) tophography (b) 3D image. ... 48
Figure 5.8 Fluorescence intensities of aerogel thin films. ... 49
Figure 5.9 Thicknesses of the films obtained from both methods against dilution
ratio. ... 51
Figure 5.10 The absorption spectra of porphyrin dye (TCPPH2) in ethanol and
aerogel thin film... 52
Figure 5.11 The fluorescence spectra of porphyrin dye (TCPPH2) in ethanol and
aerogel thin film... 53
Figure 5.12 (a) Photographs of aeroegel thin films. (b) tranmission data of
aerogels and glass substrate at visible region. ... 54
Figure 5.13 Refractive indices of aerogel thin films in visible and near infrared
region. ... 55
Figure 6. 1 (a) Schematic illustration of aerogel network upon TNT exposure (b)
Schematic illustration of sensing of TNT with TCPPH2 dye. ... 58
Figure 6.2 Fluorescence quenching experiments with TNT. (a) for AF-1 (b) for
AF-2 (c) for AF-3 ... 59
Figure 6.3 Quenching efficiencies of films with TNT at 15 minute. (the inset
shows first one minute.) ... 60
xiii
Figure 6.5 Quenching efficiencies of AF-3 with TNT and DNT at 15 minute.
xiv
List of Tables
Table 2.1 Physical properties of common precursors. Adopted from Ref. [18] ... 9
Table 2.2 Physical properties of commonly used solvents. Adopted from Ref. [18]. ... 10
Table 4.1 Chemical structure of secondary explosives. Adopted from Ref. [62]. ... 30
Table 4.2 Vapor pressures of common high explosives. Adopted from Ref. [63]. ... 32
Table 5.1 Specifications of prepared films ... 37
Table 5.2 AFM parameters... 39
Table 5.3 XPS results for AF-1 ... 44
Table 5.4 Contact angles of aerogel thin films ... 46
Table 5.5 Ellipsoemtric thickness measurement results for aerogel thin films. .. 48
Table 5.6 Fluorescence and calculated thicknesses of the aerogel films. ... 50
CHAPTER 1 INTRODUCTION
1
Chapter 1
Introduction
Silica aerogels attract too much attention due to their high porosity, large surface area, low refractive indices and generally high optical transparency [1-3]. These properties make them good candidates for various applications such as; insulation, catalyst supports and sensors. On the other hand, because of their poor mechanical properties and costly production only a few applications of aerogels can be realized until now.
Silica aerogels are usually prepared by super critical drying (SCD) of alcogels in order to prevent collapsing of the gel network.Two different drying approaches are often used; i) gels are supercritically dried in their solvents, mostly with alcohols and ii) supercritical CO2 drying (SCCD) The first method is relatively easier. However, it requires high temperatures and pressures, e.g. for methanol, ~243 oC and 79 bar. In the latter method, the gel liquid is first exchanged with liquid CO2 and then super critical drying is performed in mild temperatures (~40 o
Recently ambient pressure drying methods are attracting too much interest. Einarsrud et al. [4] prepared aerogel like materials by strengthening the gel network with the help of washing and aging before drying. Prekash et al. [5] prepared aerogel thin films by modifying the gel network with hydrophobic groups. The hydrophobic groups on the surface prevent both capillary tension and condensation reaction induced shrinkage. This phenomenon is known as the ‘spring back’ effect since the
C) but again at high pressure (~70 bar).
CHAPTER 1 INTRODUCTION
2 gel network first shrinks then recoils to it is initial porous state. Another approach to achieve the spring back effect is to use alkyltrialkoxysilane precursors [6-8]. The time consuming surface modification steps are eliminated with these precursors. Bhagat et al. [6] prepared monolithic superhydrophobic aerogels with methyltrimethoxysilane (MTMS) precursor by using the ambient pressure drying method. However, produced aerogels generally lack optical transparency.
Mild temperatures in SCCD and ambient pressure drying methods enable the preparation of hybrid aerogels. These hybrid materials have potential applications in the fields of heterogeneous catalysts, sensors and LEDs [2,9,10]. Different nano sized dopants like quantum dots (QDs) and metal nanoparticles were mixed with silica aerogels to produce highly porous composite materials with photoluminescence properties [11-13]. However when the dopant is a small molecule, leakage of the dopant from the network during washing and drying cause significant loss in the luminescent properties [2]. To prevent leakage, dopants must be fixed into the silica network by covalent bonds or electrostatic forces. Aerogels with durable luminescent properties were successfully prepared by covalent bonding of the organic dyes to the silica network [14-16]. However, modification of the luminescent molecule for covalent bonding is a time consuming and costly process.
Ambient pressure dried thin films of aerogels can be solution for the above problems. Thin films on substrates can be easily handled and ambient pressure drying can significantly lowers the cost that can expands the application areas.
CHAPTER 1 INTRODUCTION
3 In this thesis, we first report the production of the fluorescent aerogel thin films. A tri-functional monomer (MTMS) was used to provide the gel network hydrophobicity which enables ambient pressure drying. A porphyrin derivative (TCPPH2) was used as to give fluorescence property to the gel. The fluorescent molecule was simply mixed with the sol before gelation. The produced gel was the spin coated on glass substrates. In second part, the sensing performances of produced films were inspected by using a common explosive, trinitrotoluene (TNT) and its major impurity dinitrotoluene (DNT).
CHAPTER 2 SOL-GEL CHEMISTRY OF SILICA
4
Chapter 2
Sol-gel Chemistry of Silica
2.1 Water Silica Systems
Silicic acid solutions slowly thicken and finally become a gel. Even though this reminds the condensation of organic polymers, there is no relationship between silicic acid polymerization and organic polymer condensation [17]. In reality, discrete silica particles from polymerization of silicic acid are formed and these particles are developed the network. Polymerization of silicic acid consist of three steps [18];
(1) Polymerization of monomer to form particles (nucleation). (2) Growth of particles.
(3) Linking of particles to form network (thickening it to a gel).
The nucleation of silicic acid monomers has been examined by 29Si NMR. [19-20] Harris et al. [20] have identified 12 species which are formed at the beginning of silica polymerization. They used moderately concentrated potassium silicate solution and identified some monomers, dimer, trimer, tetramer and hexamer structures.
The 29Si NMR results confirm the mechanism proposed by Ralph K. Iler given above. Once the nuclei formed which are less soluble than smaller particles, further growth is achieved by condensation of smaller particles around nuclei. Growth stops when the solubility difference between particles becomes very small (a few ppm).
CHAPTER 2 SOL-GEL CHEMISTRY OF SILICA
5
Figure 2.1 Polymerization behavior of aqueous silica. Adopted from Ref. [17].
2.2 Effect of pH
The polymerization process can be divided into three pH regions as pH < 2, pH 2-7, pH > 7. [17] Since both isoelectric point and point of zero charge are in the range pH 1-3 for silica pH 2 is the first boundary. Above pH 7 which is the second boundary, surface of the silica particles starts to ionized so the solubility of the particles are increased. Also the net charge of the particles is negative and this results repulsive force between particles so particle growth occurs instead of aggregation and gelation.
CHAPTER 2 SOL-GEL CHEMISTRY OF SILICA
6
2.2.1 Polymerization between pH 2-7
The polymerization mechanism between pH 2 and 7 is supposed as in Equations 2.1 and 2.2. The increasing [OH-] decreases the gelation times that observation confirms the proposed mechanism [17].
- - - - 2.1
- - - - - - 2.2
Dimerization rate is low but once the dimers forms they can easily reacts with monomers and form trimers, tetramers and so on. Growth continues with addition of lower molecular weight particles to higher molecular weight particles by either polymerization or aggregation. Particle growth stops when the particles reach 2-4 nm because of the low solubility of silica in these conditions [18].
2.2.2 Polymerization above pH 7
The same nucleophilic mechanism is valid for (Eqs. 2.1 and 2.2) polymerization of silica above pH 7. Since the particles are partially ionized, growth is primarily provided by monomer addition instead of aggregation. Particles with a diameter of 1-2 nm are formed in a few minutes above that pH.
The high solubility of silica at that pH region the obtained particles are larger. Also in the absence of salts no aggregation occurs because the
CHAPTER 2 SOL-GEL CHEMISTRY OF SILICA
7 particles surfaces are negatively charged and they repel each other. By using this conditions stable sols, highly monodispersed particles can be produced for industrial use [17,21].
2.2.3 Polymerization below pH 2
For polymerization of silica below pH 2 Iler proposed an acid catalyst mechanism.
2.3
- - - 2.4
The solubility of silica below pH 2 is very low. However addition of fluoride ion can increase the solubility of silica. Also at that pH range silica particles generally not are highly ionized. For the reasons above growth occurs together with addition of monomers and the aggregation of particles. Gel network formed by small primary particles with a diameter around 2 nm [17,18].
2.3 Hydrolysis and Condensation
2.3.1 General Concepts
Tetrafuntional alkoxides are often used at silica gel synthesis as precursors [22,23] Table 2.1. Beside trifunctional alkoxides [8,24] and sodium silicate [25] are also used. Polymerization of these precursors includes two steps as hydrolysis and condensation (Eqs 2.5-7).
CHAPTER 2 SOL-GEL CHEMISTRY OF SILICA 8 hydrolysis 2.5 esterification alcohol condensation 2.6 Alcoholysis water condensation 2.7 hydrolysis
At the hydrolysis step (Eq. 2.5), alkoxide groups (OR) replace hydroxyl groups (OH). At condensation step (Eqs. 2.6 and 2.77) siloxane (Si-O-Si) bond is formed. Since water and alkoxysilanes are immiscible to homogenize the mixture another solvent is used, generally alcohols. Also alcohols take part in esterification and alcoholysis reactions [18]. On the other hand, gels can be produced without addition of any homogenizing agent [26]. The most commonly used solvents at polymerization reaction of silica are given in Table 2.2.
2.3.2 Hydrolysis
Hydrolysis of alkoxysilanes was investigated by using labelled water [18]. The only alcohol product is unlabelled alcohol for both acid and base catalyst mechanisms at the end of the reaction.
CHAPTER 2 SOL-GEL CHEMISTRY OF SILICA
9
Table 2.1 Physical properties of common precursors. Adopted from Ref. [18]
Name MW (g/mol) bp (0 Dipole Moment (debyes) C) Tetramethoxysilane (TMOS) 152.2 121 1.71 Tetraethoxysilane (TEOS) 208.3 169 1.63 Tetra-n-propoxysilane 264.4 224 1.48 Methyltrimethoxysilane (MTMS) 136.2 102 1.6 (MeOCH2CH2O)4 328.4 Si Tetrakis(2-methoxyethoxy) silane 115 - Phenyltriethoxysilane 240.4 112 1.85
CHAPTER 2 SOL-GEL CHEMISTRY OF SILICA
10
Table 2.2 Physical properties of commonly used solvents. Adopted from Ref.
[18]. MW (g/mol) bp (0 ρ (g/cm C) 3 η (millipoise) ) µ (debyes) Protic water (H2O) 18.01 100.0 1.000 10.1 1.84 methanol (CH3OH) 32.04 64.5 0.791 5.4 1.70 ethanol (C2H5OH) 46.07 78.3 0.785 10.8 1.69 2-ethoxyethanol (C4H10O2) 90.12 135 0.930 - 2.08 formamide (CH3ON) 45.04 193 1.129 33.0 3.70 Aprotic dimetyhlformamide (C3H7NO) 73.10 152 0.945 7.96 3.86 dioxane (C4H8O2) 88.12 102 1.034 10.87 0 tetrahydrofuran (C4H8O) 72.12 66 0.889 - 1.63
Hydrolysis is very slow in the absence of catalysts and also complete hydrolysis cannot be achieved in these conditions. So generally hydrolysis of alkoxysilanes performed in the presence of catalyst to achieve fast and complete hydrolysis. Mineral acids and ammonia [27,28] mostly used catalysts. Other proven catalysts are acetic acid, KOH, amines, KF, HF,
CHAPTER 2 SOL-GEL CHEMISTRY OF SILICA
11 NH4F and titanium alkoxides [29]. It is well known that mineral acids are more effective than equivalent concentrations of bases.
Another important parameter on hydrolysis reaction rate is the H2
2.3.2.1 Acid Catalyzed Hydrolysis
O : Si ratio (r). From the Equation 2.8, it can be expected that higher r ratios increase the hydrolysis reaction rate. Hydrolysis reactions has been carried out with r ratios between <1 and 25 [18]. Pouxviel et al. [30] performed hydrolysis reactions with r ratios; 0.3, 4, 10. They observed that measurable amount of unhydrolyzed monomer persisted in the reaction mixture after one hour for r = 4 system. However, for r = 10, they found no unhydrolyzed monomers for same time period.
Under acidic conditions, Pohl and Osterholz [31] proposed SN2
mechanism for hydrolysis of reaction. First an alkoxides group is protonated. The protonation step is a rapid. At second step water attacks silicon which becomes more electrophilic after protonation step, this step is slow so rate determining step. At final step an alcohol is removed from the transition state since alcohols are better living groups than water.
CHAPTER 2 SOL-GEL CHEMISTRY OF SILICA
12
2.3.2.1 Base Catalyzed Hydrolysis
Under basic conditions, Pohl and Osterholz [32] propose SN2 mechanism
for hydrolysis reaction. In the first and rapid step hydroxyl anions attacks the silicon atom. Then OH- is substitute with one of the OR- groups with inversion of the silicon tetrahedron.
2.10
2.3.2 Condensation
Siloxane bonds can be formed by either alcohol or water producing condensation polymerization reactions. The condensation reactions can be performed thermally without catalysts. However, using catalysts provides condensation reactions in mild temperature which is necessary for organosilanes [18]. Several catalyst including, mineral acids, ammonia, alkali metal hydroxides and fluorides has been used [33].
2.3.2.1 Acid Catalyzed Condensation
In acid catalyzed mechanism, it is believed that first a silanol group is protonated which is a rapid step. The silicon atom at the protonated species becomes more electrophilic than unprotonated ones. In the second and slow step unprotonated silanol group attacks a silicone of protonated monomer and condensation reaction occurs [18].
CHAPTER 2 SOL-GEL CHEMISTRY OF SILICA 13 2.11 fast 2.12 slow
2.3.2.2 Base Catalyzed Condensation
In base catalyst mechanism, it is mostly accepted that deprotonated silanol attack neutral silicate by nucleophilic mechanism [17]. This step is the slow step and results with siloxane bond formation.
2.13
fast
2.14
Slow
2.4 Gelation
Gelation is the state where all silica particles in the sol connects and form a single giant network. The gelation point of sol-gel silica can be easily observed. At the gelation point solution loses its fluidic properties. On the other hand, it is very difficult to measure the gelation point analytically [34]. The most precise method for identification of gelation process is to measure the viscosity of solution against time. In Figure 2.2 a schematic representation of viscosity of the silica sol with respect to time can be
CHAPTER 2 SOL-GEL CHEMISTRY OF SILICA
14 seen. As it can be seen from the figure a sudden increase in the viscosity is observed near the gelation point [35].
Figure 2.2 Schematic representation of viscosity during gelation. Adopted from
Ref. [35].
2.5 Aging of Gels
The period between gelation and drying steps is called as aging. During aging, condensation reactions between non-polymerized silanol groups continues. Also hydrolysis reactions can occur. Some reactions can take place during aging are as follows [18];
(15)
CHAPTER 2 SOL-GEL CHEMISTRY OF SILICA
15 (17)
During aging two different mechanisms can affect the final structure and properties of the gel; (a) Neck growth by precipitation of dissolved silica to the necks (Fig. 2.3). (b) Larger particle formation by dissolution of small particles and reprecipitation on larger ones. In Figure 2.4, the rates of two mechanisms are illustrated. The neck growth rate decreases and formation of larger particles rate increases with time. By adjusting the time for aging the strength and stiffness of the gels can be improved [3].
CHAPTER 2 SOL-GEL CHEMISTRY OF SILICA
16
2.6 Drying of Gels
Drying of gels under ambient conditions causes the shrinkage of the network because of capillary pressure. The pressure developed on the necks of the network can be shown as [18];
2.18
Where Pc is the capillary pressure, γlv is the surface tension of the gel liquid, rp is the pore radius and δ is the thickness of the surface absorbed
layer. As it can be seen from the Equation 2.18, capillary pressure is higher when the pore radius is small. Capillary pressures up to 100-200 MPa were reported [37].
Figure 2.4 Relative aging rates (a) Reprecipitation on to the necks (b)
CHAPTER 2 SOL-GEL CHEMISTRY OF SILICA
17
2.7 Sol-Gel Materials According to Drying Methods
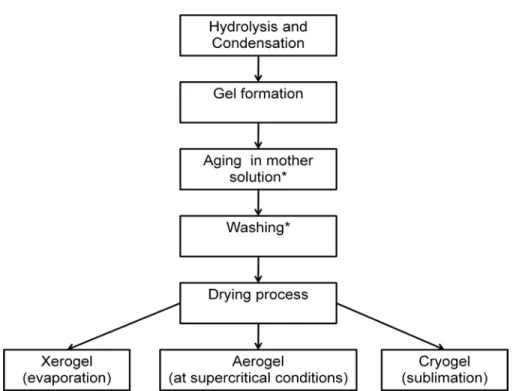
According to performed drying methods sol-gel materials can be classified in three groups as xerogels, aerogels and cryogels (Fig. 2.5).
Figure 2.5 Adopted from Sol-gel drying flowchart (*) the aging and washing
steps are optional. Adopted from Ref. [2].
2.7.1 Xerogels
If the gel liquid is removed by evaporation at ambient pressures the capillary pressure causes the collapse of the gel network but still the materials have some pores. These dense and the glassy materials are called as xerogels. To prevent cracking the slow drying process is often performed [1,3].
CHAPTER 2 SOL-GEL CHEMISTRY OF SILICA
18
2.6.2 Aerogels
As it can be seen from Equation 2.18, eliminating surface tension is also eliminates capillary pressure. For this purpose, drying is performed at super critical conditions, where liquid-vapor interface doesn’t exist. Since there is no capillary pressure, gel liquid can be extracted with small or no collapsing. These highly porous materials called as aerogels. Detailed information about aerogel is given in chapter 3.
2.7.3 Cryogels
Another way to eliminate the liquid-vapor interface is the drying with sublimation. In this method, first gel liquid is frozen and then dried under vacuum. The obtained materials called cryogels [1]. The porosity of the cryogels is between xerogels and aerogels.
CHAPTER 3 AEROGELS
19
Chapter 3
Aerogels
Silica aerogels are unique materials with extraordinary properties such as, high porosity, large surface area, low refractive indices, low density, ultra low dielectric constants and generally high optical transparency [1-3]. These properties result from their 3D network structure with up to 99.9% [38] trapped air inside.
The first aerogel was prepared by Kistler in 1931 [39]. He dried the gel under supercritical conditions of solvent in order to prevent collapsing of the gel network, which is induced by surface tension forces created due to the vapor liquid interface during drying. However, aerogels have seen little interest until last two decades after that invention. The properties above mentioned make the aerogels good candidates for several applications; thermal and acoustic insulation, dielectric materials, catalytic supports, supercapacitors and in life sciences [2]. On the other hand, only a few applications of aerogels can be realized until know. Monolithic aerogels have been widely used in Cherenkov radiation detectors [40]. Furthermore, they have been used for cosmic dust collection [41].
3.1 Drying methods
Aerogels are conventionally dried at supercritical conditions in which the gel liquid extracted from the pores above supercritical temperature and pressure conditions of the solvent. Otherwise the gel network collapsed due to capillary pressure. The capillary pressure during drying is
CHAPTER 3 AEROGELS
20 enormous and can be reaching 200 MPa [37]. Recently, ambient pressure drying methods are also established as alternative to supercritical drying methods [5,6]. Ambient pressure drying methods are very promising for mass production of aerogels since the cost can be lowered and ambient conditions provides easier process control.
3.1.1 Supercritical Drying Methods
Supercritical drying (SCD) methods can be divided into two according to the drying temperature as high temperature super critical drying (HTSCD) and low temperature super critical drying (LTSCD).
3.1.1.1 High Temperature Supercritical Drying (HTSCD)
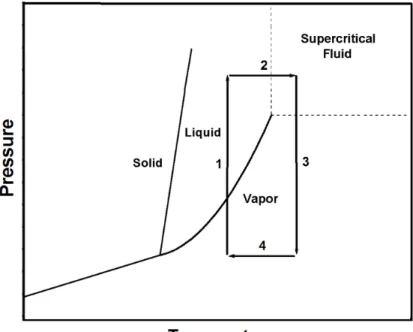
HTSCD method was used for production of first aerogels by Kistler [39]. This method is still widely used. The method is carried out by placing the wet gel into the closed container with sufficient amount of gel solvent. Then container is slowly heated to the supercritical conditions and after the diffusion of supercritical solvent into the pores of silica network is completed and supercritical solvent is slowly purged at constant temperature. When pressure of vessel reaches the ambient pressure, the vessel is cooled to room temperature. HTSCD method is schematically represented in Figure 3.1. As it can be seen from the Figure 3.1 liquid and gas boundary is not crossed so capillary pressure doesn’t occur.CHAPTER 3 AEROGELS
21
Figure 3.1 Schematic representation of high temperature supercritical drying on
phase diagram. Adopted from Ref. [2].
The high temperatures induce rearrangement reactions in the gel network at this method. At these conditions aerogel surface is covered by alkoxy groups and resulting hydrophobic gel. That makes the aerogel stable against moisture [42].
3.1.1.2 Low Temperature Supercritical Drying (LTSCD)
LTSCD method was first suggested for silica aerogels in 1985 by Tewari et al. [43]. Liquid carbon dioxide (CO2) is generally used since its critical temperature is near room temperature (304 K). LTSCD method is schematically represented in Figure 3.2. Different from HTSCD, theCHAPTER 3 AEROGELS
22 network filling solvent must exchange with liquid CO2 before drying at LTSCD. This step is critical since insufficient exchange of liquids may cause collapsing of the gel network. In order to predict the desired time for extraction, Novak et al. [44] determined diffusion coefficients for water-methanol-liquid CO2 and methanol supercritical CO2 systems. However, it is still difficult to predict the desired time. If the diffusion time is not enough, an opaque area inside the gel is observed where the network is collapsed [45]. For LTSCD method obtained aerogels, surfaces are hydrophilic because of the low temperature.
Figure 3.2 Schematic representation of low temperature supercritical drying on
CHAPTER 3 AEROGELS
23
3.1.2 Ambient Pressure Drying (APD)
Ambient pressure drying methods are very promising for industrial production. Einarsrud et al. [4] prepared aerogel like materials at ambient conditions by strengthening the gel network with the help of washing and aging before drying. Prekash et al. [5] prepared aerogel thin films by modifying the gel network with hydrophobic groups. The hydrophobic groups on the surface prevent both capillary tension and condensation reaction induced shrinkage. This phenomenon is known as the ‘spring back’ effect since the gel network first shrinks then recoils to it is initial porous state. Another approach to achieve the spring back effect is to use alkyltrialkoxysilane precursors [6-8].
3.1.3 Freeze Drying
Freeze drying is another method for preparation of aerogels where the phase boundary between liquid and vapor doesn’t exist. In this method, first gel solvent first frozen and then dried by sublimation under vacuum [46]. The obtained materials are also called cryogels. The produced aerogels have lowered surface area and porosities compared to their equivalents produced by SCD methods. Also the network of the aerogels is destroyed by growth of solvent crystals which produce very large pores.
3.2 Mechanical Properties
The high porosity of aerogel provides them extraordinary properties as mentioned at the beginning of the chapter. However, the high porosity also makes the skeleton very thin and makes the aerogels very brittle [8]. To increase the application areas of the aerogels, the main goal is reinforcing
CHAPTER 3 AEROGELS
24 the mechanical properties of aerogels without losing their main properties. For this purpose many attempts were performed to improve the mechanical properties such as; aging and washing [47], crosslinking with polymers [48,49] and mixing with dopants [50]. Another approach to obtain improved mechanical properties is to use alkyltrialkoxysilane precursors. Rao et al. [51] were prepared flexible aerogels by using MTMS precursor with two step acid and base catalyst mechanism. However, obtained aerogels were opaque. Kanomori et al. [8] were prepared highly transparent and mechanically improved aerogels by using same precursor at the presence of surfactant molecules.
3.3 Chemistry of Hydrophobicity
Surface hydrophobicity is another important issue in order to use the aerogels in a sustainable manner. When the surface of the network particles are hydrophilic, humidity of air can cause further condensation between particles and results collapse of the network. The methods to make the surface of aerogels were mentioned in Section 3.2.2.
3.4 Hybrid Aerogels
Silica aerogels were modified with a variety of dopants either with physical or covalent binding. N. Leventis and coworkers modified aerogel network covalently by using many organic polymers [48-50]. They found that the mechanical properties increases even more than 2 fold but the density increases also nearly 3 folds [48]. Meador et al. [50] reinforced the network with carbon nanofibers and they also have been observed improvement in mechanical properties. Besides, many hybrid aerogels
CHAPTER 3 AEROGELS
25 were produced with photoluminescent and catalytic properties. Morris et al. [12] produced modified aerogels with gold, titania, zeolite, platinum nanoparticles by simply mixing the particles with the gel. Sorensen et al. [11] modified the aerogels with CdSe QDs. They produced highly transparent luminescent aerogels monoliths with stable photoluminescent properties for a long time period.
3.5 Applications of Aerogels
3.5.1 Thermal Insulation
Aerogels are materials with very good thermal insulation properties. Also they can be very transparent which is important in window insulation applications [2]. For a standard aerogel with a density of 150 kg m-3, thermal conductivity is around 15 mW m-1 K-1
3.5.2 Dielectric Materials
. This value is remarkably lower than thermal conductivities of polyurethane foams and mineral wool (Fig. 3.3) [52]. However, they haven’t been used in thermal insulation applications except some special applications. The main restrictions are the insufficient mechanical properties and expensive production methods.
Aerogel thin films are good dielectric materials since they are highly porous. Aerogel films up to 98.5% porosity [5] and with dielectric constants of 1.1[53] were produced before. It is proposed that the computer speeds can be increased more than 2 fold by using them [54].
CHAPTER 3 AEROGELS
26
Figure 3.3 Comparison of thermal conductivity of typical aerogels with other
insulation materials. Adopted from Ref. [52].
3.5.3 Cherenkov Counters
Teicher and coworkers [55] used aerogels in Cherenkov Counters which are used for electrically charged particle identification. Cherenkov Counters need transparent and low refractive index materials to collect the particles. Before aerogels compressed gasses and cryogenic liquids were used. Aerogels were easily replace with these materials since they are solid so much easier to work with [56].
CHAPTER 3 AEROGELS
27
3.5.4 Cosmic Dust Collection
Cosmic dust, which is consisting of small particles with dimensions of the order of microns, collection aroused considerable interest for planetary scientists. These small particles travel at the space with a speed of many tens of kilometers per second. It is important to capture these particles without melting due to high speeds. Laboratory tests show that cosmic dust particles can be collect by monolithic aerogels [41] and an aerogel collector was used on the NASA Stardust spacecraft [57].
3.5.5 In Catalysis
Silica aerogel can be perfect support materials in catalysis since they have high surface area and meso and macroporosity. Also they are inert and stable up to 1000 0
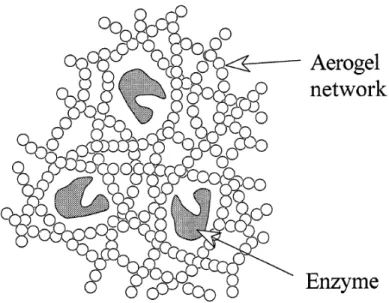
Aerogels are good supports for enzymes since the pore sizes of aerogels and sizes of enzymes are comparable. Buisson et al. [59,60] encapsulated the Pseudomonas cepacia lipase into the silica aerogel network (Figure 3.4). They also tested the prepared materials in the reaction of esterification of lauric acid by 1-octanol. Power et al. [61] successfully prepared aerogel biosensors for detection of Escherischia coli and green C. However at that high temperature chemical reactions between support and active sides generally are occur. [2] Bonnet et al. [10] prepared porphyrin doped aerogels for epoxidation of olefins. Yu et al. [58] prepared aerogel coated metal particles and tested the catalytic effect with butane.
CHAPTER 3 AEROGELS
28 fluorescence protein (GFP). According to these two experiments it can be said that silica aerogel are biocompatible [2].
Figure 3.4 Representation of the encapsulation of enzymes in silica aerogels.
CHAPTER 4 DETECTION OF EXPLOSIVES
29
Chapter 4
Detection of Explosives
4.1 Explosives
Explosives are unstable materials which undergo very rapid decomposition by an ignition. The rapid decomposition results large amount of heat libration or/and sudden pressure increase.
Explosives mainly classified as low and high explosives with respect to their decomposition rates. The decomposition of low explosives is called burning or deflagration and their burning velocities are around cm/s values. For high explosives burning velocities are higher (km/s) and called as detonation. High explosives are further subdivided into two groups as primary and secondary explosives.
Figure 4.1 Classification of explosives according to their performance. Adopted
CHAPTER 4 DETECTION OF EXPLOSIVES
30 Primary explosives are highly unstable so they can easily explode by a small initiation. They are also known as initiating explosives since they can be used to initiate the secondary explosives. Compared to primary explosives, secondary explosives are more stable so their handling is easier [62]. Secondary explosives are also main components of both military and industrial explosives. According to chemical structure secondary explosives can be divided into six groups (Table 4.1). They are mostly nitro (NO2
Table 4.1 Chemical structure of secondary explosives. Adopted from Ref. [62]. ) groups containing organic molecules [62].
Compound class Example Symbol Aliphatic nitro Nitromethane
Hydrazine nitrate
- - Aromatic nitro (C-NO2 Nitrobenzene
2,4,6-trinitrotoluene 2,4-dinitrotoluene
) NB
TNT DNT Nitrate ester (C-O-NO2 Nitroglycerine
Ethylene glycol dinitrate Pentaerythitol tetranitrate
) NG
EDGN PETN Nitramines (C-N-NO2 Trinitro-triazacyclohexane
Tetranitro-tetraazcyclooctane Tetranitro-N-Methylaniline
) RDX
HMX Tetryl Acid salts (NH4+ Potassium nitrate
Ammonium nitrate
) -
AN Peroxides (C-O-O-C) Triacetone triperoxide TATP
CHAPTER 4 DETECTION OF EXPLOSIVES
31
4.2 Necessity of Explosive Sensors
Explosives can be easily produced and they may cause serious damage, so detecting them before they are used is very important. The available methods such as using metal detectors, trained dogs are often insufficient or expensive. Other techniques like Ion Mobility Spectrometry (IMS), which is the mostly used system for explosive detection at airports are hardly portable [62,63]. Besides, buried land mines are important problem because there are 120 million of them buried in the world causing 30,000 injuries and casualties, 80% of which are civilians [63]. Another concern about explosives is their serious risks on health and nature. Explosives can be released environment from military bases and ammunition plants. Acute exposures of them can cause methemoglobin and chronic exposures cause anemia and liver damage [62]. In 1950s anemia deaths was reported at TNT workers [64]. The TNT concentration above 2 ng ml-1
The work on explosive detection at vapor phase mostly focused on TNT (and less on RDX and PETN) because it has relatively high vapor pressure in water has been classified as toxic by Environmental Protection Agency [65]. To solve the problems above, portable, cheap and reliable sensing devices are required for both detection from vapor phase and water.
This work was focused on vapor phase detection of explosives; vapor pressures of some explosives are given in Table 2. Generally explosives have low vapor pressures (e.g. at 300K for TNT 13 ppb and for RDX 0.0084 ppb ). Their vapor pressures can be further reduced by good sealing. The reduction of vapor pressure of them by a factor of 1000 was reported by sealing in plastic [66]. Therefore, high sensitivity is needed.
CHAPTER 4 DETECTION OF EXPLOSIVES
32 and it is very common explosive (it is estimated that 80% of landmines include TNT [67]). Also some work focused on volatile tagging molecules of commercial explosives e.g. ethyleneglycol dinitrate (EGDN), mononitrotoluene and dimethyldinitrobutane (DMNB).
Table 4.2 Vapor pressures of common high explosives. Adopted from Ref. [63].
Vapor Pressure at 300 K (ppb) Vapor Pressure at 400 K (ppb) EDGN 1.2 × 10⁵ Explodes at 387 K NG 740 5.1 × 10 TNT 6 13 4.7 × 10 RDX 5 0.0084 2.1 × 10 PETN 3 0.026 2.8 × 10⁴
4.3 Fluorescent based sensing of Explosives
In fluorescence sensor design, fluorescence life time, intensity and energy transfer can be used as output. Fluorescence sensors are highly sensitive and sometimes sensitivity reaches the detection of single molecule in fluorescence spectroscopy methods. Also fluorescence based sensors doesn’t consume analytes and no reference is needed [68].
CHAPTER 4 DETECTION OF EXPLOSIVES
33
Figure 4.2 Flurescence quenching in porphyrin dyes by electron transfer
mechanism. Adopted from [69]
Fluorescence detection of explosives is mostly based on excited electron transfer from fluorophore to the explosive molecule (Fig 4.2). Fluorescence based sensing of explosives attracts attention due to their potential on developing simple, low-cost, sensitive and portable sensing devices. Thus many materials have been reported. Some examples are conjugated polymers [70-75], nanofibril films [76], porous silicon [77], monolayer films [78], molecular imprinted conjugated polymers [79] and porphyrin doped mesoporous silicas [69, 80, 81].
Swager et al. [73] prepared first conjugated polymer based sensors for TNT and DNT. After that preliminary work many conjugated polymer based sensors were prepared. However, conjugated polymer based sensors are lack of optical stability in atmospheric conditions [80] and analyte diffusion through the film is slow and since films are nonporous. To increase the sensitivity of conjugated polymer sensors Levitsky et al. [77]
CHAPTER 4 DETECTION OF EXPLOSIVES
34 prepared conjugated polymer porous silicon microcavity devices and they reached 30% quenching in 10 seconds for TNT. Rose et al. [82] observed 30 fold sensitivity gains with lasing action on conjugated polymer coated optical fibers. Naddo et al. [76] prepared fluorescent nanofibril films. These films are highly fluorescent and highly porous compared to conjugated polymers and over 40% fluorescence quenching was observed.
Alternative to these organic molecules, organic-inorganic materials are prepared. Tao et al. [80] prepared porphyrin doped mesoporous silica sensors. The silica matrix gives the material optical stability and mesopores increase the diffusion of analyte into the film. They reached quenching efficiencies up to 56% in 10 s which is nearly two times higher than conjugated polymers.
CHAPTER 5 PRODUCTION AND CHARACTERIZATION OF FLUORESCENT AEROGEL THIN FILMS
35
Chapter 5
Production and Characterization of
Fluorescent Aerogel Thin Films
The potential applications of aerogel thin films such as dielectric materials, anti-refractive coatings, sensors, catalyst supports and flat panel displays are pointed out by Prekash et al. [5]. On the other hand, to date a limited number of works have been reported. Aerogel thin films as dielectrics, antireflective coatings, anticorrosion materials and humidity sensors were produced by either ambient pressure drying [5, 35, 83]or SCCD methods [84-86].
In this chapter, we report the fabrication of fluorescent aerogel thin films. Hydrophobic fluorescent aerogel thin films were prepared from methyltrimethoxysilane (MTMS) precursor and a porphyrin derivative, meso-tetrakis-p-carboxyphenylporphyrin (TCPPH2) dye. Since the aerogels were dried at ambient temperature and pressure, no washing step is required and TCPPH2
The films were characterized by using scanning electron, transmission electron and atomic force microscopes in order to identify their morphology. UV-vis and fluorescence spectrophotometers and an ellipsometer were used in order to identify their optical properties. Also a molecules were simply mixed with the prepared sol before gelation. Thus no modification of the fluorescent molecule to fix it to the silica network is necessary.
CHAPTER 5 PRODUCTION AND CHARACTERIZATION OF FLUORESCENT AEROGEL THIN FILMS
36 contact angle meter and an X-ray photoelectron spectroscopewere used in order to identify surface properties.
5.1 Experimental
5.1.1 Materials
Methanol, ammonium hydroxide, oxalic acid and MTMS were purchased from Sigma-Aldrich (USA). TCPPH2
5.1.2 Synthesis
was purchased from Frontier Scientific (USA). All of the chemicals were used as received.
5.1.2.1 Hydrophobic Gel Preparation
In a standard procedure; 2 ml of MTMS, 7.8ml of methanol and 0.6 ml of 0.1 M oxalic acid was mixed and stirred for 30 min at room temperature. After 24 h hydrolysis, 0.8 ml ammonium hydroxide (26% in water) was added to catalyze the condensation reaction and stirred for 15 min at room temperature. During stirring, 0.07 mg of TCPPH2 is dissolved in 0.5 ml methanol and added to the reaction solution. Final molar ratios of MTMS, methanol, water and TCPPH2 were 1:14.9:4.8:1×10⁻⁶
5.1.2.2 Aerogel Film Production
respectively. Finally reaction mixture was left off for 3 days for gelation and aging at RT
The hydrophobic alcogel was diluted with 10 ml of methanol and homogenized with an ultrasonic homogenizer for 45 seconds at 20 watts. The microscope glass slides (1.5 cm × 2.5 cm) were cleaned in ultrasonic cleaner for 15 minute with ethanol. Finally prepared sol was coated on the
CHAPTER 5 PRODUCTION AND CHARACTERIZATION OF FLUORESCENT AEROGEL THIN FILMS
37 glass substrates with spin coating at a rate of 2000 rpm. Prepared aerogel films are dried at room temperature over night.
Figure 5.1 Schematic diagram aerogel thin film production
Three different films were prepared with by different dilution ratios of homogenized sol. The AF in the abbreviation indicates the aerogel film. Names and dilution ratios of the films are given in Table 5.1.
Table 5.1 Specifications of prepared films
Name Dilution ratio of homogenized sol with methanol (v/v)
AF-1 -
AF-2 1 to 3 AF-3 1 to 5
CHAPTER 5 PRODUCTION AND CHARACTERIZATION OF FLUORESCENT AEROGEL THIN FILMS
38
5.1.3 Characterization
5.1.3.1 Scanning Electron Microscopy (SEM)
SEM images were taken with FEI Quanta 200F ESEM microscope at low vacuum conditions from the films on the glass subtrates.
5.1.3.2 Transmission Electron Microscopy (TEM)
TEM bright-field images were taken using a FEI Tecnai G2 F30 microscope. TEM samples were prepared by scratching off aerogel thin films from the surface and dispersed in ethanol. A drop of solution was placed on a holey carbon coated copper grid. Then the grid was dried at soom temperature (RT) and images were taken at 200 kV.
5.1.3.3 Contact Angle Measurements
A contact angle meter (OCA 30, Dataphysics) was used to measure the water contact angles on the aerogel thin films. Water droplets of 0.4 µL volume were used and Laplace-Young fitting was applied on contact angle measurements.
5.1.3.4 X-ray photoelectron spectroscopy (XPS)
Chemical analysis of the surface was performed using an X-ray photoelectron spectroscopy (XPS, K-Alpha, Thermo Scientific). XPS measurements were performed from the surfaces of aerogel thin film coated glass substrates. The data was collected at survey mode (between
CHAPTER 5 PRODUCTION AND CHARACTERIZATION OF FLUORESCENT AEROGEL THIN FILMS
39 binding energies of 0-1300 eV). The flood gun was operated to prevent charging.
5.1.3.5 Ellipsometeric Measurements
Ellipsometeric measurements were performed by using J.A. Woolam V-Vase Ellipsometer. The measurement are performed between 400 to 1700 nm. The experimental results were fitted by using cauchy method (Eq. 1) since films are transperent. The fit calculation were performed by using V-vase32 software.
5.1
Where; Nn is refractive index and An (dimensionless), Bn (µm2), Cn (µm4
5.1.3.6 Atomic Force Microscopy (AFM)
) are Cauchy parameters.
AFM tophograpy images were taken with PSIA XE-100E microscope at non-contact mode from the films on the glass subtrates. The used parameter are given in Table 4.2.
Table 5.2 AFM parameters
Parameter Value Parameter Value Data width 154 (pxl) Y scan size 15.04 (µm) Data height 154 (pxl) Scan rate 0.54 (Hz) X scan size 15.04 (µm) Set point -1.22 (µm)
CHAPTER 5 PRODUCTION AND CHARACTERIZATION OF FLUORESCENT AEROGEL THIN FILMS
40
5.1.3.7 UV-Visible Spectroscopy (UV-Vis)
UV-Vis spectra were recorded by Varian Carry100 spectrophotometer between the 300 and 800 nm. For absortion measurents Dye solutions were placed in quartz cuvettes and then measurements were performed. For absorption measurements of thin films, homogenized sol was spin coated at 2000 rpm for four times on glass substrate. The prepared film and a uncoated glass then placed on a solid sample holders and measurements were performed. Transmission measurements were also performed with the solid sample holders.
5.1.3.8 Fluorescence Spectroscopy
Fluorescence spectra were recorded by Varian Carry Eclipse spectrophotometer between 600 and 750 nm at a excitation wavelength of 420 nm. Dye solutions were placed in quartz cuvettes and then measurements were performed. For fluorescence measurements of thin films, prepared films were placed on a solid smaple holder at angle of 450 then the measurement were performed.
CHAPTER 5 PRODUCTION AND CHARACTERIZATION OF FLUORESCENT AEROGEL THIN FILMS
41
5.2 Results and Discussion
5.2.1 Scanning Electron Microscopy (SEM)
Figure 5.2 SEM micrographs of aerogel thin films. (a,b) AF-1 , (c,d) AF-2 and
CHAPTER 5 PRODUCTION AND CHARACTERIZATION OF FLUORESCENT AEROGEL THIN FILMS
42 Scanning electron microscope (SEM) images (Fig. 5.2) demonstrates the aerogel thin film formation with macro and mesoporous structures. From the closer images mesopores can be clearly seen. Mesoporosity doesn’t affect from the dilution ratio however, macroporosity increases with increasing dilution ratio. The aerogel domains are distributed sparsely on the glass substrate for the high dilution ratio (AF-3) compared to uniform thin film formation in AF-1 (Fig. 5.2-e). The non-uniform film formation is because of the low silica concentration in the diluted sol.
5.2.2 Transmission Electron Microscopy (TEM)
CHAPTER 5 PRODUCTION AND CHARACTERIZATION OF FLUORESCENT AEROGEL THIN FILMS
43 The TEM image in Figure 5.3 demonstrates the formation of different sized pores in meso and macro range. The random sized pores roughly in the range of 10-100 nm can be seen from the Figure 5.3. The wall thicknesses are around 10 nm.
The high porosity provides fast diffusion of the analyte molecules through the film and accelerates the sensing. Wall thickness is as important parameter as the pore diameter for sensing applications. When the walls of the aerogel network are thin the analyte diffusion in silica completes in a short time. Also when the walls are thinner the surface area of the aerogel network can be expected higher which increases the number of the sensing molecules which are close to the surface of the silica network. Thus, it can be said the prepared films are suitable materials for rapid sensing applications in vapor phase.
5.2.3 X-ray photoelectron spectroscopy (XPS)
The surface of aerogel thin films are expected as mainly composed of oxygen, silicon, carbon and hydrogen atoms. In Figure 5.4, XPS results for AF-1 can be seen. Three peaks were identified, the peaks at 529 eV, 282 eV and 99 eV comes up to binding energies of 1s electron of oxygen, 1s electron of carbon and 2p of silicon respectively. The percentages of the atoms were found to be; for oxygen 40.89%, for carbon 25.55% and for silicon 33.57%.
CHAPTER 5 PRODUCTION AND CHARACTERIZATION OF FLUORESCENT AEROGEL THIN FILMS
44
Figure 5.4 XPS spectrum of AF-1.
The binding energies and the percentages for oxygen, carbon and silicon are summarized in Table 5.3. The high percentage of the carbon originates from the MTMS monomer. The high carbon content at the surface makes the surface hydrophobic. That confirms the contact angle measurements.
Table 5.3 XPS results for AF-1
Binding Energy (eV) Percentage (%) Oxygen (1s) 529.09 40.89
Silicon (2p) 99.26 33.57 Carbon (1s) 281.57 25.55
CHAPTER 5 PRODUCTION AND CHARACTERIZATION OF FLUORESCENT AEROGEL THIN FILMS
45
5.2.4 Contact Angle Measurements
As seen from Figure 4.5 and Table 4.4 all the films are hydrophobic. The hydrophobicity of aerogel films results from -CH3 groups directed to the surface and from the surface roughness. The surface roughnesses of the films can be observed from the AFM (figure) and SEM images (figure).
CHAPTER 5 PRODUCTION AND CHARACTERIZATION OF FLUORESCENT AEROGEL THIN FILMS
46
Table 5.4 Contact angles of aerogel thin films
Film Contact Angle AF-1 147.10
AF-2 138.3
AF-3
0
120.50
However, contact angle values decreases with the increasing dilution ratio (for AF-1 147.10 and for AF-3 120.30
5.2.5 Thickness Measurements
). This may be because of the higher macroporosity at higher dilution rations. The high macroporosity increases the water and glass substrate interaction and results the decrease in contact angle of the films.
The hydrophobicity of the surface provides stability against moisture. This property makes those materials stable at atmospheric conditions.
Various aerogel thin films with different thicknesses were produced by diluting the homogenized gel with methanol. Three films were produced with different dilution ratios. Average thicknesses of the films were determined by using two different methods. i) With an ellipsometer using spectroscopic reflection measurements. ii) by using atomic force microscope (AFM) together with fluorescence measurements.
CHAPTER 5 PRODUCTION AND CHARACTERIZATION OF FLUORESCENT AEROGEL THIN FILMS
47
5.2.5.1 Thickness Measurements with Ellipsometer
In Figure 5.6 the experimental results obtained from ellipsometric measurement are shown. Also generated datas can be seen from the same graphs.
Figure 5.6 Experimental and generated data of ellipsometric measurements (a)
for AF-1, (b) for AF-2, (c) for AF-3.
The generated and experimental datas were fit well especially for higher wavelengths. This may be because of the scattering from the aerogel
CHAPTER 5 PRODUCTION AND CHARACTERIZATION OF FLUORESCENT AEROGEL THIN FILMS
48 surface. At low wavelengths scattering is more serious because of the wavelength and macropore sizes become comparable. The average film thicknesses and mean squared errors are summirized in Table 5.5.
Table 5.5 Ellipsoemtric thickness measurement results for aerogel thin films.
Name Thickness (nm) Mean Squared Error (MSE) AF-1 1132.90 ± 1.21 6.198 AF-2 245.76 ± 5.60 6.694 AF-3 119.58 ± 0.56 3.966
5.2.5.2 AFM and Fluorescence Spectroscopy Results
CHAPTER 5 PRODUCTION AND CHARACTERIZATION OF FLUORESCENT AEROGEL THIN FILMS
49 The AFM images (Fig. 5.7) show the highly porous surface of the AF-3. The AFM images and SEM images (Fig. 5.2) are compatible. Based on the AFM image the average thickness of AF-3 is calculated as 129 nm. The average thickness was calculated by using XEI software.
Figure 5.8 Fluorescence intensities of aerogel thin films.
In Figure 5.8 the fluorescence intensities can be seen. All spectrums were obtained for films on same sized glass substrates by using a solid sample holder. The angle between sample and the light source 450 for all measurements.
CHAPTER 5 PRODUCTION AND CHARACTERIZATION OF FLUORESCENT AEROGEL THIN FILMS
50 By using thickness value calculated from AFM image, other film thicknesses were calculated using the ratio of fluorescence intensities (Fig. 5.8). The fluorescence intensities are decreases with increasing dilution ratio as it can be expected. This approximation is valid since dye concentration in the films was sufficiently low (absorbance of the dye obeys Beer’s law) and films were thin [76]. The calculated thicknesses of the films are given in Table 5.6.
Table 5.6 Fluorescence and calculated thicknesses of the aerogel films.
Name Fluorescence Intensity (a.u.) Calculated Thickness (nm) AF-1 124.8 1083 AF-2 27.3 238 AF-3 14.8 129
The average thicknesses of the films measured by both methods are comparable with each other. As expected, average thicknesses of films decreases with increasing dilution. It can be said that for AF-1 film thickness is around 1.1 µm, for AF-2 around 240 nm and for AF-3 around 120 nm.
CHAPTER 5 PRODUCTION AND CHARACTERIZATION OF FLUORESCENT AEROGEL THIN FILMS
51
Figure 5.9 Thicknesses of the films obtained from both methods against dilution
ratio.
The relation between dilution ratios and average film thicknesses are given in Figure 5.9. The results obtained from both methods are fairly linear. These may be because of the film thickness in not affected only from the silica concentration in the sol but also the viscosity of the sol. For homogenized sol when no dilution is performed, it is observed that sol is very viscous. Diluting the sol with methanol significantly lowers the viscosity of the sol.
CHAPTER 5 PRODUCTION AND CHARACTERIZATION OF FLUORESCENT AEROGEL THIN FILMS
52
5.2.6 Optical Properties
5.2.6.1 UV-Visible Spectroscopy (UV-Vis)
Figure 5.10 The absorption spectra of porphyrin dye (TCPPH2) in ethanol and
aerogel thin film.
The absorption spectra of porphyrin dye in ethanol solution and in aerogel film are shown in Figure 5.10. All spectra are normalized. The strong characteristic absorption peak of TCPPH2 dye at 420 nm can be observed for both solution and aerogel thin film. However, the weaker absorption peaks at 512, 548 and 589 nm cannot be observed in the aerogel thin film. This is because of the low absorption of film because of low dye
CHAPTER 5 PRODUCTION AND CHARACTERIZATION OF FLUORESCENT AEROGEL THIN FILMS
53 concentration and low thickness. The absorption peaks at 420 nm confirms the incorporation of the dye molecules into the dye films.
5.2.6.2 Fluorescence Spectroscopy
Figure 5.11 The fluorescence spectra of porphyrin dye (TCPPH2) in ethanol and
aerogel thin film.
The spectra of porphyrin dye in ethanol and in aerogel film are similar which confirms the incorporation of the dye molecules in the silica network. There is a red shift approximately 3 nm in the fluorescence maximum for dye in aerogel thin film. This may be because of the aggregation of the dye molecules. However, the shift of fluorescence maximum is small so it can be said that there isn’t significant aggregation.
CHAPTER 5 PRODUCTION AND CHARACTERIZATION OF FLUORESCENT AEROGEL THIN FILMS
54
5.2.6.3 Transmission Measurements
Figure 5.12 (a) Photographs of aeroegel thin films. (b) tranmission data of
aerogels and glass substrate at visible region.
Transparency of the aerogel films is critical for optical applications. The bulk aerogels prepared by the above described method are opaque.
CHAPTER 5 PRODUCTION AND CHARACTERIZATION OF FLUORESCENT AEROGEL THIN FILMS
55 However, their thin films were found to be highly transparent in the visible region. Figure 4.12-a shows the photographs of the aerogel thin films. In Figure 4.12-b the transmission data of aerogel thin films and glass substrates are given. The transparencies of aerogel thin films at 650 nm are found to be 81.7% for AF-1, 86.9% for AF-2 and 89.3% for AF-3. Film transparency increases gradually with decreasing film thickness. The transparencies of the films, especially for AF-2 and AF-3, are very close to glass substrate (91.7% at 650 nm).
5.2.6.4 Refractive Index Measurements
Figure 5.13 Refractive indices of aerogel thin films in visible and near infrared
![Figure 2.2 Schematic representation of viscosity during gelation. Adopted from Ref. [35]](https://thumb-eu.123doks.com/thumbv2/9libnet/5754227.116222/29.918.223.698.301.579/figure-schematic-representation-viscosity-gelation-adopted-ref.webp)
![Figure 2.3 Schematic representation of neck growth. Adopted from Ref. [18]](https://thumb-eu.123doks.com/thumbv2/9libnet/5754227.116222/30.918.288.690.556.814/figure-schematic-representation-neck-growth-adopted-ref.webp)