i
qPCR VALIDATION OF IN VIVO DIAGNOSTIC IMPORTANCE
AND REGULATION BY ESTROGEN FOR CHRNA5 ISOFORM
EXPRESSION IN BREAST CANCER
A THESIS SUBMITTED TO
THE DEPARTMENT OF MOLECULAR BIOLOGY AND GENETICS AND GRADUATE SCHOOL OF ENGINEERING AND SCIENCE
OF BILKENT UNIVERSITY
IN PARTIAL FULFILLMENT OF THE REQUIREMENTS FOR THE DEGREE OF
MASTER OF SCIENCE
By Emine Sıla ÖZDEMİR
September 2014
ii
I certify that I have read this thesis and that in my opinion it is fully adequate, in scope and in quality, as a thesis for the degree of Master of Science.
Assist. Prof. Özlen Konu (Advisor)
I certify that I have read this thesis and that in my opinion it is fully adequate, in scope and in quality, as a thesis for the degree of Master of Science.
Assist. Prof. Öznur Taştan Okan
I certify that I have read this thesis and that in my opinion it is fully adequate, in scope and in quality, as a thesis for the degree of Master of Science.
Assist. Prof. Özgür Şahin
Approved for the Graduate School of Engineering and Science
Prof. Dr. Levent Onural Director of the Graduate School of
iii
To my mother Sezer, and to my father Ekrem... Thank you for being with me all the time ..
iv ABSTRACT
qPCR VALIDATION OF IN VIVO DIAGNOSTIC IMPORTANCE AND REGULATION BY ESTROGEN FOR CHRNA5 ISOFORM EXPRESSION IN
BREAST CANCER Emine Sıla Özdemir
MSc. in Molecular Biology and Genetics Supervisor: Asst. Prof. Dr. Özlen Konu
September 2014
Breast cancer has multiple molecular subtypes; normal-like, basal-like, luminal A, luminal B and HER2 positive depending on receptor status of tumor cells. Cancer therapy is tailored according to the type of cancer; hence finding new diagnostic markers is important to decide on the best treatment approach. Cholinergic nicotinic receptor alpha 5 (CHRNA5) is one of the subunits of nicotinic acetylcholine receptors with significant roles in addiction and cancer. In the present study, CHRNA5 has been validated as an estrogen and/or Estrogen receptor (ER) modulated nicotinic acetylcholine receptor by qPCR in in vitro and in vivo in breast cancer samples. CHRNA5 isoform expression was measured using in vitro cell culture studies in which ER- and ER+ cell lines treated with different doses of estradiol (E2); MCF7 cell line was exposed to long-term E2 depletion, in another experiment it was treated with tamoxifen (4-OHT), an ER antagonist, and with or without E2. We found that all CHRNA5 isoforms exhibited increased expression in response to E2 dose-dependently in the ER+ MCF7 cell line while in the ER- MDA-MB-231 cell line CHRNA5 isoform expression response was variable in direction and magnitude. CHRNA5 isoform expression in general steadily decreased in ER+ cell line MCF7 after 4-OHT treatment. After six months of E2 depletion, ER+ MCF7 cell line had increased CHRNA5_v3 isoform and ESR1 (ER gene) mRNA
v
expression. In vivo, a human breast cancer cDNA panel was scanned with specially designed primers with qPCR using a custom-written GUI in MATLAB. It was found that CHRNA5, showing a statistically significant difference between normal and tumor cDNA, was a good candidate gene in diagnosis of breast cancer. CHRNA_v3 was able to distinguish between ER+ vs ER- breast tumor samples. We also addressed whether CHRNA5 isoforms exhibited differences in distinguishing tumor stage, and HER2 status. Our findings showed that expression of CHRNA5 isoforms were correlated with each other and regulated by E2 in breast cancer depending on ER receptor status.
Keywords: Breast cancer, CHRNA5, estrogen, estrogen depletion, tamoxifen, molecular subtype.
vi ÖZET
MEME KANSERİNDE CHRNA5 İSOFORM İFADESİNİN IN VIVO TANISAL ÖNEMİ VE ÖSTROJENLE DÜZENLENMESİNIN qPCR İLE
DOĞRULANMASI Emine Sıla Özdemir
Moleküler Biyoloji ve Genetik Yüksek Lisansı Tez Danışmanı: Yrd. Doç. Dr. Özlen Konu
Eylül 2014
Meme kanserinin birden çok alt tipi bulunmaktadır; bunlar tümör hücresinin reseptör durumuna bağlı olan normal benzeri, bazal benzeri, luminal A, luminal B ve HER2 pozitiftir. Kanser tedavisi, kanser tipine göre belirlenir; bu da teşhis amaçlı yeni bir markör bulmanın en iyi tedavi yöntemini bulmaktaki önemini göstermektedir. Kolinerjik reseptör nikotinik alfa 5 (CHRNA5) nikotinik asetilkolin reseptörlerinin bir alt birimi olup bağımlılık ve kanserde önemli rol oynamaktadır. Bu çalışmada, CHRNA5’in östrojenle ve/veya östrojen reseptörü ile modüle edilen bir reseptör olduğu meme kanseri örneklerinde in vivo ve in vitro qPCR doğrulama çalışmalarıyla gösterilmiştir. CHRNA5 izoform ifadesi farklı dozda estradiol E2 uygulamasına maruz bırakılan ER- ve ER+ hücre hatlarında hücre kültürü çalışmalarıyla ölçülmüş; MCF7 hücre hattı uzun süreli E2 açlığına maruz bırakılmış ve diğer bir deneyde ise E2 varlığında ve yokluğunda bir ER antagonisti olan tamoxifen (4-OHT) uygulanmasına maruz bırakılmıştır. E2 tedavisinden sonra ER+ MCF7 hücre hattında doza bağlı olarak CHRNA5 izoform ifadesinin arttığı, ER- MDA-MB 231 hücre hattında ise CHRNA5 izoform ifadesinin yön ve miktar açısından değişkenlik gösterdiği bulgulanmıştır. CHRNA5 izoform ifadesi genel olarak ER+ MCF7 hücre hattında 4-OHT tedavisi sonucunda azalmıştır. Altı aylık E2 yokluğundan sonra ER+ hücre hatlarında CHRNA5_v3 ve ESR1 (ER geni) ifadesinin arttığı gözlenmiştir. In
vii
vivo, bir insan meme kanseri cDNA paneli, özel olarak tasarlanmış primerlerle qPCR
yöntemi ve MATLAB’da özel yazılmış GUI uygulaması kullanılarak taranmıştır. Normal ve tümör cDNA’leri arasında istatistiksel olarak önemli bir ifade farklılığı gösteren CHRNA5 geninin, meme kanseri teşhisinde önemli bir biyobelirteç olduğu bulgulanmıştır. Ayrıca, CHRNA5_v3 izoformu ER+ ve ER- meme tümörü örneklerini ayırt edebilmektedir. CHRNA5 izoformlarının miktarının stage ve HER2 statusüne göre nasıl değiştiği de test edilmiştir. Bulgularımız CHRNA5 izoformlarının birbirleriyle korale olduğuğunu ve meme kanserinde reseptör statüsüne bağlı olarak E2 tarafından regüle edildiğini göstermiştir.
Anahtar sözcükler: Meme kanseri, CHRNA5, östrojen, östrojen açlığı, tamoxifen, moleküler tip.
viii ACKNOWLEDGEMENTS
First of all, I would like to thank my thesis advisor Asst. Prof. Özlen Konu, I really appreciate her guidance and devotion on my thesis project and graduate studies. I would also like to thank Prof. Ihsan Gürsel for helping me whenever I needed and primarily for changing my perspective through science. He caused me to gain new scientific interests and widen my vision. Assoc. Prof. Işık Yuluğ, Assoc .Prof. Uygar Tazebay and Asst. Prof. Ali Güre guided me in both academic and personal life, I really appreciate their help.
I would especially like to mention my dear friend Yusuf İsmail Ertuna, Azer Aylin Açıkgöz, Derya Soner and Seda Koyuncu who have always been by my side during these two years both in social and academic life.
I also want to mention and thank my other friends Kemal Çağlar Göğebakan, Melek Cansu Petek, Mehmet Kayşim Kişioğlu and Mustafa Erol who always support me. I would like to thank Ermira Jahja for cloning, sequencing and providing primer sequences and Gülçin Çakan, Ender Avcı, Huma Shehwana and Şahika Çıngır for assistance in experiments.
Once again I would like to thank and express my gratitude and love toward my parents Ekrem and Sezer, also my aunt Ümran who is like a mother during my undergraduate and graduate studies. You are the main reason behind my success and improvement. Thank you for your support and everything.
TUBITAK was the foundation financially supporting this project (TBAG-111T316 to OK) and me (2210-E) during my master studies.
ix TABLE OF CONTENTS SIGNATURE PAGE...II DEDICATION...III ABSTRACT...IV ÖZET...VI ACKNOWLEDGEMENTS...VIII TABLE OF CONTENTS...IX LIST OF FIGURES...XIV LIST OF TABLES...XVI 1.INTRODUCTION ... 1 1.1 Breast Cancer ... 1
1.1.1 Classification and Subtypes in Breast Cancer ... 3
1.1.1.1 Receptor Status Defining Diagnosis and Survival ... 4
1.1.2 Risk Factors ... 5
1.2 Estrogen (E2) Signaling in Breast Cancer ... 6
1.2.1 Genomic and Nongenomic Signaling ... 7
1.2.2 4-OHT and Breast Cancer... 8
1.2.3 Effects of Long-term E2 Depletion on Estrogen Receptors ... 9
1.3 Cholinergic Receptor Nicotinic Alpha (CHRNA or nAChR) ... 10
1.3.1 CHRNA5 and Cancer ... 11
1.3.2 Regulation of CHRNA5 Expression ... 12
x
1.4 Alternative Splicing and Isoform Formation ... 13
1.4.1 Importance of isoform expression patterns of genes in cancer ... 14
1.4.2 Alternative Splicing and Breast Cancer ... 15
1.5 Isoform Expression Measurement Technologies ... 16
1.5.1 Microarrays and Analysis Methods ... 16
1.5.2 qPCR Studies and Analysis Methods ... 16
1.5.3 Northern Blots... 17
1.6 Diagnosis and Classifying Cancer with in vivo cDNA Expression Patterns .... 17
1.6.1 cDNA Panel Studies of Different Types of Cancer ... 17
1.6.2 Quantitative and Statistical Methods to Analyze cDNA Panels ... 18
1.7 Tools for Expression Analysis ... 19
1.7.1 Creating Tools for cDNA Panel Analysis... 19
1.7.2 Outlier Analysis ... 20
2. AIM ... 21
3. MATERIALS AND METHODS ... 22
3.1 Cell Culture Protocols ... 22
3.1.1 Cell Lines ... 22
3.1.2 Cell Growth Conditions ... 22
3.1.3 Thawing Cells ... 23
3.1.4 Subculturing of Cells ... 23
3.1.5 Cryopreservation of Cells ... 23
xi
3.1.7 β-Estradiol (E2) Treatment ... 24
3.1.8 Tamoxifen and E2 Treatment ... 25
3.1.9 Long-term E2 Depletion of Cells... 26
3.2 Gene Expression Analyses ... 27
3.2.1 Total RNA Isolation... 27
3.2.2 cDNA Synthesis ... 27
3.2.3 Oligonucleotides ... 28
3.2.4 Gradient Polymerase Chain Reaction ... 29
3.2.5 Agarose Gel Electrophoresis ... 30
3.2.6 Quantitative Real Time-Polymerase Chain Reaction (qPCR) ... 30
3.2.7 Detection of qPCR Outliers Based on Tm Values from Melt Curves ... 32
3.2.8 Primer Efficiency ... 32
3.2.9 ∆Ct and ∆∆Ct Analysis of qPCR Data ... 33
3.2.10 ANOVA analysis ... 34
3.3 Analysis of E2 Treatment ... 34
3.3.1 Clustering ... 34
3.3.2 Treeview analysis ... 34
3.4 Analysis of 4-OHT and E2 Treatment ... 35
3.5 Analysis of Long-term Estrogen Depletion Experiment ... 35
3.5 Analysis of cDNA Panel ... 35
3.5.1 Statistical Analysis of qPCR Data ... 36
xii
3.5.1.2 MATLAB GUI Application ... 36
3.6 General Solutions ... 36
4.RESULTS ... 38
4.1 Effects of Different Doses of E2 on CHRNA5 Isoform Expression ... 38
4.1.1 Preliminary PCR for MCF7 and MDA-MB-231 Treated with Different Doses of Estradiol (E2) ... 38
4.1.2 Statistical Analysis of E2 Treatment with MATLAB ... 38
4.1.3 Heat Map of CHRNA5 Isoform and E2 Markers Expression ... 46
4.2 Effects of 4-OHT and E2 Treatment ... 48
4.2.1 Statistical Analysis of 4-OHT and E2 Treatment with MATLAB ... 48
4.2.2 Comparison of CHRNA5 Isoform and E2 and 4-OHT Markers Expression ... 51
4.3 Effects of Long-term E2 Depletion (LTED) on CHRNA5 Isoform Expression ... 53
4.3.1 Determining the Housekeeping Gene for LTED Experiment ... 53
4.3.2 Expression of CHRNA5 Isoform and E2 Exposure Markers across LTED ... 54
4.4 Expression of CHRNA5 Isoforms in cDNA Panel ... 58
4.4.1 Data Quality Control Studies ... 58
4.4.1.1 Tm Consistency Check in cDNA Panels ... 59
4.4.2 Statistical Analysis of CHRNA5 Isoforms Expression ... 60
4.4.3 Comparison of CHRNA5 Isoform Expression ... 62
xiii
5. CONCLUSION AND DISCUSSION ... 73
6. FUTURE PERSPECTIVES ... 80
REFERENCES ... 82
xiv LIST OF FIGURES
Figure 1.1: A model for breast carcinogenesis... 2
Figure 1.2: Representation of genomic and nongenomic ER signaling pathway ... 8
Figure 1.3: GEO2R analysis of GSE20361 dataset consisting of initial and three months long estrogen depleted ER+ cell line for ESR1 (ER) gene ... 9
Figure 1.4: Schematic representation of nAChRs hetero (upper left) and homo-oligomer (botton left) complexes. ... 10
Figure 1.5: Representation of alternative splicing of CHRNA5 in lung. ... 12
Figure 1.6: Patterns of alternative splicing. ... 14
Figure 3.1: Scheme of a hemocytometer... 24
Figure 3.2: Scheme of binding regions of CHRNA5 isoform primers ... 29
Figure 4.1: Representative expression of CHRNA_iso2 products across ER-and ER+ breast cancer cell lines treated with 1nm, 10nm and 100nm E2. ... 38
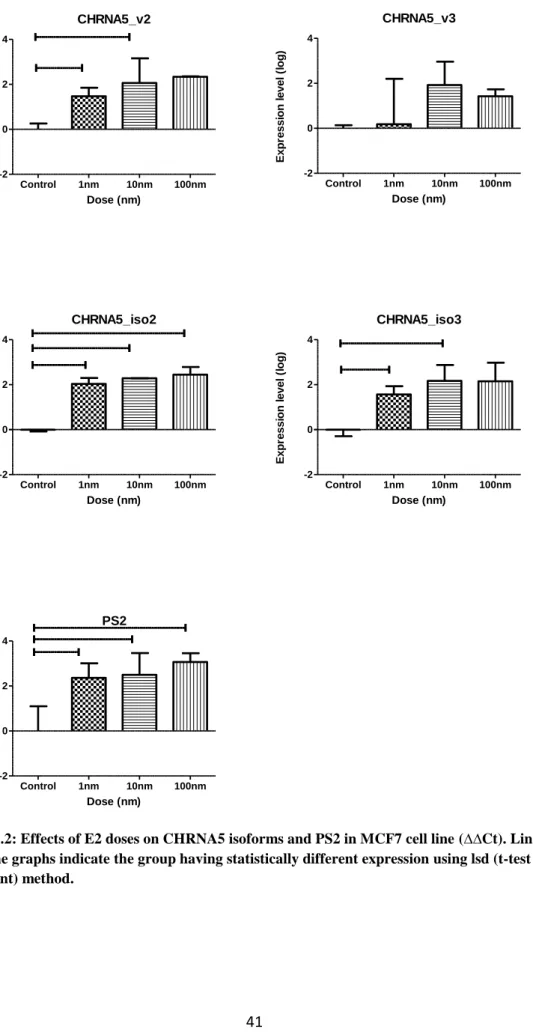
Figure 4.2: Effects of E2 doses on CHRNA5 isoforms and PS2 in MCF7 cell line (∆∆Ct)……….41
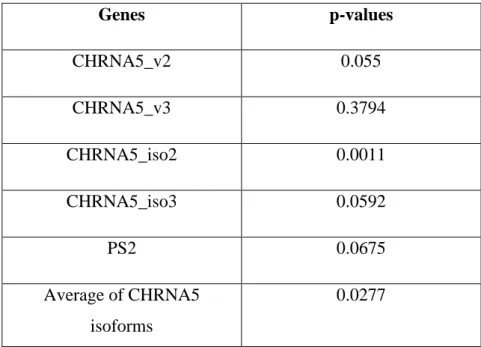
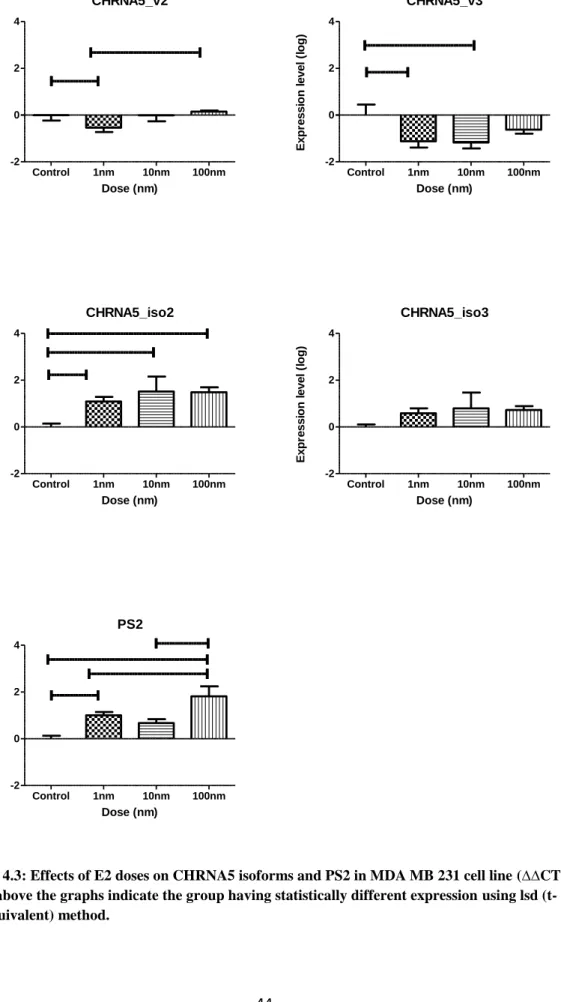
Figure 4.3: Effects of E2 doses on CHRNA5 isoforms and PS2 in MDA MB 231 cell line (∆∆CT).. ... 44
Figure 4.4: Heatmap representations of expression level of CHRNA5 isoforms and PS2 in MCF7 and MDA MB 231 cell lines. ... 47
Figure 4.5: Effects of E2 and 4-OHT on CHRNA5 isoforms, E2 and 4-OHT indicators in MCF7cell line………49
Figure 4.6: Overall representation of expression level of CHRNA5 isoforms and E2, 4-OHT indicators……….. 52
xv
Figure 4.7: Changes in gene expression of treatment with respect to control of TPT1
expression per time point during six months of E2 depletion with ∆∆Ct analysis.. .. 54
Figure 4.8: Changes in gene expression of treatment with respect to control of CHRNA5 isoforms expression per time point during six months E2 depletion with ∆∆Ct analysis………..55
Figure 4.9: Changes in gene expression of treatment with respect to control of E2 indicators expression per time point during six months of E2 depletion with ∆∆Ct analysis ………..………..56
Figure 4.10: Gel image of qPCR products from different experiment with varying Tm values. ... 59
Figure 4.11: Representative melting curve. Tm curves having different Tm than the median differ from each other………...60
Figure 4.12: Representation of Ct value distribution before and after Tm outlier removal.. ... 60
Figure 4.13: Correlation plots of three CHRNA5 isoforms ... 67
Figure 4.14: Interfaces of input module of cDNA panel analysis application ... 69
Figure 4.15: Interface to enter input file names ... 69
Figure 4.16: Interfaces of quality control module of cDNA panel analysis application ... 70
Figure 4.17: Interfaces of method option module of cDNA panel analysis application ... 71
Figure 4.18: Interfaces of analysis module of cDNA panel analysis application ... 72
Figure 8.1: GEO2R analysis of GSE26459 dataset for FOSL2 expression with E2 and 4-OHT in 4-OHT sensitive cell lines. ... 93
Figure 8.2: GEO2R analysis of GSE26459 dataset for CHRNA5 expression with E2 and 4-OHT in 4-OHT sensitive cell lines ... 93
xvi
Figure 8.3: GEO2R analysis of GSE26459 dataset for PS2 expression with E2 and 4-OHT in 4-4-OHT sensitive cell lines... 94 Figure 8.4: GEO2R analysis of GSE20361 dataset for PS2 expression after and before LTED. ... 94 Figure 8.5: GEO2R analysis of GSE2251 dataset for PS2 expression with and
without E2 treatment in ER- MDA MB 231 cell line. ... 95 Figure 8.6: GEO2R analysis of GSE26459 dataset for FOSL2 expression with E2 and 4-OHT in 4-OHT resistant cell lines. ... 95
xvii LIST OF TABLES
Table 1.1: Classification of molecular subtypes ... 4
Table 1.2: Breast cancer risk factor and relativity of the risk ... 6
Table 3.1: Breast cancer cell lines origin ... 22
Table 3.2: The receptor status and molecular subtypes of cell lines ... 22
Table 3.3: Primer sequences, their product sizes and efficiencies ... 28
Table 3.4: PCR reagents and their volumes ... 29
Table 3.5: PCR conditions ... 30
Table 3.6: qPCR reagents and their volumes ... 31
Table 3.7: qPCR conditions ... 31
Table 4.1: p-values of each gene comparing MCF7 and MDA MB 231 cell lines and different doses of E2 based on two-way and one-way ANOVA ... 39
Table 4.2: p-values of each gene comparing E2 doses in MCF7 cell line from ANOVA test ... 42
Table 4.3: List of group having statistically significant expression difference for each gene ... 423
Table 4.4: p-values of each gene comparing E2 doses in MDA MB 231 cell line from ANOVA test ... 45
Table 4.5: List of group having statistically significant expression difference for each gene ... 46
Table 4.6: p-values of each gene comparing control, E2, 4-OHT, and E2 and 4-OHT together in MCF7 cell line from ANOVA test ... 50
xviii
Table 4.7: List of group having statistically significant expression difference for each gene ... 51 Table 4.8: p-values of each gene comparing expression after six months of estrogen depletion from sign test ... 57 Table 4.9: p-values of each CHRNA5 isoform normal-tumor, ER+ - ER-, HER2+ - HER2- and stages of tumor in cDNA panel ... 61 Table 4.10: List of group having statistically significant expression difference for each gene ... 61 Table 4.11: Correlation coefficiencies and p-values between primer pairs for all samples ... 68 Table 8.1: Covdesc file of cDNA panel ... 90 Table 8.2: Time points for LTED experiment ... 96
1
1.INTRODUCTION
1.1 Breast Cancer
Breast cancer is a cancer type initiated from mammary gland lobules that function in providing milk, and ducts that connect lobules to nipples 1. It is the worldwide second most common cancer type, and the reason of ~15% of cancer-related deaths in women 2.
Breast cancer can be hereditary or sporadic. In hereditary breast cancer, the germline mutations that patients inherited increase susceptibility of developing breast cancer. BRCA1 and BRCA2 are the main genes involved in breast cancer, however, PTEN and TP53 mutations also are effective in breast cancer development 3. On the other hand, sporadic breast cancer occurs as a result of the accumulation of mutations in somatic tissue. More than 80% of women who face with breast cancer do not have a previous complaint on the disease occurrence in the family; risk factors include age and diet 3.
Tumorigenesis, the transformation from a normal cell to a malignant cell, basically occurs in three steps 4: First, normal cell changes into a lesion and then lesion becomes malignant. The last step occurs when the malignant lesion undergoes metastasis.
The genes and steps involving mammary gland tumorigenesis are explained in Figure 1.1. A breast stem cell divides asymmetrically, and then there could be mutation in a gene involving breast cancer susceptibility. It is possible that the two events could be simultaneous. These genes might involve cell cycle regulation and the mutation of in one or more of them encourages proliferation 5.
2
Figure 1.1: A model for breast carcinogenesis.
3
1.1.1 Classification and Subtypes in Breast Cancer
Breast cancer is a heterogeneous disease hence it requires to be categorized effectively for more accurate diagnosis of subtypes and identification of personalized therapeutic strategies. Breast cancer classification can be done considering different aspects of tumor biology, e.g., histological, molecular. Histological subtypes of breast cancer indicate the location of tumor initiation site and state as well as the status of invasiveness of cancer. The histological subtypes can be distinguished via in
situ studies as invasive ductal, ductal and invasive lobular carcinomas 6.
Grade of a breast cancer tumor defines how differentiated the tumor tissue is from normal breast tissue. If the tumor is well differentiated it is called as low-grade and they are more similar to normal tissue than high-grade tumors that are not well differentiated 7.
Molecular classification of breast cancer on the other hand considers receptor status of tumor tissue as the primary factor. There are three types of receptors on breast cancer tumor cells which could be associated with the character of tumor. Estrogen Receptor 1 (ER), Human Epidermal growth factor Receptor 2 (HER2) and Progesteron Receptor (PR) are these three receptors that may take part in the proliferation and maintenance of tumor cells.
Recent studies performed with microarrays also have led to identification of expression profiles that categorize molecular subtypes; these have been basically classified as normal-like, luminal A, luminal B, HER2+ and basal-like type 8. Basal-like contains triple negative cancers that do not include any of the indicated three receptors. Luminal types are ER+, however they differ by the level of gene expression of HER2, luminal A subtypes do not express HER2, while luminal B subtypes are HER2+ 9. HER2+ type breast cancer as the name implies are positive for HER2 8; ERBB2/HER2 positive tumors grow and spread more aggressively similar to basal-like subtypes 10. In Table 1.1 molecular subtypes are summarized.
4
Table 1.1: Classification of molecular subtypes
Subtype ER PR HER2
Basal - - -
Luminal A + + or - -
Luminal B + + or - +
HER2+ - - +
1.1.1.1 Receptor Status Defining Diagnosis and Survival
The estrogen receptor (ER) has an important role in breast cancer development and progression. Current work on gene expression profiles seem to be altered according to hormone receptor status of the breast cancer 11. Microarray studies show existence of gene sets correlating with receptor status thus allowing for interpreting subtypes upon examining the expression of these genes. ER status, in addition, has an impact on the DNA methylation state of some genes such as FAM124B, NAV1, and PER1 in breast cancer 12.
Genetic and epigenetic alterations in ER + tumors increase the sensitivity to endocrine therapy, yet ER- tumors are known as hormone independent 12. ER- tumors do not have a functional protein to which the hormone estrogen will bind. There is no need for estrogen for the growth of ER- breast cancer, and usually they do not halt growing upon treatment with hormones that prevent estrogen from binding. Therefore, ER- breast tumors are considered as more aggressive 13. Studies show that ER- breast cancers do not have ER mRNA. The lack of ER is not a result of deletions or other structural changes in the ER gene. CpG island methylation is thought to be one of the alternatives in blockage of the transcription of the ER gene in ER – breast cancers 14.
Progesterone receptor (PR) is the mediating factor for progesterone’s effects in the development of the mammary gland and the progression of the breast cancer. PR is
5
expressed in more than half of the ER + breast cancer, and estrogen signaling is necessary to induce PR expression 15. It was found that some oncogenic pathways including PI3 K/Akt/mTOR, were more active in both ER-/PR- and ER+/PR- compared to ER+/PR+ tumors. PR- tumors can be considered more aggressive and invasive 15.
The ERBB2/HER2 gene is overexpressed in 20% - 30% of invasive breast carcinomas; a positive HER2 status is associated with improvement of metastatic potential and decreased overall survival. In addition, patients with HER2+ tumors are less responsive to tamoxifen treatment than patients with HER2- tumors 16.
1.1.2 Risk Factors
Risk factors causing breast cancer can be hereditary as well as environmental. Moreover, main risk factors such as gender and age are not modifiable. Family history is also an important risk factor, with increasing susceptibility to breast cancer in women with one or more relatives with breast cancer.
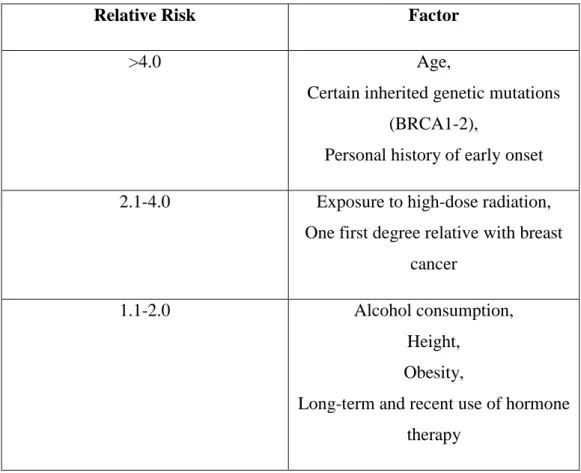
Conditions triggering other risk factors including postmenopausal obesity, smoking and alcohol consumption, use of estrogen and progesterone menopausal hormones can be intervened. For example, use of hormones as therapy increases the cell proliferation and promotes susceptibility to DNA damage and induces breast cancer cell growth 17. Recent epidemiological studies have focused on how much a factor hormonal therapy is in breast cancer risk and they concluded that recent and long-term use of menopausal hormone therapy has a relative risk value between 1.1-2.0 2. Avoding such modifiable risk factors may help reduce the risk of breast cancer. Table 1.2 summarizes general breast cancer risk factors with the relative likelihood of the risk 2.
6
Table 1.2: Breast cancer risk factor and relativity of the risk 2
Relative Risk Factor
>4.0 Age,
Certain inherited genetic mutations (BRCA1-2),
Personal history of early onset 2.1-4.0 Exposure to high-dose radiation,
One first degree relative with breast cancer
1.1-2.0 Alcohol consumption, Height,
Obesity,
Long-term and recent use of hormone therapy
1.2 Estrogen (E2) Signaling in Breast Cancer
Estrogens are steroid hormones found primarily in females. Serum estrogen level in premenopausal women is high, while its level decreases in postmenopausal women. Estrogen can be provided both endogenously or exogenously. Estrogen is primarily produced by ovaries during menstrual life endogenously. Exogenous sources include hormone-replacement therapies and oral contraceptive usage. The small amount of estrogen present after menopause comes from extragonadal tissues like muscles, fat and liver 18.
It is known that estrogens are responsible for the initiation and growth of breast cancer. The exact mechanism is still complex but estrogens lead to the development of mammary cancer with proliferative effects 19. Metabolism of estrogen and its metabolites are affected by genetic and environmental factors and breast cancer initiation and growth can relate to estrogen and its metabolites.
7
There are other ligands besides E2 which can trigger ER pathway; however they may have antagonistic effect on cell proliferation. Phytoestrogens and genistein are plant derived compounds that are structurally similar to E2. Although phytoestrogens induce estrogen responsive genes, their anti-proliferative and apoptotic effects are mediated through the estrogen receptor 20,21.
1.2.1 Genomic and Nongenomic Signaling
Estrogen stimulation triggers two pathways in general: genomic and nongenomic signaling. Estrogen molecule can pass through membrane because of its steroid structure. In ER+ cells, estrogen and ER located in nucleus interact and form a ligand-receptor complex. After binding of estrogen, ER dimerizes using two types of estrogen receptors, ER-α and ER-β, with ability to form homo- or heterodimers after binding of ligand (estrogen). This complex then binds to specific response elements known as estrogen response elements (EREs) located in the promoters of target genes 22,23. However, there are cases in which ER does not directly bind to DNA to regulate gene expression. This occurs through secondary messenger triggering a set of transcription factors in nucleus 22.
E2 modulated classical genomic signaling pathway includes direct binding of ER to DNA via ERE. Transferred E2-ER complex from the plasma to the nucleus recruits transcriptional machinery and other cofactors to specific DNA target sequences of estrogen-responsive gene promoters 24. However, it is known that approximately one third of the genes in humans that are regulated by ERs do not contain ERE-like sequences 25. Molecular mechanism behind this phenomenon still is not fully understood.
Nongenomic ER signaling pathway alters gene expression with the help of secondary messengers, E2-ER complex does not directly enter nucleus 24. Cytoplasmic ER and E2 interaction triggers mobilization of intracellular calcium and cAMP production. E2 can activate MAPK signaling pathway with the nongenomic actions in several cell types including breast cancer 26. E2 also triggers the phosphoinositol (PI) 3-kinase signaling pathway in breast cancer cell 27. Additionally, E2 activated membrane associated ERs come in close contact with metabotropic glutamate
8
receptors (mGluRs), turning on mGluR signaling without glutamate. Protein kinase cascades including PKA,PKC, and tyrosine kinases pathways can mediate the non-genomic ER pathway 24.
Figure 1.2 shows a representation of genomic and nongenomic ER signaling pathways.
Figure 1.2: Representation of genomic and nongenomic ER signaling pathway
1. Genomic signaling pathway, 2. ERE-independent genomic signaling pathway, 3. Nongenomic signaling pathway (Reproduced with permission from Björnström et al., 2005 Copyright
Massachusetts Medical Society)
1.2.2 4-OHT and Breast Cancer
Tamoxifen (4-OHT) is an agent commonly used as an anti-estrogen treatment for hormone-dependent breast cancer patients. As mentioned earlier E2 induces cell proliferation in ER+ breast cancer cells and 4-OHT, an ER antagonist, blocks the binding of E2 to ER 28,29. 4-OHT binds to the ER and affect the position of helix 12, preventing ER transcriptional activation 30.
It is also thought that E2 can modulate a pathway that triggers the invasiveness of tumor cells, so inhibition of E2 pathway is crucial for the therapy of both early and advanced breast cancer 31.
9
Although 4-OHT/tamoxifen therapy is very efficient and beneficial for patients, eventually tamoxifen resistance develops in tumor cells. It is also known that tamoxifen resistance can promote EMT-like behavior 32,33.
1.2.3 Effects of Long-term E2 Depletion on Estrogen Receptors
Endocrine therapies including long term estrogen depletion (LTED) are the most effective systemic treatment of ER+ breast cancer. However, tumor cells can develop resistance to endocrine therapies. Indeed, acquired resistance is not related to the conversion of ER+ cells to ER- cells; hence changes in ER expression are thought to be main reason of resistance 34. Previous research supports that resistance is acquired by molecular events trigger constitutive activation of ER and growth factor signaling pathway 35. Long term estrogen depletion may cause an increase in growth factor receptor levels, such that ER could also be significantly overexpressed 36.
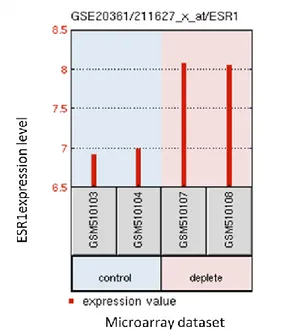
As a pilot study for hypothesis generation, we have analyzed a part of a microarray study that focused on effects of long-term estrogen depletion on transcriptome by using GEO2R 36. Figure 1.3 shows ESR1 expression in 3, 15 days and three months of long-term estrogen depletion (LTED) time course in an ER+ cell line.
Figure 1.3: GEO2R analysis of GSE20361 dataset consisting of initial and three months long estrogen depleted ER+ cell line for ESR1 (ER) gene.
10
It is apparent that LTED leads to an upregulation in expression of ER mRNA levels; this increase could then be translated into protein and has potential to modify and compensate the lack of E2. Overexpression of ER could result in improved cell survival ability and the mediation of estrogen-independent growth, and end up with resistance to endocrine therapies in breast cancer patients 37.
1.3 Cholinergic Receptor Nicotinic Alpha (CHRNA or nAChR)
Nicotinic acetylcholine receptors or cholinergic nicotinic receptors are transmembrane proteins functioning as ligand-gated ion channels which can bind to acetylcholine (ACh) and nicotine. These ligands mainly found at the neuromuscular junction and in some neurons, also are present in non-neuronal cells 38.
nAChRs have 2 different types of subunits; 9α (2-10), and 3β (2-4) subunits. Subunits form pentamers with a barrel like structure in the membrane around a central ion channel 38 (Figure 1.4).
Figure 1.4: Schematic representation of nAChRs hetero (upper left) and homo-oligomer (botton left) complexes. (Reprinted from Weiland, 2000, with permission from Elsevier)
Neuronal nAChRs have alternatively spliced forms which increase the diversity and number of receptor subtypes 39. Different subtypes may explain the variable
11
tolerance and addiction to nicotine or different release of neurotransmitters in different synapses 40.
Besides nicotine addiction, nAChRs are effective in other disease, disorder and behaviors, such as Alzheimer’s Disease, Parkinson’s Disease, schizophrenia, epilepsy, and cancer 38–40.
1.3.1 CHRNA5 and Cancer
Neuronal nAChRs are also expressed in other tissues than lung; they can also be found in muscle, skin and pancreas 41.
Chromosome 15q25.1 contains CHRNA3, CHRNA5 and CHRNB4 genes encoding α3, α5 and β4 subunits of nAChR 42
. Genome-wide studies showed that these genes could be related to cancer development and progress. Studies mainly focused on lung cancer; a single nucleotide polymorphism (SNP) was found strongly associated with lung cancer susceptibility in CHRNA5 42. Recent studies have shown that nAChRs can accelerate cell proliferation, tumor invasion, and angiogenesis and can provide resistance against apoptosis 43.
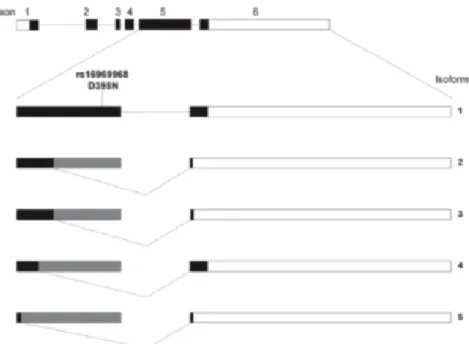
It was found that CHRNA5 was strongly upregulated in lung adenocarcinoma, compared to normal lung tissue. Five different transcripts isoforms of CHRNA5 were identified in normal lung tissue. These isoforms form due to alternative splicing of the 5th exon. It was demonstrated that all mRNA isoforms were upregulated in lung adenocarcinoma with respect to normal lung tissue 44. Figure 1.5 shows alternative splicing of five CHRNA5 isoforms.
12
Figure 1.5: Representation of alternative splicing of CHRNA5 in lung. (Reprinted from Falvella et al., 2013, with permission from Oxford University Press)
Also, it was demonstrated that CHRNA5 plays a role in modulating adhesion and motility in bronchial cells and in regulating p63 oncogene 42.
Recent findings suggest that the expression of nAChR subunits including α5 encoded by CHRNA5 might be altered in human breast cancer tissues 45. Furthermore, some cohort and case–control studies have shown a positive association between cancer and smoking suggesting a connection between nAChRs and breast cancer 43. However, there is no comprehensive in vitro or in vivo study that examines the estrogen dependency of isoform specific expression in breast cancer.
1.3.2 Regulation of CHRNA5 Expression
CHRNA5 gene expression can be regulated by the changes in the density of regulatory elements or by indirect effects of changes in expression of other genes
46,47
.
IREB2, PSMA4, CHRNA5, CHRNA3 and CHRNB4 on the chromosome 15 are thought to be good candidates for lung cancer and they are co-regulated; their expression increases all together when expression of one of them is induced 47.
13
SNPs in the cis-regulatory elements may create or diminish cis-acting transcription/enhancer/suppressor factor binding sites, thus accumulation of SNP causing gain of function or alternative splicing induction are very common in genome. rs16969968 SNP on the sequence of CHRNA5 in exon 5, for example, triggers alternative splicing by creating new binding sites for transcription factors resulting the risk of nicotine dependence and cancer 46.
1.3.3 Effects of E2 on Cholinergic Signaling
E2 is thought as a factor affecting nAChRs expression; this also might give a clue to nAChRs-breast cancer relationship. Recent studies have showed that the ER signaling mediates upregulation of nAChR gene expression; nicotine and E2 both induced a9-nAChR expression in human breast cancer cells 43,48.
The increase in nAChR expression with the effect of E2 can also be seen in protein level, however, it is found that E2-induced a9-nAChR protein upregulation can be detected in the ER+ cells compared with the ER- cells 48. Previous studies in our lab suggested that E2 treatment might increase expression of CHRNA5 based on analysis of microarray studies49 and by qPCR in a time-dependent manner 50 however no study yet confirmed dose-dependence of increase in CHRNA5 expression based on qPCR analysis of in vitro cell lines. Correlation between ER status and CHRNA5 expression in vivo was not addressed yet in the literature either.
1.4 Alternative Splicing and Isoform Formation
Alternative splicing is a post-transcriptional regulation in mRNA which might occur almost in all human genes controlling expression and function 51. The splicing process provides variation to gene expression. Alterations in splicing can affect the mRNA and protein products of a gene. Alternative splicing has an enormous contribution in protein diversity in metazoan organisms 52. Different patterns of alternative splicing exist (Figure 1.6): a cassette exon can be either included in the mRNA or excluded. Mutually exclusive exons may occur in the presence of two or more cassette exons. Alternative 5’_ and 3’_ splice sites permit the alterations in the
14
inclusion of a specific exon. CHRNA’s 5th exon represents an example in which alternative splice sites allow the lengthening or shortening of the exon 44.
Figure 1.6: Patterns of alternative splicing. Grey boxes show sequences present final spliced mRNA. Stripped boxes are for representation of alternative RNA segments that may or may not be included in the mRNA.
(Reprinted from Black, 2003, with permission from Annual Reviews)
1.4.1 Importance of isoform expression patterns of genes in cancer
Genes related to cancer susceptibility do not always have only one form, due to alternative splicing process same gene can be expressed in different ways. It is known that expression of these alternative spliced forms - isoforms- of genes can play roles in differentiation of cancer cells. Alternative splicing in the protein coding gene of mRNA gives rise to different proteins, therefore they differ in their activities
51
. It is found that different isoforms of cancer related genes can help diagnosis of cancer 44. For example, different isoforms of CHRNA5 gene show significantly different expression level between normal lung and tumor tissue 44. Recent studies have reported that transcription factor XBP1 mRNA splicing activates autophagy in endothelial cells through upregulating Beclin1 transcription, a gene found as playing
15
a role in T-cell natural T-cell lymphoma 51. Alternative splicing has effects on different types of cancer, such as lymphoblastic leukemia cells, esophageal carcinoma lung cancer and breast cancer 44,51,53.
1.4.2 Alternative Splicing and Breast Cancer
Besides other types of cancers, alternatively spliced forms of genes may play a role in breast cancer initiation and growth. Recent studies revealed that certain isoforms are involved in breast tumor formation from breast epithelial cells 54.
CEACAM1 is a gene that plays a role in some cellular processes including cell-cell adhesion, differentiation, apoptosis and immune response; its pre-mRNA undergoes alternative splicing generating isoforms consisting of an N-terminal and a variable number of multiple extracellular Ig-like domains, a transmembrane domain, and either short (CEACAM1-S) or long (CEACAM1-L) cytoplasmic domains. In normal breast, CEACAM1-S is the predominant isoform, while in breast cancer the S/L ratio highly decreases 54.
Another gene TMEM16A forming Ca2+-activated Cl- channel has been found as alternatively spliced. Multiple protein isoforms of TMEM16A affect the voltage and Ca2+-dependence of the channels. Alternative splicing of exons 6b and 15 of TMEM16A are coordinated in several normal tissues and that this coordination increases in breast tumors 55.
Chemokine CXCL12 signaling is strongly linked to tumor growth and metastasis in breast cancer and some other malignancies. Recent studies have showed that low levels of expression of CXCL12 correlates with worse prognosis in breast cancer with isoform-specific differences among α, β, γ, and δ isoforms 56.
MNK2 gene encoding protein that is a substrate of the MAPK pathway and phosphorylates the translation initiation factor eIF4E is alternatively spliced forming two splicing isoforms Mnk2a, which contains a MAPK-binding domain, and Mnk2b, which lacks it. It is found that the Mnk2a isoform is downregulated in breast tumors
57
16
Also it is known that expression of CHRNA5 gene isoforms show changes in cancer such as lung carcinoma, as represented in Figure 1.5. CHRNA5 might play a significant role in breast cancer initiation and growth 43,44. Therefore, it is possible that expression of CHRNA5 isoforms can change in breast cancer and its subtypes and this warrants further research.
1.5 Isoform Expression Measurement Technologies
It was mentioned that alternative spliced form of genes can play important role in some disease including cancer. This implies the importance of isoform expression measurement in diagnosis. Different isoforms involving tumor initiation or growth can also be used as a biomarker to obtain a reliable diagnosis without complex interventions such as biopsies or surgery. New technologies provide new techniques to determine and measure isoforms of gene of interest.
1.5.1 Microarrays and Analysis Methods
Microarray is one of the most common technology used detection and analysis on gene isoforms. Recent advances in microarray technology rendered the search for the expression of alternatively spliced form possible.
In one study, arrays were designed using 2.5 million oligonucleotide selected probes to differentiate exon alternatives for ~17,250 human genes. ALEXA was designed for the analysis of AS microarrays. It used ~231,000 exon-intron probes, together with ~818,000 oligonucleotide exon junctions probes and ~155,000 exon-internal probes to identify the differentially expressed exon alternatives58.
1.5.2 qPCR Studies and Analysis Methods
qPCR can be used to identification of alternative spliced isoforms by designing primers or probes targeting the unique exon junctions of spliced isoforms. This method can be used to specifically amplify the long splicing isoform by using one primer in the alternative exon and an opposing primer in a constitutive exon. To detect the short splicing isoform, a boundary-spanning primer (BSP) for the sequence
17
covering the exon–exon junction with the reverse primer in a fundamental exon can be used 59.
1.5.3 Northern Blots
Northern blot technique is also used to identify alternative spliced isoforms. RNA is run on agarose gel for separation, and then RNA in the gel is transferred onto membranes.
Membrane is hybridized with probes to label RNA of interest, since the RNA is first separated by size, if one probe type can label different size of RNA on membrane it means RNA same gene has more than one product. This way the size of the products can be assessed and the presence of alternative splice products of the same gene or repetitive sequence motifs can be inferred 60.
1.6 Diagnosis and Classifying Cancer with in vivo cDNA Expression
Patterns
Cancer diagnosis and subtype classification is very crucial to start therapy early. Studies on cancer diagnosis and subtyping should include a very large sample size to be sure of the results and interpretation of the data. Recently, tissue samples taken from cancer patients with different backgrounds are widely used in diagnosis studies. These tissues can be directly used by antibody labeling or staining for a certain set of proteins or gene products of cDNA isolated from these tissues can be used for further analysis. Expression studies, isoform analysis, clustering and subtyping can be performed using cDNA arrays with proper sample sizes.
1.6.1 cDNA Panel Studies of Different Types of Cancer
It is possible to find and utilize various cDNA panels commercially to use for in vivo validation of biomarker studies. These panels are produced for more than 20 different types of cancer including pancreas, colorectal, lung, brain, bladder and breast cancer (e.g., ORIGENE). Arrays for only one type of cancer can be found for subtyping and diagnosis analysis; others are for a comparative cancer survey in which cDNA panels including different cancer types can be found.
18
In a hematopoietic cell and hematological malignancy study, cDNA array consisting of blood cancer samples, expression level of two related genes was examined and changes in their level between normal and cancer tissues were detected, also correlation between these two genes was spotted 61.
A colon cancer array was used to detect isoform expression of gene of interest and most abundant isoform of the gene found in colon cancer was detected 62.
1.6.2 Quantitative and Statistical Methods to Analyze cDNA Panels
Primary method to analysis cDNA panels is quantitative polymerase chain reaction (qPCR). qPCR is a method mainly used for gene expression analysis studies, because it gives the user exact relative quantity of expression. However, in regular PCR it is hard to determine expression change exactly with agarose gel images.
qPCR provides a cycle number (Ct or Cp) for each sample indicating in which cycle the amount of expression of the gene of interest exceed a certain threshold. Therefore, each Ct (threshold cycle) indirectly shows the level of expression when standardized by giving the opportunity to compare samples using these Ct values. cDNA panels including normal and tumor samples, different types of cancer or different stages or subtypes of same cancer can be analyzed with qPCR 63.
However, qPCR only gives Ct values for each sample; in order to compare and interpret them, additional analyses are required. After normalizing Ct values can be normalized using ∆Ct or ∆∆Ct methods. In ∆∆Ct method, a relative quantification based on relative expression of a target gene versus reference gene can be obtained to investigate the physiological changes in gene expression 64,65. Upon normalization, statistical tests are used to interpret the significance of a difference in the expression level between groups in cDNA panel. ANOVA, t-test, ANCOVA, sign test are such statistical tests used to analyze raw data. Therefore, analyzing cDNA panels with large sample size will benefit from automation of data analysis 66.
19
In ∆∆Ct method, a relative quantification based on relative expression of a target gene versus reference gene can be gathered to interrogate the physiological fluctuations in gene expression 64,65.
1.7 Tools for Expression Analysis
Importance of expression studies and some different analysis methods to evaluate and interpret the data from gene or isoform expression experiments were mentioned above. Expression studies generally require large sample size to obtain reliable results, however, this makes the analysis of data difficult to handle. Software tools become important for an easy and reliable data analysis. While analyzing an expression data, raw data should be processed and the quality should be assessed. One of the most common expression data analysis tools that can be reached online is NCBI GEO. It is used not exactly for cDNA panel but for microarray analysis. The database has limited information about a microarray experiment (MIAME)-compliant infrastructure that grasps completely annotated raw and processed data 67. GEO is currently the largest gene expression resource and it has grown exponentially each year. GEO analysis provides users a gene-centered representation that gives quantitative gene expression data for one gene across a DataSet. 67.
Moreover, some other software can be used to cluster data according the gene expression. Hierarchical clustering can be performed to pin-point to decide the identification of specific tissues from their expression profile through the defined elements, finally in order to unravel the tissue-specific gene expression in determinance of genes or gene clusters, clustering method can be made use of 68.
1.7.1 Creating Tools for cDNA Panel Analysis
MATLAB® (matrix laboratory) is a high-level language and interactive environment for numerical computation and programming. It is possible to analyze data, develop algorithms, and create models and applications using MATLAB as a programming medium 69.
20
MATLAB provides functions for linear algebra, statistics, filtering, plotting and visualization. These features make MATLAB a proper programming medium for gene expression analysis.
With basic mathematical functions raw data of qPCR of a cDNA panel together with its covariate information can be processed. For example, means for replicate measurements can be taken and ∆Ct or ∆∆Ct values can be calculated by applying simple mathematics. Where MATLAB is separated from other programs or tools is wide options of statistical analysis it provides; statistical tests include t-test, sign test, ANOVA, ANCOVA, Kruskal-Wallis, chi-square, linear and nonlinear regression etc. It allows choosing the proper test for data analysis 69.
1.7.2 Outlier Analysis
In order to check the quality of data, further analyses should be performed. Performing the experiments with replicates allows distinguishing the outlier data caused by technical or personal mistakes. In real engineering and scientific applications, it is widely known that outliers are most probably to be focused primarily in every operating step 70. One important aspect of qPCR analysis is that the reaction should produce a single amplicon with a predetermined and stable Tm value obtained upon melt curve analysis. Thus, it is important to detect outliers based on Tm values automatically in a cDNA panel for exclusion since these outliers might represent different amplification products (e.g., dimers) than the one intended.
21
2. AIM
Literature search indicated that determining molecular subtypes of breast cancer is important in diagnosis. Early diagnosis and therapy of breast cancer is very important to increase survival rates. ER pathway plays role in the development and growth of breast cancer. CHRNA5 activity has effects on pathways controlling cell motility, proliferation, differentiation and apoptosis 42. Our previous studies49,50 demonstrated that CHRNA5 might be regulated by estrogen 49 based on microarray data expression analysis and was modulated by estrogen in a time dependent manner. In vivo, ER- cells were likely to express more CHRNA5 based on GEO dataset analyses 49. However, in vivo cDNA panel validation of CHRNA5 expression in association with ER status has not been performed yet.
In this study, our aim is a) to test whether isoform specific CHRNA5 expression responds similarly to estrogen exposure in ER positive and ER negative cell lines in a dose dependent manner; b) to assess effects of the E2 antagonist tamoxifen and long term E2 depletion in MCF7 cells; and c) to investigate isoform specific expression profile in vivo for diagnosis of breast cancer.
Our experimental approaches include testing CHRNA5 isoform expression by qPCR in response to different doses of E2 in MCF7 (ER+) and MDA MB 231 (ER-) cell lines, and as well as CHRNA5 response to tamoxifen, an inhibitor of estrogen response, when given alone or together with estrogen in MCF7 cells. We also developed a long term estrogen depletion (LTED) model in MCF7 cells to test whether LTED affects ESR1 as well as CHRNA5 isoform expression. We then tested whether CHRNA5 expression differs among a set of tumor samples with different molecular subtype characteristics using a commercial cDNA panel. We developed MATLAB cDNA panel analysis GUI for quality control and statistical analysis of qPCR data obtained from OriGene cDNA panels.
22
3. MATERIALS AND METHODS
3.1 Cell Culture Protocols
3.1.1 Cell Lines
For this study, two different cell lines (MCF7, MDA MB 231) were used (ATCC; Manassas, USA). They have been cultured in Bilkent University MBG laboratories. In order to study the effect of E2, ER- and ER+ cell lines were studied. The origin of the cell lines can be found in Table 3.1 71.
Table 3.1: Breast cancer cell lines origin
Name Source Tumor Age Ethicity
MCF7 PE IDC 69 White
MDA MB 231
PE AC 51 White
AC, adenocarcinoma; IDC, invasive ductal carcinoma; PE, pleural effusion.
The receptor status and molecular subtypes of cell lines are listed in Table 3.2.
Table 3.2: The receptor status and molecular subtypes of cell lines
Name ER PR HER2 Molecular subtype
MCF7 + + - Luminal A MDA
MB 231
- - - Basal
3.1.2 Cell Growth Conditions
DMEM (SH30021.01), FBS (SW30160.03), Penicillin/Streptomycin Solution (SV30010) and Trypsin/EDTA solution (SH30042.01) were from HyClone (Logan,
23
USA). Non-essential amino acid solution (K0293) (Berlin, Germany) and PBS (17-516F) (Lonza ,Switzerland) were used to prepare medium.
The complete growth medium of MCF7 and MDA-MB-231 cells included DMEM with 10% Fetal Bovine Serum, 1% Penicillin/Streptomycin solution and 1% Non-essential amino acids.
3.1.3 Thawing Cells
The frozen cell vial obtained from liquid nitrogen was placed in the water bath at 37°C. After melting, the cells were taken to a 15 ml, sterile tube and total volume was adjusted to 5 ml with complete medium. The cells were then centrifuged at 1500 rpm for 5 minutes; the supernatant was aspirated; the cells were re-suspended in 1 ml of complete growth medium and seeded in T25 flasks (Greiner Bio One, Frickenhausen, Germany) with 7-8 ml of complete medium.
3.1.4 Subculturing of Cells
All cell types were grown in T75 flasks (Grenier Bio One, Frickenhausen, Germany) with 12-13 ml of complete medium in an incubator with 5% CO2 at 37°C. When the cells reached 80-90% confluency, on average, after 3 days, they were passaged to new flasks. For passaging, the old growth medium was aspirated; flasks were washed with 5 ml PBS. 1 ml Trypsin/EDTA solution was then added to cover the bottom of them for 5-8 minutes in 37°C incubator for detachment of cells, which were then collected from flasks using 7-8 ml complete growth medium and centrifuged at 1500 rpm for 5 minutes. The supernatant was aspirated; the cells were re-suspended in complete medium and were seeded into new flasks with the desired dilution depending on the amount of pellet and the type of experiment.
3.1.5 Cryopreservation of Cells
For cryopreservation, detached cells which were aspirated the old medium washed with PBS and trypsinized were centrifuged at 1500 rpm from 5 minutes. Medium were aspirated; and pellet was re-suspended in freezing medium (10% DMSO in FBS). 1.5-2 ml of this was put into cryotube and stored at -20°C for 1-2 hours, then
24
transferred to - 80°C. For long-term storage the cryotubes should be stored in liquid nitrogen.
3.1.6 Counting Cells with Hemocytometer
Cells were counted before seeding them for an experiment using hemocytometer. Cell pellet obtained after 5 minutes of centrifugation at 1500rpm was completely dissolved in 10ml medium; medium was chosen depending on cell type. Then cells were diluted 1:10 and 10 µl form this diluted solution was put on hemocytometer. Cells from four corners (Figure 3.1.B) of hemocytometer were counted and the total number was divided to 4. The division gave the number of how many millions cells 10ml medium had.
Figure 3.1: A. Scheme of a whole hemocytometer. B. Right bottom corner of hemocytometer
3.1.7 β-Estradiol (E2) Treatment
For β-Estradiol (E2) (E2758; Sigma Aldrich, Missouri,USA) treatment, MCF7 and MDA-MB231 cell lines were used. E2 stock solution was prepared by dissolving 27.238 mg E2 in 50 ml 100% sterile EtOH (32221) (Sigma Aldrich, Missouri, USA) so final concentration was 2mM. The stock solution was filtered; aliquoted; and stored in -20°C.
Final E2 treatment concentration were prepared as 1nM, 10nM, and 100nM dilutions were made in phenol red-free Dulbecco’s MEM (F0475; Biochrom AG, Berlin, Germany) with 5% charcoal/dextran-treated FBS (SH30068.02) (Hyclone, Logan,
25
USA), 1% penicillin/streptomycin solution and 1% non-essential amino acids. First, 2mM stock solution was serially diluted as 1:10, 1:100 to obtain 0.2 mM and 0.02mM E2 solutions, then from each solutions (0.02 mM, 0.2 mM, 2 mM) 1 µl was put into 20ml phenol red-free DMEM with 5% charcoal/dextran-treated FBS to obtain 1nm, 10nm and 100nm E2 solutions, respectively.
The medium for E2 control group was prepared by adding 1 µl of 100% EtOH to 20 ml phenol red-free DMEM with 5% charcoal/dextran-treated FBS, because for all doses of E2, same amount of (0.005v/v % EtOH) 100% EtOH was used.
MCF7 and MDA MB231 were counted and seeded in 8 T75 flasks for each cell line at a concentration of 1 x 10⁶ cells/ flask. They were incubated with complete DMEM (SW30160.0, HyClone (Logan, USA)) for 24 hours. After 24 hours, the media of the cells were changed to phenol red-free DMEM with 5% charcoal dextran-treated FBS and incubated for 72 hours. Then, the media then was changed to phenol red-free DMEM with 0.1% charcoal/dextran-treated FBS to synchronize cells for 24 hours. 0.1% FBS medium was aspirated and replaced with 12 ml of dose-specific media (Control, 1nM, 10nM,100nM) as explained above was added to the flasks. Each dose was performed in duplicates. After 24 hours all treatments were collected.
3.1.8 Tamoxifen and E2 Treatment
For tamoxifen (4-OHT) (S1972, Selleck Chem) and E2 treatment MCF7 cell line was used.
2mM E2 stock solution prepared as explained above was diluted 1:10 and 0.5 µl of this was added to 10ml phenol red-free DMEM with 5% charcoal/dextran-treated FBS to obtain 10nm E2 concentration in medium.
To obtain 1µM 4-OHT concentration in medium, 1µl from 10mM 4-OHT was added in 10ml phenol red-free DMEM with 5% charcoal/dextran-treated FBS.
The medium for E2 control group was prepared by adding 1 µl of 100% EtOH to 20 ml phenol red-free DMEM with 5% charcoal/dextran-treated FBS (0.005v/v % EtOH), and the medium for 4-OHT control group was prepared by adding 0.5 µl of
26
DMSO to 5 ml (0.01v/v % DMSO) phenol red-free DMEM with 5% charcoal/dextran-treated FBS.
MCF7 breast cancer cells/well were counted and seeded in 8 wells of 2 6-well plate as 2x10⁵ cells/well. They were incubated in complete DMEM for 24h. Then same procedure with β-Estradiol (E2) treatment has been performed until 6th day of seeding. After 24h synchronization, cells were treated with 1uM 4-OHT+10nm E2, 10nm E2, 1uM 4-OHT, EtOH and DMSO as duplicated for 24h. After 24 hours all treatments were collected.
For expression analysis deltadeltaCT (TPT1-Target gene (deltaCt) normalized with control) method was used. 4-OHT treated samples were normalized with DMSO, E2 treated samples were normalized with EtOH and 4-OHT-E2 treated samples were normalized with average of DMSO-EtOH.
3.1.9 Long-term E2 Depletion of Cells
In order to establish a long-term E2 depletion model, MCF7 cell line was used. To prepare depletion and control medium, phenol red-free DMEM with 10% charcoal/dextran-treated FBS was used. For control, 2mM E2 stock solution was diluted 1/10 to obtain 0.2mM E2 and 2µl from this was added to 40ml phenol red-free DMEM with 10% charcoal/dextran-treated FBS. For depletion, only 2µl EtOH was added in 40ml phenol red-free DMEM (0.005v/v % EtOH) with 10%
charcoal/dextran-treated FBS.
For 3 months, MCF7, divided into two flasks after growing in complete DMEM for 2 days, was cultured in depletion and control medium. Pellets were taken in every three days. After 3 months, cells were collected for cryopreservation for 2 months. Then, cells 4x10 6 were seeded, grown for 3 days, and pellets were collected for 4 weeks. There are totally 15 samples from 15 different time points, first three samples belong to first month, 4.-6. Samples belong to second month and samples from 7 to 9 are from third month, while last five samples belong to sixth month (Table 8.2).
27
3.2 Gene Expression Analyses
3.2.1 Total RNA Isolation
Cell pellets taken from flasks should be preserved at -80°C. Before total RNA isolation pellets were taken from -80°C and thawed on ice. Then, they were completely dissolved in 1ml TRIzol Reagent (15596-026) (Life Technologies, California, USA). Dissolved lysates were transferred into 1.5ml tubes and 200µl chloroform was added to each tubes. Tubes were shaken vigorously for 15 seconds and set for 3 minutes at room temperature. Then tubes were centrifuged at 13.200 rpm for 17 minutes at 4°C. In this critical step, lysates were separated into three phases; the top and clear phase included RNA; this was carefully taken and transferred into a new tube. 500µl isopropanol was added to new tubes and tubes were gently inverted for 4-5 times. After 10 minutes at RT, they were centrifuged at 4°C for 12 minutes at 13.200 rpm. The supernatant was carefully removed to preserve pellet at the bottom of the tubes, the pellet as washed with 75% EtOH and centrifuged at 8.000 rpm for 8 minutes at 4°C. EtOH was discarded; the pellet was washed with 100% EtOH and centrifuged at 8.000 rpm for 8 minutes at 4°C. The pellet was dried after discarding EtOH; and dissolved in 30-50µl Hypure Molecular Biology Grade water (SH30538.03) (Hyclone, Logan, USA). RNA concentration and quality were measured with NanoDrop® ND-1000 spectrophotometer (NanoDrop Technologies, USA). RNA was stored at -80°C.
3.2.2 cDNA Synthesis
Total RNA was used to synthesize cDNA. RevertAid First Strand cDNA Synthesis Kit (K1621) (Thermo Fisher Scientific, Massachusetts, USA) was preferred to synthesize cDNA. In order to synthesize 1ng cDNA, required volume of RNA was calculated and H2O to complete RNA volume to 11µl was added to tubes. 1µl
oligo(dT) primer was used. Other components were added in this order; 4 µl 5x Reaction Buffer, 1 µl RiboLock RNase Inhibitor, 2 µl 10 mM dNTP Mix, 1 µl RevertAid M-MuLV Reverse Transcriptase. The tubes were incubated at 42°C for 60 min, then 5 minutes at 70°C. They were stored at - 20°C.
28 3.2.3 Oligonucleotides
Table 3.3 presents the primers used in this study.
Table 3.3: Primer sequences, their product sizes and efficiencies
Name Primer sequence (5'-3')
Size of amplicon(bp) Amplification efficiency CHRNA5_v1 F: AGATGGAACCCTGATGACTATGGT R:AAACGTCCATCTGCATTATCAAAC 104 1.87 CHRNA5_v2 F:GGAAACTGAGAGTGGTAGTGGA R:CTTCAACAACCTCACGGACA 122 1.95 CHRNA5_v3* F:CATCAGGTGTTGAAGATTGGAAAT R:AAAAAGCCCAAGAGATCCAACAAT 101 1.92 CHRNA5_iso2** F:TGGAGAATGGGAGATTGTGAGTGCA R:CCAATCTTCAACAACCAGCAACAGC 78 1.97 CHRNA5_iso3** F:TGGAGAATGGGAGATTGTGAGTGCA R:CCAATCTTCAACAACGGATACCAGC 78 1.96 TPT1 F:GATCGCGGACGGGTTGT R:TTCAGCGGAGGCATTTCC 100 1.95 PS2 (TFF1)*** F:CCATGGAGAACAAGGTGATCTGC R:TTAGGATAGAAGCACCAGGGGAC 208 1.85 ESR1 F:AGACATGAGAGCTGCCAACC R: GCCAGGCACATTCTAGAAGG 299 1.78
FOSL2 F: GGCCCAGTGTGCAAGATTAGCC R: TTTCACCACTACAGCGCCCACC 105 1.99
*(Warzecha et al. 2009) ** (Falvella et al. 2013) ***Alotaibi et al. 2006
CHRNA5 primers used in this study bind the regions showed in Figure 3.2 on exons 4- 6 of CHRNA5.
29 A
B
Figure 3.2: Scheme of binding regions of CHRNA5 isoform primers A. Newly designed CHRNA5 isoforms used in the experiments on exon 4 – 6 of CHRNA5; CHRNA5_v1_F&R detects multiple isoforms while other ones correspond to a transcript that contain a certain part of the gene. B. Previously known (Falvella et al. 2013) CHRNA5 isoforms used in the
experiments on exon 4-6 of CHRNA5 (Only ~150bp of ExonVI was showed in this figure 1446bp-1596bp).
3.2.4 Gradient Polymerase Chain Reaction
Gradient Polymerase chain reaction (gPCR) was performed using OneTaq Quick-Load Master Mix (M0486L) (New England Biolabs, Massachusetts, USA). New primers were tested with this technique using 5 different annealing temperatures (54-62°C) to see in which Tm primers work best. Gradient PCR reaction was prepared as explained in Table 3.4.
Table 3.4: PCR reagents and their volumes
Reagent Volume (µl)
2x SYBR Green I Master Mix 5 Forward Primer (10pmol) 1 Reverse Primer(10pmol) 1 DNase/RNase-free water 1
cDNA 2
30
PCR was performed under conditions listed in Table 3.5.
Table 3.5: PCR conditions
Step Temperature & Duration
Initial Denaturation 95°C, 5’
Denaturation 95°C, 30” Annealing 58°C ∆10, 1.5’ 40 cycles
Extension 68°C 1’ Final Extension 68°C 10’
3.2.5 Agarose Gel Electrophoresis
1.5% agarose gel was prepared with 200ml 1xTAE buffer and 3gr agarose. 1mg/ml ethidium bromide solution was added and allowed to polymerase. The wells were loaded with 10-12 μl PCR product (for 22 well/gel) or 8-10µl PCR product (for 40 well/gel). 3 μl GeneRuler 100bp DNA ladder (SM0241) (Thermo Scientific, Waltham, Massachusetts, USA) was used as marker.
3.2.6 Quantitative Real Time-Polymerase Chain Reaction (qPCR)
Quantitative real time-polymerase chain reactions (qPCR) were performed using LightCycler® 480 SYBR Green I Master (04887352001) (Roche Applied Science, Germany). Experiments were performed using every sample as at least duplicates or more, including negative controls.
Plates were LightCycler® 480 Multiwell Plate 96 (04729692001) and (Roche Applied Sciences, Germany) PCR machine was LightCycler® 480 PCR Instrument (Roche Applied Science, Germany). qPCR reaction was prepared as explained in Table 3.6
31
Table 3.6: qPCR reagents and their volumes
Reagent Volume (µl)
2x OneTaq QuickLoad Master Mix 12.5 Forward primer (10pmol) 1
Reverse primer (10pmol) 1
cDNA 1
DNase/RNase-free water 9.5
Total 25
qPCR was performed under conditions listed in Table 3.7.
Table 3.7: qPCR conditions
Step Temperature & Duration
Initial Denaturation 95°C, 5’ Denaturation 95°C, 10” Annealing 58°C, 20” 50 cycles Extension 72°C, 20” Acquisition 95°C, 5” 55°C, 1’ 95°C, Continuous acquisition Final Extension 40°C, 10”