Article
Oncogenic Signaling Pathways in The Cancer
Genome Atlas
Graphical Abstract
Highlights
d
Alteration map of 10 signaling pathways across 9,125
samples from 33 cancer types
d
Reusable, curated pathway templates that include a
catalogue of driver genes
d
57% of tumors have at least one potentially actionable
alteration in these pathways
d
Co-occurrence of actionable alterations suggests
combination therapy opportunities
Authors
Francisco Sanchez-Vega, Marco Mina,
Joshua Armenia, ..., Giovanni Ciriello,
Chris Sander, Nikolaus Schultz
Correspondence
[email protected] (G.C.),
[email protected] (C.S.),
[email protected] (N.S.)
In Brief
An integrated analysis of genetic
alterations in 10 signaling pathways
in >9,000 tumors profiled by TCGA
highlights significant representation of
individual and co-occurring actionable
alterations in these pathways, suggesting
opportunities for targeted and
combination therapies.
Sanchez-Vega et al., 2018, Cell173, 321–337
April 5, 2018ª 2018 Elsevier Inc.
Article
Oncogenic Signaling Pathways
in The Cancer Genome Atlas
Francisco Sanchez-Vega,1,2,30Marco Mina,4,30Joshua Armenia,1,2,30Walid K. Chatila,1Augustin Luna,5Konnor C. La,1
Sofia Dimitriadoy,6David L. Liu,7Havish S. Kantheti,8Sadegh Saghafinia,4Debyani Chakravarty,1Foysal Daian,1
Qingsong Gao,9Matthew H. Bailey,9Wen-Wei Liang,9Steven M. Foltz,9Ilya Shmulevich,10Li Ding,9,11Zachary Heins,1
Angelica Ochoa,1Benjamin Gross,1Jianjiong Gao,1Hongxin Zhang,1Ritika Kundra,1Cyriac Kandoth,1Istemi Bahceci,12
Leonard Dervishi,12Ugur Dogrusoz,12Wanding Zhou,13Hui Shen,13Peter W. Laird,13Gregory P. Way,24
Casey S. Greene,24Han Liang,25Yonghong Xiao,26Chen Wang,27Antonio Iavarone,28Alice H. Berger,14
Trever G. Bivona,15Alexander J. Lazar,16Gary D. Hammer,17Thomas Giordano,18Lawrence N. Kwong,19
(Author list continued on next page)
SUMMARY
Genetic alterations in signaling pathways that control
cell-cycle progression, apoptosis, and cell growth
are common hallmarks of cancer, but the extent,
mechanisms, and co-occurrence of alterations in
these pathways differ between individual tumors
and tumor types. Using mutations, copy-number
changes, mRNA expression, gene fusions and DNA
methylation in 9,125 tumors profiled by The Cancer
Genome Atlas (TCGA), we analyzed the mechanisms
and patterns of somatic alterations in ten canonical
pathways: cell cycle, Hippo, Myc, Notch, Nrf2,
PI-3-Kinase/Akt, RTK-RAS, TGF
b signaling, p53 and
b-catenin/Wnt. We charted the detailed landscape
of pathway alterations in 33 cancer types, stratified
into 64 subtypes, and identified patterns of
co-occur-rence and mutual exclusivity. Eighty-nine percent of
tumors had at least one driver alteration in these
pathways, and 57% percent of tumors had at least
one alteration potentially targetable by currently
available drugs. Thirty percent of tumors had
multi-ple targetable alterations, indicating opportunities
for combination therapy.
INTRODUCTION
Cancer is a disease in which cells have acquired the ability to
divide and grow uncontrollably (Hanahan and Weinberg, 2000,
Hanahan and Weinberg, 2011), usually through genetic alter-ations in specific genes. Advances in DNA sequencing over the past decade have made it possible to systematically study these genetic changes, and we now have a better understanding of the
commonly involved processes and signaling pathways (
Garr-away and Lander, 2013; Vogelstein et al., 2013). As more genetic
alterations become targetable by specific drugs, DNA
sequencing is becoming part of routine clinical care (Hartmaier
et al., 2017; Schram et al., 2017; Sholl et al., 2016; Zehir et al.,
2017). However, there is considerable variation in the genes
and pathways altered across different tumor types and individual tumor samples, and a complete understanding of the genes and
1Marie-Jose´e and Henry R. Kravis Center for Molecular Oncology, Memorial Sloan Kettering Cancer Center, New York, NY 10065, USA 2Human Oncology and Pathogenesis Program, Memorial Sloan Kettering Cancer Center, New York, NY 10065, USA
3Departments of Epidemiology and Biostatistics, Memorial Sloan Kettering Cancer Center, New York, NY 10065, USA
4Department of Computational Biology, University of Lausanne (UNIL), 1011 Lausanne, Vaud, Switzerland and Swiss Institute of
Bioinformatics (SIB), Lausanne, Switzerland
5cBio Center, Dana-Farber Cancer Institute, Boston, MA; Department of Cell Biology, Harvard Medical School, Boston, MA 6Princeton University, Princeton, NJ, USA
7Department of Medical Oncology, Dana-Farber Cancer Institute, Boston, MA; Cancer Program, Broad Institute of MIT and Harvard,
Cambridge, MA, US
8University of Texas at Dallas, Richardson, TX 75080, USA
9Department of Medicine and McDonnell Genome Institute, Washington University in St. Louis, St. Louis, Missouri, 63110, USA 10Institute for Systems Biology, Seattle, WA, USA
11Siteman Cancer Center, Washington University School of Medicine, St. Louis, MO 63110, USA 12Computer Engineering Department, Bilkent University, Ankara 06800, Turkey
13Van Andel Research Institute, 333 Bostwick Ave NE, Grand Rapids Michigan, 49503, USA 14Human Biology Division, Fred Hutchinson Cancer Research Center, Seattle, WA 98109, USA
15UCSF Helen Diller Family Comprehensive Cancer Center, University of California San Francisco, 1450 3rd Street, San Francisco, California
94143, USA
16Departments of Pathology, Genomic Medicine & Translational Molecular Pathology, The University of Texas MD Anderson Cancer Center,
1515 Holcombe Blvd-Unit 85, Houston, Texas 77030, USA
(Affiliations continued on next page)
pathways altered in all cancer types is essential to identify poten-tial therapeutic options and vulnerabilities.
Several important signaling pathways have been identified as frequently genetically altered in cancer, including the RTK/ RAS/MAP-Kinase (hereafter also called RTK-RAS for brevity)
pathway, PI3K/Akt signaling, and others (Vogelstein and Kinzler,
2004). Members of these pathways and their interactions have
been captured in a number of pathway databases, such as
Pathway Commons (Cerami et al., 2011), which aggregates a
number of databases, including REACTOME (Joshi-Tope et al.,
2005) and KEGG (Kanehisa and Goto, 2000). Genes in key
path-ways are not altered at equal frequencies, with certain genes recurrently altered and well-known in cancer, while others are only rarely or never altered.
The detection of recurrence of rare alterations often requires
large numbers of samples (Lawrence et al., 2014). This is
confounded by the challenge to distinguish between functionally relevant (or ‘‘driver’’ alterations) and non-oncogenic
‘‘passen-ger’’ events (Gao et al., 2014), especially in tumor types with a
high background mutation burden (Alexandrov et al., 2013;
Law-rence et al., 2013). In these cases, many mutations, even when they occur in cancer genes, may have no functional effect. This
topic is further addressed in Bailey et al. (Bailey et al., 2018).
Previous studies by The Cancer Genome Atlas (TCGA) have incrementally mapped out the alteration landscape in signaling pathways. Certain pathways, such as RTK-RAS signaling or the cell-cycle pathway, are altered at high frequencies across many different tumor types, whereas other pathways are altered in more specific subsets of malignancies (e.g., alterations in the oxidative stress response pathway are strongly associated with squamous histologies). With >10,000 samples characterized by
TCGA, there is an opportunity to systematically characterize and define the alterations within well-known cancer pathways across all tumor types and map out commonalities and differences across pathways. The existence of shared genomic features across histologies has been highlighted by several studies (Ciriello et al., 2013; Hoadley et al., 2014, 2018), but these studies traditionally used a gene-centric, as opposed to pathway-centric, approach. Identifying relationships of inter- and intra-pathway recurrence, co-occurrence or mutual exclusivity across different types of cancers can help elucidate functionally relevant mechanisms of oncogenic pathway alterations that might inform treatment options.
Here, we worked within the framework of the TCGA PanCancer
Atlas initiative (Cancer Genome Atlas Research Network et al.,
2013c) to build a uniformly processed dataset and a unified data analysis pipeline aimed at exploring similarities and differences in canonical cancer pathway alterations across 33 cancer types. The focus of this effort is on mitogenic signaling pathways with vidence for functional alterations; other oncogenic processes,
such as alterations in DNA repair (Knijnenburg et al., 2018), the
spliceosome (Seiler et al., 2018), ubiquitination (Ge et al., 2018),
or metabolic pathways (Peng et al., 2018), as well as the effects
of splicing mutations (Jayasinghe et al., 2018), are covered by
other efforts of the TCGA PanCancer Atlas project.
RESULTS Dataset
We evaluated all samples in the TCGA PanCancer Atlas collec-tion for which the following data types were available: somatic mutations (whole-exome sequencing), gene expression levels
Grant McArthur,20,29Chenfei Huang,21Aaron D. Tward,22Mitchell J. Frederick,21Frank McCormick,23
Matthew Meyerson,7and The Cancer Genome Atlas Research Network, Eliezer M. Van Allen,7,31Andrew D. Cherniack,7,31
Giovanni Ciriello,4,31,*Chris Sander,5,31,*Nikolaus Schultz1,2,3,31,32,*
17Department of Internal Medicine, Division of Metabolism, Endocrinology and Diabetes, Endocrine Oncology Program, University of
Michigan, Ann Arbor, Michigan, MI 48105, USA
18Department of Pathology, University of Michigan Medical School, Ann Arbor, MI; Department of Internal Medicine, Division of Metabolism,
Endocrinology & Diabetes, University of Michigan Medical School, Ann Arbor, MI; Comprehensive Cancer Center, Michigan Medicine, Ann Arbor, MI, USA
19Department of Translational Molecular Pathology, The University of Texas MD Anderson Cancer Center, Houston, TX, USA 20Peter MacCallum Cancer Centre, Melbourne, VIC, Australia
21Dept. of Otolaryngology, Baylor College of Medicine, USA
22University of California, San Francisco Department of Otolaryngology-Head and Neck Surgery. 2233 Post Street, San Francisco,
CA, 94143, USA
23UCSF Helen Diller Family Comprehensive Cancer Center, University of California San Francisco, 1450 3rd Street, San Francisco,
CA 94143, USA
24Department of Systems Pharmacology and Translational Therapeutics, University of Pennsylvania, Philadelphia, PA, 19104, USA 25Department of Bioinformatics and Computational Biology, The University of Texas MD Anderson Cancer Center, Houston, TX, 77030, USA 26TESARO Inc., Waltham, MA, 02451, USA
27Department of Health Sciences Research and Department of Obstetrics and Gynecology, Mayo Clinic College of Medicine, 200 First Street
SW, Rochester, MN, 55905, USA
28Institute for Cancer Genetics, Department of Neurology and Department of Pathology and Cell Biology, Columbia University Medical
Center, New York, NY, 10032, USA
29University of Melbourne, Melbourne, VIC, Australia 30These authors contributed equally
31Co-senior author 32Lead contact
*Correspondence:[email protected](G.C.),[email protected](C.S.),[email protected](N.S.) https://doi.org/10.1016/j.cell.2018.03.035
A
B
Pathway analyses in prior TCGA publications Pathway databases Scientific literature &
review articles
Curated pathway templates
Data analysis and visualization tools: Relevant somatic alterations
in tabular format Cancer Type CDKN2A MDM2 MDM4 TP53 16% 4% 3% 35%
Genetic Alteration AmplificationDeep DeletionTruncating Mutation (putative driver)Truncating Mutation (putative passenger) Inframe Mutation (putative driver)Inframe Mutation (putative passenger)Missense Mutation (putative driver) Missense Mutation (putative passenger)
Recurrently altered genes (MutSig, Lawrence et al., TCGA Copy-Number Portal)
Pathway-specific expert or analysis working group review
cBioPortal
PathwayMapper
Initial definition of
pathway templates Pathway curation
Final pathway templates and analysis
SELECT
Definition of driver alterations
Recurrently mutated positions Known driver mutations
TSG / OG labels Uniformly processed
genomic data for TCGA PanCancer Atlas
IDHwt (n=92) IDHmut-codel (n=167) IDHmut-non-codel (n=248) UVM (n=80) HPV+ (n=72) HPV- (n=415) ACC (n=76) PCPG (n=161) THCA (n=480) LUAD (n=502) LUSC (n=464) MESO (n=82) Normal (n=36) Her2-enriched (n=78) Basal (n=171) LumB (n=197) LumA (n=499) POLE (n=10) GS (n=58) MSI (n=63) CIN (n=328) POLE (n=9) EBV (n=30) GS (n=51) MSI (n=75) ESCC (n=90) CIN (n=297) CHOL (n=36) LIHC (n=348) PAAD (n=152) BLCA (n=399) KICH (n=65) PRAD (n=479) Seminoma (n=62) Non-seminoma (n=82)Adenocarcinoma (n=43) Squamous Carcinoma (n=229)OV (n=177) POLE (n=49)MSI (n=148) CN LOW (n=147) CN HIGH (n=163) UCS (n=56) SKCM (n=363) Other (n=20) DDLPS (n=46) MFS/UPS (n=80)LMS (n=83) DLBC (n=37)LAML (n=162) THYM (n=119) BRCA CRC STES HNSC LGG GBM (n=126) SARC UCEC CESC TGCT Core GI Breast Thoracic Endocrine
Head & Neck
Eye CNS Hem./Lymph. Soft Tissue Skin Gynecologic Urologic Developmen-tal GI tract KIRC (n=352) KIRP (n=271)
9,125
tumors
Known functional gene fusions/rearrangementsEpigenetic silencing calls (RESET + manual curation)
Removal of non-altered genes
Preliminary pathway templates
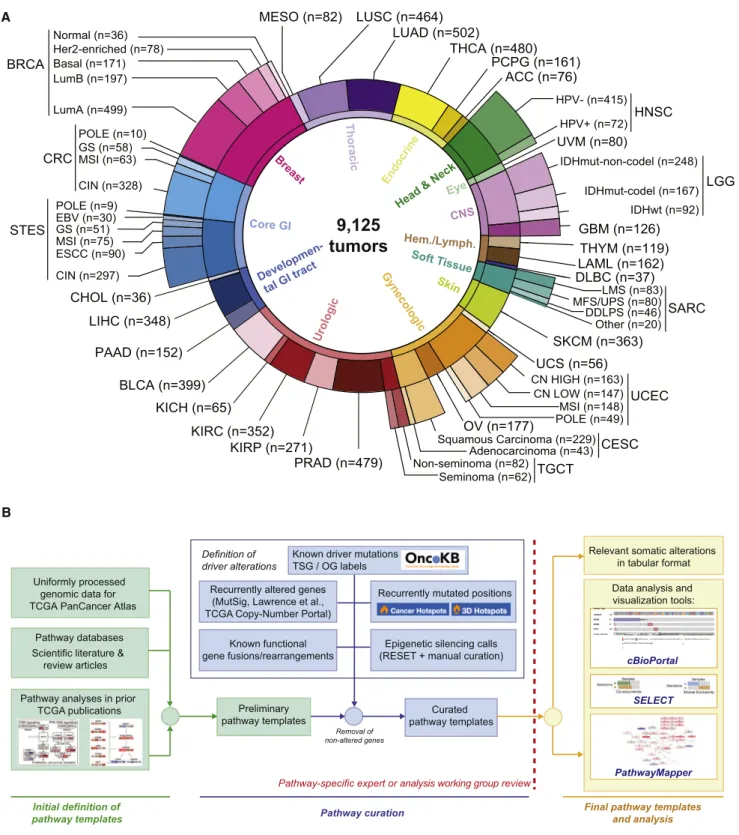
Figure 1. TCGA PanCancer Atlas Pathways Dataset and Workflow
(A) Distribution of cancer types in the cohort, including molecular subtypes analyzed.
(B) Workflow for pathway curation and analysis. Genes were curated from previous TCGA efforts and the scientific literature. Only genes with evidence for statistically recurrent or known driver alterations in the uniformly processed TCGA PanCancer Atlas dataset were included in the curated pathway templates. TCGA disease codes and abbreviations: AML, acute myeloid leukemia; ACC, adrenocortical carcinoma; BRCA, breast cancer; CESC, cervical cancer; KICH, chromophobe renal cell carcinoma; KIRC: clear cell kidney carcinoma; CRC, colorectal adenocarcinoma; SKCM, cutaneous melanoma; DLBC, diffuse large B cell lymphoma; GBM, glioblastoma multiforme; HNSC, head and neck squamous cell carcinoma; LIHC, liver hepatocellular carcinoma; LGG, lower grade glioma; (legend continued on next page)
(RNA-Seq), DNA copy-number alterations (Affymetrix SNP6 arrays), and DNA methylation (Infinium arrays). This resulted in a final set of 9,125 samples from 33 different cancer types (Figure 1A, Table S1). In order to account for molecular or histological subtypes, these cancer types were further stratified into a total of 64 genomically distinct tumor subtypes, as previously defined by the individual TCGA analysis working
groups (Figure 1A, Table S1). All genomic data and clinical
attributes per sample can be visualized through the cBioPortal
for Cancer Genomics at http://www.cbioportal.org/ (Cerami
et al., 2012).
Definition of Pathways and Alterations
We evaluated 10 canonical signaling pathways with frequent genetic alterations, starting with key cancer genes explored in these pathways in previous TCGA publications, and focused on pathway members likely to be cancer drivers (functional con-tributors) or therapeutic targets. The pathways analyzed are: (1) cell cycle, (2) Hippo signaling, (3) Myc signaling, (4) Notch signaling, (5) oxidative stress response/Nrf2, (6) PI-3-Kinase signaling, (7) receptor-tyrosine kinase (RTK)/RAS/MAP-Kinase
signaling, (8) TGFb signaling, (9) p53 and (10) b-catenin/Wnt
signaling (Figures 2andS1,Table S2). Alterations in DNA repair
pathways, epigenetic modifiers, splicing, and other cellular pro-cesses frequently altered in cancer were not included, as these primarily provide a background of genomic instability, rather than specifically proliferative potential.
We began by compiling and reviewing the full set of cancer-type specific pathway diagrams from the compendium of
TCGA manuscripts published between 2008 and 2017 (Brennan
et al., 2013; Cancer Genome Atlas Network, 2012a, 2012b, 2015a, 2015b, Cancer Genome Atlas Research Network, 2008, 2011, 2013a, 2013b, 2014a, 2014b, 2014c, 2014d, 2017a, 2017b; Davis et al., 2014), each of which included the pathway genes found to be genetically altered in the individual tumor types. These pathway diagrams are publicly available as
pre-defined network templates within the www.PathwayMapper.
orgvisualization tool (Bahceci et al., 2017). By taking the union
of pathway members across multiple TCGA studies, we pro-duced a consolidated list of candidate member genes for each of the ten pathways. These were then further curated based on updated literature (including but not limited to the references in
Table S2), public pathway databases, and expert opinion (Figure 1B).
The selected genes in the ten pathways were then assessed for recurrent alterations within and across different tumor types
as follows (Figure 1B): Alterations of pathway members were
classified as activating events (usually specific recurrent missense mutations, i.e., hotspot mutations, amplifications, or fusions involving oncogenes) or inactivating events (truncating
mutations, specific recurrent missense or inframe mutations, deletions, as well as fusions and promoter hypermethylation of tumor suppressor genes). Individual alterations were also scruti-nized for two features: statistical recurrence across sets of tumor samples and presumed functional impact. We first assessed
sta-tistical recurrence using MutSigCV (Lawrence et al., 2014) for
mutations and GISTIC 2.0 (Mermel et al., 2011) for copy-number
alterations. In order to identify likely functional variants, we then used recurrence across tumor samples at the residue level (linear
and 3D mutational hotspots;Chang et al., 2016, 2018; Gao et al.,
2017; seeSTAR Methods) and prior knowledge about specific
variants via the OncoKB knowledge base, which contains infor-mation about the oncogenic effects and treatment implications
of variants in > 400 cancer genes (Chakravarty et al., 2017a).
Epigenetic silencing through promoter DNA hypermethylation of tumor suppressor genes was evaluated using the RESET
algo-rithm (see STAR Methods). Gene fusions and structural
rear-rangements were called from RNA-Seq data using a combina-tion of the STAR-Fusion, EricScript and BreakFast algorithms (Gao et al., 2018, see STAR Methods), and likely passenger events were filtered out based on OncoKB annotation. Through this process, genes without evidence for recurrent or previously known oncogenic alterations were removed from the preliminary pathway templates. The resulting curated pathway templates and the identified genetic alterations were vetted for functional importance by individual pathway experts or the corresponding TCGA PanCancer Atlas pathway-specific analysis working
groups, when applicable (Figure 1B). The pathway member
genes and the genetic alterations considered as oncogenic are
listed inTable S3, and binary genomic alteration matrices are
provided asTable S4(seeSTAR Methods).
The resulting comprehensive dataset of different types of alterations across many tumor types form the basis of all subse-quent analyses regarding pathways, patterns of co-occurrence and mutual exclusivity, as well as potential therapeutic
implica-tions. The simplified pathway diagrams in Figure 2 show the
most frequently altered genes in the ten pathways, including alteration frequencies as well as the types of oncogenic alter-ations identified in each of the genes.
Pathway Alteration Frequencies per Tumor Type
For each tumor type and subtype, we computed the fraction of samples with at least one alteration in each of the 10 signaling
pathways (Figure 3). A tumor sample was considered as altered
in a given pathway if one or more genes in the pathway contained a recurrent or known driver alteration (as described above). Despite the fact that non-recurrent and not previously known alterations were filtered out as likely passenger events and were not included in the alteration frequencies, the microsatellite
instability (MSI) and polymerase ε (POLE) mutant subtypes of
LUAD, lung adenocarcinoma; LUSC, lung squamous cell carcinoma; OV, ovarian serous cystadenocarcinoma; KIRP, papillary kidney carcinoma; THCA, papillary thyroid carcinoma; STAD, stomach adenocarcinoma; PRAD, prostate adenocarcinoma; BLCA, urothelial bladder cancer; UCS, uterine carcinosarcoma; UCEC, uterine corpus endometrial carcinoma; ESCA, esophageal cancer; PCPG, pheochromocytoma & paraganglioma; PAAD, pancreatic ductal adenocarcinoma; MESO, mesothelioma; UVM, uveal melanoma; SARC, sarcoma; CHOL, cholangiocarcinoma; TGCT, testicular germ cell cancer; THYM, thymoma; STES, stomach and esophageal cancer; EBV, Epstein-Barr virus; HPV, human papillomavirus; DDLPS, dedifferentiated liposarcoma; LMS, leiomyosarcoma; MFS/UPS, myxofibrosarcoma/undifferentiated pleomorphic sarcoma; ESCC, esophageal squamous cell carcinoma; GS, genomically stable; CIN, chromosomal instability; MSI, microsatellite instability.
gastrointestinal and uterine tumors, which had the highest muta-tion burden, also had the highest overall frequencies of pathway alterations. This is possibly due to the frequent inactivating mutations introduced by the predominant mutation mechanisms
in these tumor types (Boland and Goel, 2010; Rayner
et al., 2016).
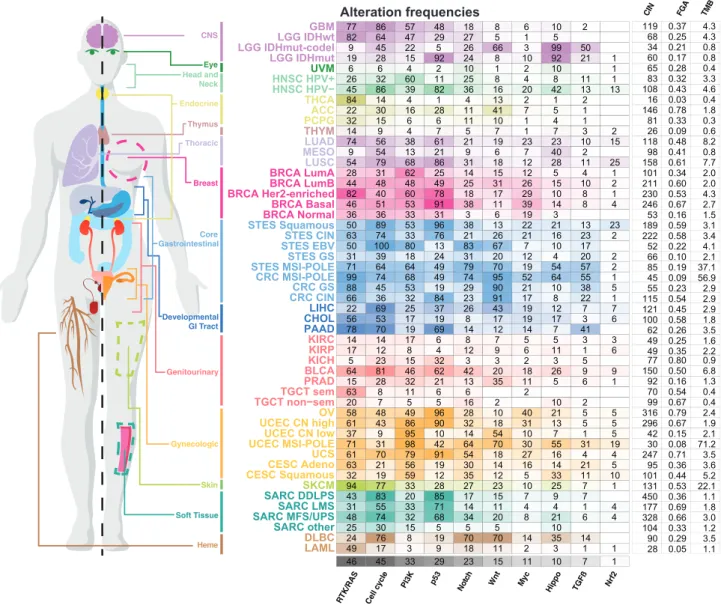
The RTK-RAS pathway was the signaling pathway with the highest median frequency of alterations (46% of samples)
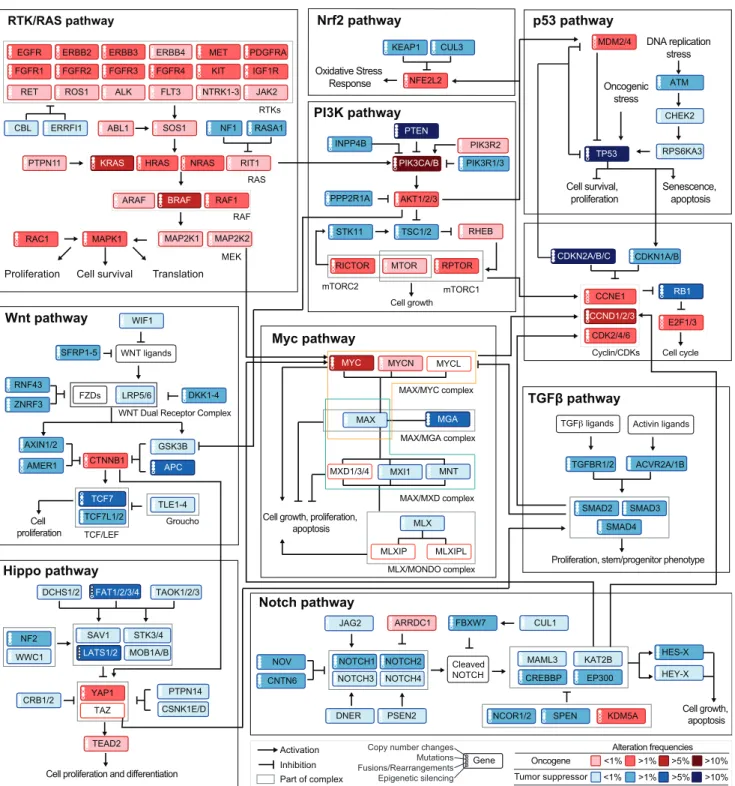
Figure 2. Curated Pathways
Pathway members and interactions in the ten selected pathways. Genes are altered at different frequencies (color intensity indicates the average frequency of alteration within the entire dataset) by oncogenic activations (red) and tumor suppressor inactivations (blue). The types of somatic alteration considered for each gene (copy-number alterations, mutations, fusions or epigenetic silencing) are specified using a set of four vertical dots on the left of each gene symbol. An expanded version including cross-pathways interactions is provided asFigure S1.
across all cancer types. The tumor subtypes with the highest fraction of alterations in this pathway were (in descending or-der): melanoma (SKCM, 94% altered), the genomically-stable subtype of colorectal cancer (CRC GS, 88%), Her2-enriched breast cancer (BRCA Her2-enriched, 82%), pancreatic cancer (PAAD, 78%), IDH1-wild-type glioma (LGG IDHwt, 82%), lung adenocarcinoma (LUAD, 74%), and thyroid carcinoma (THCA, 84%). Some tumor types, such as lung squamous cell carci-noma (LUSC), EBV-positive esophagogastric cancer (STES EBV), and non-hypermutated uterine cancer (UCEC CN high and CN low), had high rates of alterations in the PI3K pathway, altered in 68%, 80%, 86%, and 95% of samples, respectively. While cell-cycle alterations were common in many tumor types, the pathway was only rarely altered in uveal melanoma (UVM),
thymoma (THYM), testicular cancer (TGCT), and acute myeloid leukemia (AML). Alterations in the Wnt pathway were the most variable across cancer types. Colorectal cancer had near uni-versal activation of this pathway, while others, such as renal cell carcinomas and breast cancer, had very low frequencies of alteration in genes in this pathway. The oxidative stress response/Nrf2 pathway had the lowest overall frequency of alteration (1% of samples), and it was altered most frequently in lung squamous (25% altered) and esophagogastric squa-mous cell carcinoma (STES ESCC, 23%).
Particularly interesting gene alterations across tumor types were observed in the RTK-RAS pathway. KRAS was the most frequently altered gene (9% across all samples), followed by BRAF (7%) and EGFR (4%) (Figure 4A). KRAS alterations were CNS Head and Neck Endocrine Thoracic Breast Genitourinary Gynecologic Skin Soft Tissue Core Gastrointestinal Developmental GI Tract Heme Eye LAML DLBC SARC other SARC MFS/UPSSARC LMS SARC DDLPSSKCM
CESC SquamousCESC Adeno
UCS
UCEC MSI-POLEUCEC CN low
UCEC CN highOV TGCT non−semTGCT sem PRADBLCA KICHKIRP KIRC PAAD CHOL LIHC CRC CIN CRC GS CRC MSI-POLE STES MSI-POLESTES GS STES EBVSTES CIN STES SquamousBRCA Normal BRCA Basal BRCA Her2-enriched BRCA LumB BRCA LumA LUSC MESO LUAD THYM PCPGACC THCA HNSC HPV− HNSC HPV+ UVM LGG IDHmut LGG IDHmut-codelLGG IDHwt GBM Thymus RTK/RAS Cell c yc le
PI3K p53 Notch Wnt Myc
Hippo TGFß Nrf2 51 53 38 39 14 4 46 40 60 91 18 11 29 10 8 1 82 78 17 8 31 62 14 12 5 1 28 25 15 4 48 48 25 26 15 2 44 49 31 10 36 33 3 19 3 36 31 6 86 57 18 6 10 77 48 8 2 45 22 26 3 99 9 5 66 50 28 15 24 10 92 1 19 92 8 21 64 47 27 1 5 82 29 5 30 16 11 7 5 22 28 41 1 15 6 11 1 4 32 6 10 1 14 4 4 2 1 84 1 13 2 6 4 10 2 10 1 6 2 1 36 32 23 17 8 1 66 45 53 84 29 91 21 10 22 5 88 19 90 38 74 33 21 21 16 2 63 76 26 23 100 80 83 7 10 50 13 67 17 39 18 31 12 4 2 31 24 20 20 89 53 38 22 21 23 50 96 13 13 53 17 8 19 17 6 56 69 25 19 26 17 19 12 3 7 22 37 43 7 70 19 14 14 7 78 69 12 41 81 46 42 18 26 9 645 23 15 6232 3 203 2 3 95 14 17 8 5 5 3 14 6 7 3 12 8 12 6 11 6 17 4 9 1 28 32 13 11 5 1 15 21 35 6 7 5 16 10 20 8 11 5 6 2 2 2 63 6 21 56 30 16 14 5 63 19 14 21 19 59 35 5 33 10 32 12 12 11 48 49 28 40 21 5 58 96 10 5 43 86 32 31 13 5 61 90 18 5 9 95 14 10 7 5 37 10 54 1 70 79 54 27 16 4 61 91 18 4 76 8 70 14 35 24 19 70 14 17 3 18 2 3 1 49 9 11 1 86 39 36 20 42 13 45 32 60 82 25 16 4 8 13 1 26 11 8 11 74 68 74 52 64 1 99 64 64 49 79 95 19 54 55 2 71 49 70 57 31 98 64 30 55 19 71 42 70 31 77 33 27 10 25 1 94 28 23 7 83 20 17 7 9 43 85 15 7 55 33 14 4 4 4 31 71 11 1 74 32 34 8 21 4 48 68 20 6 30 15 5 10 25 5 5 56 38 21 23 23 15 74 61 19 10 79 68 31 12 28 25 549 54 13 8621 9 186 7 40 112 9 4 5 1 7 2 14 7 7 3 46 45 33 29 23 15 11 10 7 1 0.4 0.6 1.1 1.2 71.2 1.9 2.1 1.6 2.2 0.8 0.8 4.3 0.3 0.4 3.5 1.3 3.5 0.9 1.8 5.2 3.6 56.9 2.9 2.9 0.4 0.4 0.8 2.9 4.6 3.3 8.2 22.1 4.3 3.4 2.1 37.1 4.1 2.0 2.7 2.0 4.3 1.5 1.8 6.8 1.8 7.7 3.1 3.5 3.0 2.4 1.1 0.03 0.09 0.05 0.33 0.08 0.67 0.15 0.25 0.35 0.17 0.21 0.25 0.33 0.28 0.26 0.16 0.29 0.80 0.58 0.44 0.36 0.09 0.54 0.23 0.54 0.67 0.41 0.45 0.43 0.32 0.48 0.53 0.37 0.58 0.10 0.19 0.22 0.34 0.67 0.60 0.53 0.16 0.78 0.50 0.69 0.61 0.59 0.71 0.66 0.79 0.36 16 26 28 104 30 296 42 49 49 60 34 68 81 65 62 92 90 77 100 10195 45 11555 70 99 98 121 10883 118 131 119 222 66 85 52 101 246 211 230 53 146 150 177 158 189 247 328 316 450
Alteration frequencies CIN FGA TMB
Figure 3. Pathway Alteration Frequencies
Fraction of altered samples per pathway and tumor subtype. Pathways are ordered by decreasing median frequency of alterations. Increasing color intensities reflect higher percentages. Average mutation count, as well as number of unbalanced segments and fraction genome altered (two measures of the degree of copy-number alterations) per cancer subtype are also provided. The MSI and POLE subtypes were grouped in this figure in colorectal, stomach and endometrial cancers.
A B MEK RTKs ERBB2 EGFR 4% 5% ERBB3 2% ERBB4 <1% PDGFRA IGF1R 1% 2% ROS1 <1% ALK <1% FGFR1 MET 1% 4% FGFR2 1% FGFR3 2% KIT FGFR4 1% 2% NTRK1 <1% NTRK2 <1% FLT3 <1% RET <1% CBL 1% ERRFI1 1% SOS1 <1% PTPN11 <1% KRAS 9% RAC1 2% ARAF <1% RAF1 1% BRAF 7% NRAS 2% HRAS 1% NF1 5% RASA1 2% MAP2K1 <1% MAPK1 1% MAP2K2 <1% RAS RAF Translation Proliferation Cell survival
Inactivating Activating Activation Inhibition Oncogene Tumor suppressor 0 500 1000 1333 aa 0 10 # Mutations Alteration frequency N233S/Y M269I/V G434R R552K/S/G/M E846K UCEC LUAD LUSC BLCA LIHC LGG SKCM LAML C LAML DLBC SARC other SARC MFS/UPS SARC LMS SARC DDLPS SKCM CESC Squamous CESC Adeno UCS UCEC POLE UCEC MSI UCEC CN low UCEC CN high OV TGCT non-sem TGCT sem PRAD BLCA KICH KIRP KIRC PAAD CHOL LIHC CRC CIN CRC GS CRC POLE CRC MSI STES POLE STES MSI STES GS STES EBV STES CIN STES Squamous BRCA Normal BRCA Basal BRCA Her2-enriched BRCA LumB BRCA LumA LUSC MESO LUAD THYM PCPG ACC THCA HNSC HPV- HNSC HPV+ UVM LGG IDH mut LGG IDH mut-codel LGG IDHwt GBM CNS Head & Neck
EndocrineThoracic Breast Gastrointestinal
Genitourinary
Gynecologic Skin Soft Heme
Tissue Eye Developmental GI Tract Thymus SOS1 mutations Alteration frequencies Oncogene Tumor Suppressor 5% Amp Del Mut Fusion Total MAP2K2 MAPK1 MAP2K1 RAF1 BRAF ARAF NRAS HRAS KRAS RAC1 RASA1 NF1 ERRFI1 PTPN11 CBL SOS1 JAK2 FLT3 ROS1 ALK RET ABL1 NTRK3 NTRK2 NTRK1 PDGFRA KIT MET FGFR4 FGFR3 FGFR2 FGFR1 ERBB4 ERBB3 ERBB2 IGF1R EGFR 5052 1 13 11 13 7 1 4 6 1493 2 1 3 12 3 1 1 5 2 2 1 3 1 2 4 5 13 13 8 72 1 14326 22 5 5 236 2 1 1 3 3 13 4 13 1 7 1 317 7 11 1 3 1 6 1 4 2 3 6 3 1 1 3 1 2 1 3 93 7 1 7 1 2 2 1 2 1 1 178 1 4 1 1 2 5 1 1 1 3 1 1 1 2 4 2 2 8 2 2 1 4 4 3 21 1 2 3 2 1 2 1 8 2 1 3 1 1 22 4 1 8 20 10 10 5 8 9 2 6 1 2 1 8 1 1 3 17 4 1 4 1 3 2 54 7 17 2 9 1 3 3 1 2 4 1 1 1 1 1 3 6 1 3 5 11 4 4 1 1 3 1 3 17 2 2 7 1 1 1 3 10 2 1 6 9 14 12 1 1 5 1 1 13 1 8 1 1 1 1 2 2 1 1 2 1 2 4 1 2 17 1 1 3 2 1 2 1 2 114 1 4 1 1 2 6 4 1 1 131 2 1 1 6 2 4 5 3 3 5 16 3 2 6 1 2 2 1 1 1 1 1 22 4 11 1 3 5 2 1 1 2 2 9 5 4 5 1 1 1 35 614 43 7 3 2 4 1 3324 8 2 72 12610159 17 32 18 3 7 1 2 1 1 7 1 11 1 1 1 2 2 1 2 2 4 1 1 1 4 23 2 162 1 8 2 1 3 3 1 2 3 5 2 2 512 5 11 3 2 4 3 3 1 1 1 1 1 5 3 1 1 1 22 2 4 4 31 6 3 1 4 14 4 1 4 1 3 1 13 1 3 2 4 97 1 4 5 1 2 1 1 2 3 5 3 1 2 1 13 1 3 2 1 2 2 2 4 5 2 5 2 4 4 1 2 2 2 5 4 6 1 1 11 10 10 1 1 5 5 2 1 7 4 4 7 3 6 6 2 2 5 2 3 11 22 2 1 1 10 7 9 4 15 2 2 3 14 7 10 4 7 6 9 4 1 4 6 3 5 2 1 4 2 6 2 13 2 1 6 2 2 1 1 2 1 1 3 1 1 1 1 1 1 5 2 1 1 2 5 2 2 1 5 3 1 2 3 1 3 1 6 5 3 3 3 1 2 1 1 2 4 3 1 1 2 1 3 1 1 2 1 4 1 6 1 1 7 56 9 3 1 1 3 2 20 1 1 1 8 6 11 2 1 6 3 10 1 1 2 1 3 3 215 11 10 8 4 5 3 1 1 2 1 3 3 2 2 2 2 10 4 1 42 1 5 17 3 9 2 11 1 1 1 24 1 6 4 1 2 2 1 3 7 2 2 1 1 20 5 1 1 3202 2 21 6 302069 1 2 54 1 1 1 10 23 11 20 1 1 330 1 3 2 1 1 1 1 3 1 5 1 3 2 4 1 1 2 2 8 302 1 3 4 2 2 2 1 55 11 10 1 3 7 10 2 8 1 1 8 2 1 3 10 1 8 1 12 5 30 1 1 1 2 2 2 2 10 1 2 4 1 3 1 2 6 1 5 4 2 1 20 2 2 3 30 1 1 2 3 1 7412 3 4 8 1 1 2 1 1 1 13 3 2 1 2 1 1 1 1 1 1 1 1 1 1 1 1 5 1 1 1 3 1 1 1 1 4 1 1 2 3 3 1 1 1 1 1 11 2 1 1 1 1 7 1 1 22 28 44824636 981008866 56 64 63 33 24 77829 196264584 321474954 5063 50 31 76 44 22 7814 175 1663205861 37 66 88 61 9543 31 48 25 49 Methylation Multiple ABL1 <1% NTRK3 <1% JAK2 1% A90V/T RIT1 <1%
most common in pancreatic carcinoma (PAAD, 72%), genomi-cally stable colorectal cancer (69%), and lung adenocarcinoma
(33%) (Figure 4B). BRAF alterations (predominantly known
hotspot mutations) were found in melanoma and thyroid carci-noma, altered in 51% and 62% of samples, respectively. EGFR alterations were predominantly found in glioblastoma (GBM, 50%), low grade glioma IDHwt (52%), HPV-negative head and neck cancer (HNSC HPV-, 13%), lung adenocarcinoma (13%), and esophagogastric squamous carcinoma (14%), while ERBB2 alterations were found most commonly in breast cancer and chromosomally unstable esophagogastric carcinoma (STES CIN 26% altered), as well as cervical carcinoma (CESC 23% altered). While most of the alterations described here were previously reported as functional contributors, we identified rela-tively rare potentially oncogenic alterations in SOS1 (<1%). SOS1 encodes a guanine-nucleotide-exchange factor (GEF) involved in the activation of Ras proteins. Specific germline
mutations in this gene are involved in Noonan syndrome (Lepri
et al., 2011), and recurrent somatic mutations in SOS1 were recently identified in otherwise RAS-pathway driver-negative
lung adenocarcinoma samples (Campbell et al., 2016). We
iden-tified recurrent (hotspot) mutations (A90V/T, N233Y/S) and other known activating mutations (M269I/V, G434R, R552S/K/G/M, E846K) in SOS1 in a total of 1% of lung adenocarcinoma sam-ples, 1% of uterine carcinomas, independent of subtype, and
at lower frequencies in several other cancer types (Figure 4C).
This finding suggests that rarely altered novel cancer genes can be identified as more tumor samples are profiled. A more detailed analysis of RAS pathway alterations is published sepa-rately, including a description of downstream transcriptional changes due to malfunctioning Ras signaling and results sug-gesting that multiple hits in the Ras pathway are capable of
increasing overall Ras activity in RAS wild-type tumors (Way
et al., 2018).
The alteration frequencies of the most commonly altered
genes in the other nine pathways are inFigure 5(full heatmaps
providing frequencies of alteration for every gene in each
pathway are inFigures S2andS3). In some pathways, the
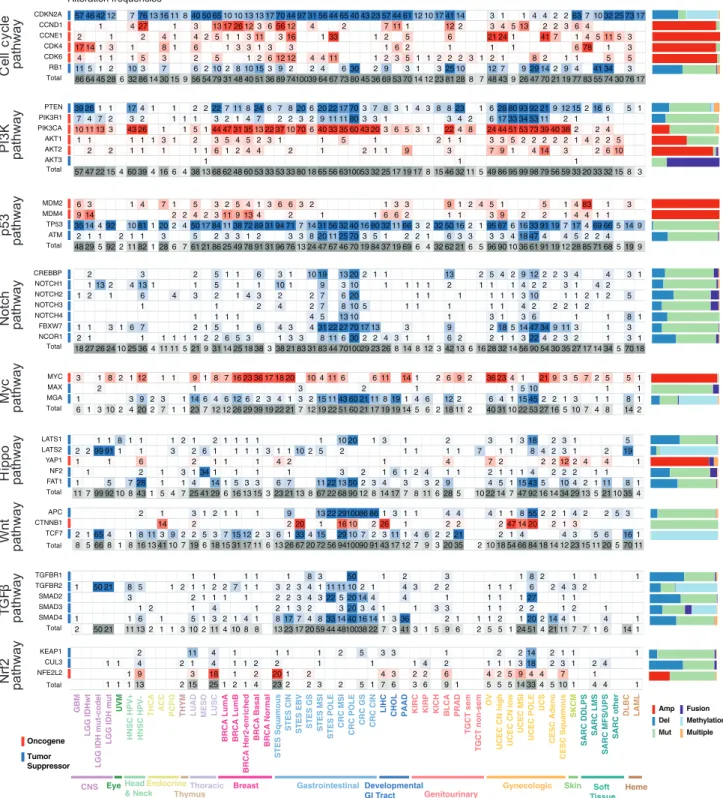
alter-ations are distributed over many genes (e.g., cell cycle, PI3K), while in others the alterations mainly affect only a few genes (Wnt, Myc, Nrf2). Several pathways are featured in more detail
as separate publications, including: (1) PI3K pathway (Zhang
et al., 2017): aberrations in the PI3K pathway were found pre-dominantly as activating events in PIK3CA (less commonly in PIK3CB) and inactivating events in PTEN or PIK3R1 with PIK3CA and PTEN alterations being most commonly found in head and
neck cancer, breast cancer, gastrointestinal and gynecological
tumors; (2) TGFb pathway (personal communication): The
TGFb pathway had the highest alteration rate in pancreatic and
gastrointestinal cancers, while renal and brain cancers, among others, had almost no alterations in this pathway; and (3) Myc
pathway (Schaub et al., 2018): Myc pathway alterations were
most common in tumor types with amplification of chromosome 8, which contains MYC, such as breast cancer, ovarian cancer (OV), and others.
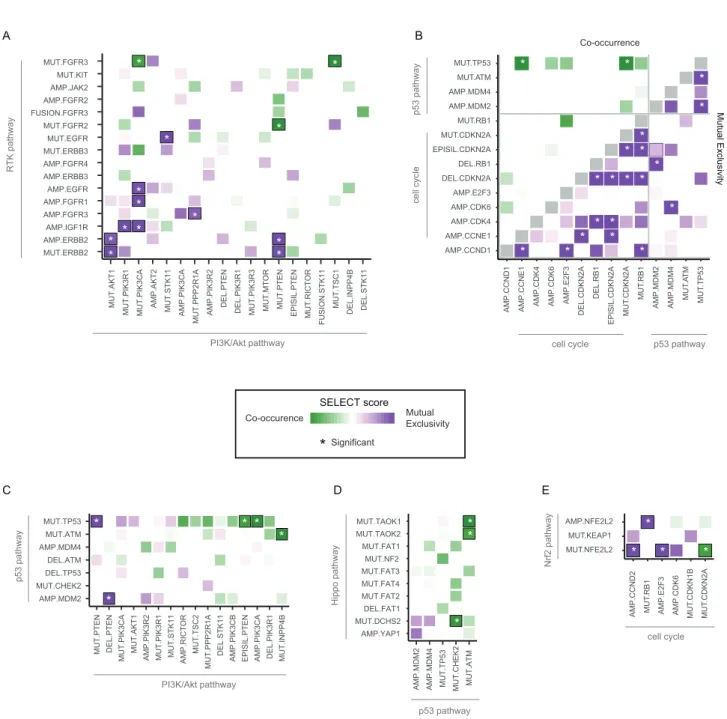
Mutual Exclusivity and Co-occurrence among Pathway Alterations
Individual tumors typically have multiple functional alterations affecting more than a single pathway. Some pathways may be the target of more than one alteration per patient or distinct pathways may be co-altered in one tumor. Patterns of mutual exclusivity between alterations across large patient cohorts have been associated either with functional redundancy, indi-cating that once one occurred and is selected the second will not provide a further selective advantage, or with synthetic lethality, indicating that cells cannot survive with both alterations (Etemadmoghadam et al., 2013; Mina et al., 2017). Patterns of co-occurrence of alterations in many tumor samples, on the other hand, indicate functional synergies and, importantly, may
reflect resistance to therapy targeting one of the alterations (
Nis-san et al., 2014)
To explore significantly co-occurring and mutually exclusive alterations by pathway or by gene, we used the SELECT method (Mina et al., 2017). Among the 410 alterations characterized, we identified 156 pairs of mutually exclusive alterations and 117
pairs of co-occurring alterations (Table S5).
Upon mapping these significant pairs to the affected path-ways, we found numerous mutually exclusive pairs within the p53, cell-cycle, RAS, and PI3K pathways, suggesting that one alteration is sufficient to functionally alter each of these pathways
or that more than one might be disadvantageous (Figure 6A). On
the other hand, the Hippo, RTK, and, to a lesser extent, Wnt pathways often had multiple alterations per tumor sample, sug-gesting co-occurring events that mediate synergistic activation
of each pathway (Figure 6A). The SELECT method also identified
several significant interdependencies between distinct
path-ways (Figure S4). For example, activation of RTKs was
signifi-cantly mutually exclusive with alterations that promote either RAS or PI3K signaling, consistent with RTKs being able to acti-vate either pathway without the need for additional alterations. Notable exceptions were significant co-occurrent alterations in
Figure 4. RTK-RAS Pathway Alterations
(A) Altered genes and their functional relationships in the RTK-RAS pathway. Shades of red indicate frequencies of activating events (known or likely activating mutations or fusions, amplifications) and shades of blue indicate frequencies of inactivating events (known or likely inactivating mutations or fusions, homozygous losses).
(B) Detailed heatmap of alteration frequencies in members of the RTK-RAS pathway. Only known or likely oncogenic alterations in each gene are considered, as described inSTAR Methods. The individual gene alteration frequencies may add up to more than the total for each tumor type, as some tumor samples may have multiple alterations. Color side bars show the fraction of samples affected by each type of somatic alteration (or a combination of them) for each pathway gene. Top color bars show the proportion of different types of alterations for each cancer subtype.
(C) Recurrent or known functional mutations in SOS1. Recurrent or known mutations are color-coded by tumor type, all other mutations observed in the gene are considered variants of unknown significance (gray). Three singleton mutations involved in a 3D hotspot are not shown for space reasons: D89A in a UCS sample, A93D in CRC, and S92P in UCEC.
C ell c ycle PI3K p53 Notch Myc Hi pp o Wnt TG Fβ Nrf2 pathway pathway pathway pathway pathway pathway pathway pathway pathway LAML DLBC SARC other SARC MFS/UPS SARC LMS SARC DDLPS SKCM CESC Squamous CESC Adeno UCS UCEC POLE UCEC MSI UCEC CN low UCEC CN high OV TGCT non-sem TGCT sem PRAD BLCA KICH KIRP KIRC PAAD CHOL LIHC CRC CIN CRC GS CRC POLE CRC MSI STES POLE STES MSI STES GS STES EBV STES CIN STES Squamous BRCA Normal BRCA Basal BRCA Her2-enriched BRCA LumB BRCA LumA LUSC MESO LUAD THYM PCPG ACC THCA HNSC HPV- HNSC HPV+ UVM LGG IDH mut LGG IDH mut-codel LGG IDHwt GBM CNS Head & Neck
EndocrineThoracic Breast Gastrointestinal
Genitourinary
Gynecologic Skin Soft Heme Tissue Eye Developmental GI Tract Thymus Oncogene Tumor Suppressor Alteration frequencies 12 17 2612 3 656 12 11 2 3 27 4 1 1 3 13 4 7 1 2 3 4 513 6 4 4 1 1 311 316 33 1 6 7 3 2 1 2 1 4 2 5 1 2 5 21241 41 1 4 5 11 5 8 1 3 3 1 3 6 1 3 17141 3 1 1 6 3 1 2 1 1 678 1 3 1 2 61212 11 1 3 2 1 5 4 1 1 1 5 2 5 4 4 2 5 1 1 2 3 1 2 1 8 2 1 5 4 1 1 4 2 212 1 1 6 2 1 1 7 2 2 2 4 4 1 1 7162336171820 6 6 6 9 3 5 3 1 8 2 112 1 9 1 8 10411 11 141 2 9 2 36234 1 21 5 7 2 5 1 6 2 1 201 7 9 3 18 2 4 2 2 4 2 4 1 3 5 4 5 2 3 1 1 1 2 1 1 1 1 2 3 2 1 3 3 2 4 2 2 5 1 1 2 4 4 2 2 1 3 3 1 1 2 2 1 1 6 1 1 9 7 9 1 14 2 6 10 22 47313513223710 4038 1011 3 4326 1 5 44 70640 33 3 5 3 1 4 8 2444 51 39 2 2 4 7 2 5 4 1 3 6 6 3 9 1 3 6 3 1 4 1 5 3 3 2 1 3 1 2 4 5 1 5 483 1 1 119 134 2 1 6 1 9 14 2 2 4 2 3 1 6 2 1 3 9 2 2 4 4 1 1 16 10 10 13 13 17 70 44 44 43 23 44 41 2 73 57 46 42 12 7 76 8 40 50 65 31 56 57 61 12 10 17 14 3 4 63 7 10 32 25 17 7 2 8 10 153 9 2 25 2 9 3 11 5 2 10 3 6 2 10 2 9 3 1 10 127 14 4 41 34 2 1 1 1 1 2 3 5 1 1 1 8 1 21 2 3 1 3 1 1 1 1 3 1 2 3 1 1 91 2 6 1 1 2 1 1 4 1 2 1 2 2 2 2 4 1 31 341 1 1 1 2 2 1 1 1 5 3 3 6 7 13 50 3 9 10 8 28 7 3 5 1 4 14 11 22 4 3 4 5 15 5 4 1 11 3 2 3 4 21 11 12 2 1 8 1 3 14 6 4 1 43 8 1 4 6 2 64 15 2 3 13 6 3 2 5 1 10 1 2 5 4 4 2 1 1 3 13 1 1 2 1 1 5 1 1 4 2 4 2 6 1 6 1 4 3 2 2 1 10 2 2 2 2 5 1 1 1 1 13 8 1 1 4 5 9 6 1 4 22 70 13 11 3 7 6 3 2 1 5 3 3 218 3 1 1 1 1 1 2 2 6 5 1 3 2 2 4 1 6 2 2 1 1 4 2 3 2 3 1 1 1 5 3 2 1 11 4 2 2 2 1 2 2 3 4 1 4 1 1 2 1 4 1 3 2 4 3 7 2 2 3 3 7 2 1 3 2 9 1 4 2 617 8 6 24 11 7 8 7 8 3 7 9 12 5 39 26 17 4 1 1 2 2 22 20 6 20 22 8 1 4 3 8 23 1 6 28 80 93 21 15 16 6 1 3 1 1 1 1 1 1 1 8 2 2 1 1 2 2 1 2 11 1 4 5 8 3 21 2 1 2 4 1 3 1 1 2 2 22 14 4 1 2 1 1 3 3 4 1 1 27 3 4 2 1 1 4 1 2 1 1 1 2 1 8 17 33 16 14 3 2 14 4 6 1 5 1 3 7 4 8 1 36 1 1 1 2 4 20 11 38 72 89 94 71 32 16 80 50 19 7 14 81 2 9 92 14 1 2 4 50 84 32 16 87 6 17 69 66 6 3 3 2 3 25 5 4 1 1 5 2 3 8 1 3 3 3 3 4 4 5 4 2 4 1 1 1 29 8686 3 2 3 1 2 9 13 1 1 4 4 1 4 2 5 2 5 1 1 1 5 2 2 1 4 1 1 2 3 100 1 2 22 1 8 552 3 1 703 2 1 1 20 11 1 2 2 18 47 2 2 2 2 2 13 1 1 4 1 1 3 19 13 20 2 1 2 3 3 1 2 2 9 122 4 14 2 220 1 16 10 226 1 2 2 247 1420 2 1 3 1 1 1 1 1 18 1 1 2 2 1 43 1 9 27 17 31 1 1 1 4 5 14 47 34 1 3 2 1 2 1 214 1 1 1 10 1 1 20 1 3 18 1 2 5 1 1 8 2 1 1 2 1 3 1 5 10 6 6 60 19 9 1 3 2 15 11 1 45 1 3 6 30 2 1 1 3 8 11 1 322 1 1 3 6 1 1 4 2 1 3 1 5 9 4 10 3 10 4 13 1 1 9 1 1 4 2 2 1 3 5 1 2 7 20 1 1 1 1 3 1 1 1 2 4 7 8 10 1 1 1 4 2 1 1 10 3 1 3 6 1 1 1 1 35604320 6 13 1 53 73 1 4 11 80 2 3 2 4 7 1 3 2 11 33 34 53 11 1 1 3 17 70 1 1 92 2 6 30 4 3 1 2 9 29 1 5 20 3 4 1 1 1 20 3 3 3 2 3 2 2 1 4 14 40 1 202 1 1 7 29 8 15 6 4 50 3 1 8 2 2 11 10 3 1 3 4 1 6 31 14 56 40 11 35 4 10 17 7 31 66 3 32 2 95 16 33 91 4 5 2 19 99 2 1 3 10 7 1 7 1 50 1 2 1 1 3 7 15 12 2 3 6 2 11 2 4 16 2 1 65 4 1 11 9 22 5 3 1 33 4 10 3 1 4 2 21 2 1 3 5 6 1 2 12 2 1 1 1 2 1 1 1 3 1 1 1 1 1 1 1 1 2 2 1 1 1 1 1 1 2 1 2 65 40 11 97 30 31 48405136 73 804536 53 81 21 19 76 866445 286328614 159565479 897410039 64 67 69 7014 1223 288 74843 9 26 47 70 7783 55 74 30 17 5 6 1613153 68 90128 17 28 14 34 35 11799 92108431 4 7254129 2321 13 8 67 22 14 7 8 116 5 102214 7 47 92 16 2913 5 21 10 4 7 12 26293919 51 602117 19 18 16 5 14 6 1 3 102 4202 1 123712 2221 7 12 19 22 19 145 6 2 112 4031 10 22 53 27 107 4 8 2 11 14 2518383 701002923 8 42 30 35 70 182726 241025364 11521931 3821 83 31 83 44 26 148 123 136162832 14 56 90 54 2717 14 34 5 18 9 4 1 1 2 2 5 1 6 5 10 13 1 3 6 1 1 1 215 25 232 2 3 7 1 5 5 5 14 33 4 1 4 4 16 62 48605333 631005332 17 46 56 59 8 574722 15460394 6 4381368 5333 80 18 65 56 25 1917 815 321154986 95 99 98 79 3320 33 32 15 3 28 25 49789131 46 701984 19 62 19 12 19 48295 92211821 6 7612186 9676 13 24 47 67 37 696 432 216 59690 10 36 61 91 2885 71 68 5 9 1 4 108 8 481003822 3 9 21 11 14 2 50 21 11132 1 310211 1323 17 20 59 44 7 413 1 5 6 2 5 5 1 24 51 4 7 7 1 6 1 41 15 3117116 941009091 17 20 14 12 70 8 566 8 1 81613 10719618 1326 67 20 72 56 43 127 9 3 35 21018 54 66 84 18 2315 11 20 5 11 Total NFE2L2 CUL3 KEAP1 Total SMAD4 SMAD3 SMAD2 TGFBR2 TGFBR1 Total TCF7 CTNNB1 APC Total FAT1 NF2 YAP1 LATS2 LATS1 Total MGA MAX MYC Total NCOR1 FBXW7 NOTCH4 NOTCH3 NOTCH2 NOTCH1 CREBBP Total ATM TP53 MDM4 MDM2 Total AKT3 AKT2 AKT1 PIK3CA PIK3R1 PTEN Total RB1 CDK6 CDK4 CCNE1 CCND1 CDKN2A Amp Del Mut Fusion Methylation Multiple
Figure 5. The Most Commonly Altered Genes in Nine Signaling Pathways
Oncogenic alteration frequencies per gene and tumor subtype for the most frequently altered genes in each pathway (for RTK-RAS seeFigure 4). Red: activating events; blue: inactivating events; frequency of occurrence scale with color intensity. Last row for each pathway: overall alteration frequency of that pathway per tumor type. The individual gene alteration frequencies may add up to more than the total for each tumor type, as some tumor samples have multiple alterations. Color side bars show the fraction of samples affected by each type of somatic alteration (or a combination of them) for each pathway gene. Comprehensive heatmaps with alterations for every gene in each pathway are inFigure S2andFigure S3.
A B C
D
F
E
G H
the FGF receptors FGFR2 and FGFR3 and alterations in the PI3K
pathway (Figure S4A). The p53 and cell-cycle pathways were
frequently co-altered. Indeed, numerous alterations affecting Rb-mediated cell-cycle control were found co-occurring with TP53 mutations. These included amplification of CCNE1, muta-tion of CDKN2A, RB1 loss, and amplificamuta-tion of CDK6 and E2F3 (Figure S4B). Interestingly, TP53 mutations were found mutually exclusive with CDKN2A deletion, consistent with the latter invari-ably affecting both p16, regulating the cell cycle, and ARF, pro-moting p53-dependent apoptosis. Similarly, MDM2 amplifica-tion was significantly mutually exclusive with RB1 and CDKN2A loss. However, MDM2 is proximal to CDK4 in the genome and the two genes were almost always co-amplified. Overall, these results indicate that p53 signaling and cell-cycle control are frequently co-altered across multiple tumor types, either through two independent events (e.g., mutations of TP53 and RB1), or through a single alteration that is able to affect both pathways (e.g., CDKN2A deletion).
The strongest co-occurrence among pathways was found between alterations of the PI3K and Nrf2 pathways. Here, gain of function mutations and amplifications of the NFE2L2 gene (en-coding for NRF2) significantly co-occurred with PIK3CA amplifi-cation and tended to co-occur with PIK3CA mutations and PIK3CB amplification (Figure 6C). Interestingly, even though NFE2L2 amplification was largely mutually exclusive with loss of STK11 (a.k.a. LKB1), the latter significantly co-occurred with loss of function mutations of KEAP1, a negative regulator of NFE2L2. Co-occurring Nrf2-PI3K pathway alterations were most frequent in lung tumors (both squamous cell and adenocar-cinoma), esophageal carcinomas, head and neck squamous cell
carcinoma and uterine carcinoma, independent of subtype (
Fig-ure 6D). In these tumor types, alterations in NFE2L2 and KEAP1 were recurrent and almost perfectly mutually exclusive, and they frequently co-occurred with PIK3CA activation or STK11 loss (Figure 6E). PI3K pathway activation promotes NRF2 accumula-tion, which, in turn, mediates metabolic pathways required to sustain cell proliferation and protection from reactive oxidative
species (Mitsuishi et al., 2012). NRF2 is however kept in check
by inhibitory molecules such as KEAP1 and CUL3 (Figure 6F).
The observed co-occurrence between alterations of the PI3K and Nrf2 pathways suggests that bypassing these inhibitory mechanisms (either by loss of KEAP1 or CUL3, or by direct over-activation of NFE2L2) is synergistic with active PI3K
signaling. Importantly, tumors with these events might depend on NRF2 activity to tolerate PI3K pathway over-activation.
The RTK-RAS pathway contained numerous and some of the most significantly mutually exclusively altered genes, as well as several gene pairs that were significantly concurrently altered (Figure 6G). In particular, alterations promoting EGFR activation (gain of function mutations, fusion, and amplification) were involved in the highest number of significant pairs. EGFR ampli-fication was significantly mutually exclusive with activation of its
paralog growth factor receptor Her2 (ERBB2,Figure 6H, Box 1)
and with key drivers of the RAS pathway, including oncogenic mutations in BRAF and KRAS as well as loss of NF1 and RASA1 (Figure 6G). Since oncogenic EGFR can be synthetically lethal with mutated KRAS and can mediate resistance to BRAF
inhibition in colon cancer and melanoma (Sun et al., 2014; Unni
et al., 2015), these results suggest a similar antagonistic interac-tion with loss of NF1 or RASA1. Overall, alterainterac-tions of either of these genes were recurrent across multiple tumor types,
although almost never in the same patient (Figure 6H, Box 2).
On the other hand, in glioblastoma and IDH wild-type low grade glioma, EGFR amplifications were highly co-occurrent with
either EGFR mutations or gene fusions (Figure 6H, Box 3) or
with focal amplifications of chromosome 4q12, where both KIT
and PDGFRA are located (Figure 6H, Box 4). It should be noted
that the majority of EGFR and PDGFRA fusions were found coincident with amplifications in these genes, indicating that, potentially, in these cases the same structural variant was
detected as both a copy number gain and a fusion (
Alaei-Maha-badi et al., 2016). Interestingly, co-amplification of EGFR and PDGFRA has been proposed to be an early event in glioblastoma development, where the two receptors heterodimerize under
EGF stimulation and respond to EGFR-inhibitors (Chakravarty
et al., 2017b).
Overall, these results provide a map of the cross-talk between pathways and pathway components, reflecting functional inter-actions and dependencies that could be therapeutically exploited.
Therapeutic Actionability
DNA sequencing has been used routinely to inform the choice of targeted therapy in specific cancer types for several years, and some institutions now apply it more broadly to guide clinical trial enrollment for many additional cancer types. A relatively small
Figure 6. Co-occurrence and Mutual Exclusivity of Pathway Alterations
(A and B) Mutual exclusivity (purple) and co-occurrence (green) of gene alterations within pathways (A) and between pathways (B). Asterisks indicate significant relationships (Q value < 0.1).
(C) Co-occurrence and mutual exclusivity of individual gene alterations in the PI3K and Nrf2 pathways.
(D) Breakdown of the co-occurrence of gene alterations in the PI3K and Nrf2 pathways by tumor subtype. Green bars: percentage of samples with alterations in both PI3K and Nrf2 pathways. Pathways are sorted by decreasing percentage of samples with alterations in both pathways.
(E) Details of gene alterations in select genes (PIK3CA, STK11, NFE2L2, and KEAP1) within and between PI3K and Nrf2 pathways, with co-occurrence and mutual exclusivity between alterations. Samples are shown from left to right, and the number of samples in each group (bottom; note: the changing scale, indicated by solid and dashed lines).
(F) Pathway representation of the link between the PI3K and Nrf2 pathways.
(G) Dependencies between single alterations in the RTK and RAS/ERK pathways. Only the 22 alterations with at least one significant interaction (average sum correction, ASC score > 0.24;Mina et al., 2017) included.
(H) Breakdown of the interactions involving EGFR amplifications and mutations, corresponding to the bounding boxes in panel G. Left side: mutually exclusive interactions. Right side: co-occurring interactions.
A
B
C
D
number of alterations in a subset of tumor types are currently biomarkers for standard care targeted therapies, and a larger number are potential biomarkers for investigational therapies, some with promising clinical results. Using the OncoKB
knowl-edge base of clinically actionable alterations (Chakravarty
et al., 2017a), we systematically assessed all alterations in each sample of each cancer type, distinguishing between stan-dard care actionability (Levels 1 or 2) and investigational thera-pies (Levels 3 and 4). Overall, 51% of tumors had at least one potentially actionable alteration in the ten signaling pathways, and 57% had at least one actionable alteration when including genes outside of these pathways, most notably BRCA1/2 and IDH1/2 (all numbers referenced below include these additional genes). Apart from the Her2-enriched breast cancer samples, most of which have a standard care targeted therapy, melanoma was the tumor type with the highest fraction of tumors with a
Level 1 or 2A alteration (46%) (Figure 7A), mainly due to frequent
BRAF mutations (Figure 7B), followed by esophagogastric cancers (ERBB2 amplifications). Luminal A breast cancer was the tumor type with the highest frequency of biomarkers with promising investigational data (Level 3A), driven by the high prevalence of PIK3CA, AKT1 and ERBB2 mutations. Several tu-mor types had frequent mutations that are biomarkers for drug sensitivity in other cancer types (Level 3B), including endometrial cancer, where PIK3CA mutations are common. Uveal melanoma and testicular non-seminoma had the lowest percentage of potentially targetable samples (2.5% and 8.5%, respectively); thymoma, mesothelioma (MESO), and renal clear cell carcinoma (KIRC) also had low frequencies of potentially actionable alterations.
Thirty percent of tumor samples had two or more potentially
targetable alterations (Figure 7C). Among these, the MSI-H and
POLE-mutated tumor subtypes had the highest proportion of samples with multiple potentially actionable alterations (not considering the fact that patients with MSI-H tumors are now eligible for immunotherapy). Other tumor types with a high fre-quency of samples with multiple targetable alterations included non-hypermutated endometrial cancer (64%), colorectal cancer (37%), and breast cancer (28%).
Finally, we searched for candidate drug combinations that could prove effective across different tumor types based on the occurrence of actionable alterations. Hypermutant MSI and POLE subtypes had a high fraction of samples of actionable al-terations corresponding to various drug combinations. In other tumor subtypes, a combination of CDK4 and MDM2 inhibitors was the most commonly indicated combination (1% total), in particular in dedifferentiated liposarcomas (SARC DDLPS), in
which 78% of the cases had co-amplification of the two targets (Figure 7D). By a similar consideration linking actionable alter-ations of targets to their inhibitors, a combination of HER2 and PI3K inhibitors might be beneficial across multiple tumor types, in particular Her2-enriched breast cancer (17%), uterine carcino-sarcoma (UCS, 7%), chromosomally unstable endometrioid car-cinoma (UCEC CN high, 7%), and cervical adenocarcar-cinoma (7%) (Figure 7D). Additional candidate combination therapies include PI3K and MEK inhibitors in EBV+ stomach tumors (10%), CDK4 and PI3K inhibitors in glioblastoma multiforme (7%), HER2 and MEK inhibitors in pancreatic cancer (7%), PI3K and RAF inhibi-tors in melanoma (SKCM, 12%), and IDH and PI3K inhibiinhibi-tors in
IDH-mutant low grade glioma (14%) (Figure 7D). While there
are many steps from the observation of combinations of genetic alterations to valid combination therapies, this survey indicates the wide landscape of potential tumor-type specific novel thera-peutic combinations that can be explored in experimental and clinical contexts.
DISCUSSION
Signaling pathways are somatically altered in cancer at varying frequencies and in varying combinations across different organs and tissues, indicative of complex interplay and pathway cross-talk. Understanding the extent, detailed mechanisms, and co-occurrence of the oncogenic alterations in these pathways is critical for the development of new therapeutic approaches that can improve patient care.
Here we performed a comprehensive characterization of 10 selected signaling pathways across the 33 cancer types analyzed by TCGA. This report constitutes the first pan-cancer exploration that uses a uniformly processed dataset and a stan-dardized set of pathway templates, curated through a
combina-tion of computacombina-tional methods and expert review (Figures 1
and 2). The results highlight similarities and differences in
fre-quencies of alteration of individual pathways in different cancer
types and specific molecular subtypes (Figure 3). They also
underscore the potential for discovering previously uncharacter-ized alterations in pathway genes that occur at low frequencies and might otherwise remain statistically unnoticeable (see SOS1,Figure 4). More generally, even though a small set of crit-ical genes contains a very large fraction of alterations in these
pathways (Figures 4and5), there is a complex interplay of
co-occurring and mutually exclusive alterations within and across
pathways (Figure 6). In spite of the accumulating wealth of
bio-logical knowledge and the accepted oncogenic relevance of these pathways, the number of currently approved biomarkers
Figure 7. Therapeutic Actionability and Drug Combinations
(A) Frequencies of clinical actionability by cancer subtype, broken down by level of evidence (Levels 1–4). Samples are classified by the alteration that carries the highest level of evidence. Tumor type–specific samples are analyzed by variants considered actionable, oncogenic but not actionable, or variants of unknown significance (VUS).
(B) Frequencies of actionable alterations per gene across cancer subtypes. For genes with different levels for different alterations, multiple rows are shown. Genes are grouped by pathway. Six additional genes not in the ten pathways (BRCA1, BRCA2, ERCC2, IDH1, IDH2, ESR1) are included and taken into account in the overall frequencies.
(C) Fraction of samples with a given number of actionable alterations per tumor type.
(D) Frequencies of possible drug combinations indicated by the co-alteration of actionable variants in each tumor type for the most frequent drug class combinations.
linked to standard of care therapies remains sparse (Figure 7), but additional drug targets in these pathways will hopefully emerge, and candidates for combination therapy will be explored.
This analysis of targetable alterations only included currently approved therapies or investigational therapies with reported promising results. These predominantly target the RTK-RAS, PI3K, cell-cycle, and p53 pathways. While some of these thera-pies are standard care, many are still investigational, and further testing is required to assess how effective different targeted therapies will be across tumor types and in tumors with different co-mutation spectra. Efforts are underway to develop therapies that target additional pathways, some of which are in clinical
tri-als (Table S6) (Park and Guan, 2013), (Whitfield et al., 2017),
(Whitfield et al., 2017), (Aster and Blacklow, 2012), (Takebe et al., 2014), (Buijs et al., 2012), (Sheen et al., 2013), (Pai et al.,
2017). In the Wnt signaling pathway, for example, two
ap-proaches involve drugs targeting PORCN, which is involved in the processing of wingless proteins, and monoclonal antibodies directed at proteins in the Frizzled gene family. While the Nrf2 pathway does not have therapies directly targeting any of the pathway members included in this study, alterations in Nrf2 pathway members (NFE2L2 and KEAP1) are used as part of the inclusion criteria in the Phase 2 trial of a TORC1/2 inhibitor. Clinical trials involving these pathways exemplify opportunities in precision medicine to associate additional functional
alter-ations as part of inclusion criteria (Table S6). Not all apparently
functional mutations, however, represent therapeutic targets, as illustrated, e.g., by the unusually large number of mutations in the MSI-H and POLE-mutated tumor subtypes, of which only a small fraction plausibly dominate oncogenesis. The observed co-occurrence patterns indicate a potential for combi-nation therapies in some tumor types. The development of tar-geted combination therapies has been challenging for several reasons, including lack of safety data for combinations, the rela-tively slow pace of adoption of clinically approved multi-panel gene tests and of clinical trials testing combinations of multiple targeted therapies. However, there is a growing corpus of prom-ising preclinical data indicating such combinations can be effec-tive, such as the combination of MDM2 and CDK4 inhibitors (Laroche-Clary et al., 2017), and the combination of PI3K inhibi-tors and HER2 inhibiinhibi-tors in HER2-positive/PIK3CA mutant breast cancer patients, even when single gene-therapy ap-proaches (e.g., PI3K monotherapy for PIK3CA mutant tumors) have thus far not had definitive clinical impact.
Although we cover a diverse range of oncogenic processes
that spans most tissues and organ systems (Figures 1and3),
we did not include some tumor types in the scope of this TCGA project, including most hematologic cancers. Further-more, in spite of the relatively large set of samples, this effort is still underpowered to reliably discover tumor-type specific alter-ations that occur at very low frequencies; these will require further exploration using larger tumor-type specific sample sets. The original aim and scope of TCGA was to genomically characterize primary, untreated tumors with a basic set of genetic alterations and transcript profiles. As the program is now completed, a future challenge is to expand these analyses to larger sample sets, additional data types, such as
metabo-lite levels, a wider range of epigenetic states, post-transla-tional modifications of proteins, and to investigate metastatic disease and genomic alterations that arise in post-treatment samples, as well as analyzing the role of a wider range of germline alterations and their interplay with somatic events. These new avenues of research will benefit from pathway-level analysis for which the templates and template curation pipe-lines presented here constitute a promising starting point. Similarly, as the catalog of clinically actionable alterations continues to grow, understanding intra- and inter-pathway de-pendencies, such as the ones considered here, will be crucial for the development of effective combination therapies that address or prevent resistance to initially successful single agent therapies.
The curated pathway templates and the uniformly processed dataset of alteration calls in 9,125 tumor samples are publicly
available (Tables S3andS4)and can be easily accessed through
the PathwayMapper tool (http://pathwaymapper.org/), which
allows alteration frequencies to be visually overlaid on the pathway templates; and, via the cBioPortal for Cancer Genomics (http://www.cbioportal.org/). This pathway landscape in The Can-cer Genome Atlas is meant to provide a valuable resource for clin-ical oncologists, for cancer researchers and for a broad scientific community interested in cancer precision medicine.
STAR+METHODS
Detailed methods are provided in the online version of this paper and include the following:
d KEY RESOURCES TABLE
d CONTACT FOR REAGENT AND RESOURCE SHARING d EXPERIMENTAL MODEL AND SUBJECT DETAILS
B Sample Selection and Exclusions
d METHOD DETAILS
B Somatic mutation calling
B Pathway Template Curation
B Epigenetic silencing
B Gene fusion detection and filtering
B Generation of Genomic Alteration Matrices (GAMs)
B Analysis of conditional selection between alterations
B Pathway-level analysis of conditional selection
B Curation of Clinical Trials
d QUANTIFICATION AND STATISTICAL ANALYSIS d DATA AND SOFTWARE AVAILABILITY
d ADDITIONAL RESOURCES
SUPPLEMENTAL INFORMATION
Supplemental Information includes four figures and eight tables and can be found with this article online athttps://doi.org/10.1016/j.cell.2018.03.035.
ACKNOWLEDGMENTS
This work was supported by NIH Grants U54 HG003273, U54 HG003067, U54 HG003079, U24 CA143799, U24 CA143835, U24 CA143840, U24 CA143843, U24 CA143845, U24 CA143848, U24 CA143858, U24 CA143866, U24 CA143867, U24 CA143882, U24 CA143883, U24 CA144025, P30 CA016672.