Full Terms & Conditions of access and use can be found at
http://www.tandfonline.com/action/journalInformation?journalCode=gfer20
Download by: [Bilkent University] Date: 13 November 2017, At: 03:54
Ferroelectrics
ISSN: 0015-0193 (Print) 1563-5112 (Online) Journal homepage: http://www.tandfonline.com/loi/gfer20
Modeling and Simulation of the Ferroelectric
Based Micro Gyroscope: FEM Analysis
Zafer Ozer , Amirullah M. Mamedov & Ekmel Ozbay
To cite this article: Zafer Ozer , Amirullah M. Mamedov & Ekmel Ozbay (2013) Modeling and Simulation of the Ferroelectric Based Micro Gyroscope: FEM Analysis, Ferroelectrics, 446:1, 46-58, DOI: 10.1080/00150193.2013.821002
To link to this article: http://dx.doi.org/10.1080/00150193.2013.821002
Published online: 23 Sep 2013.
Submit your article to this journal
Article views: 71
View related articles
ISSN: 0015-0193 print / 1563-5112 online DOI: 10.1080/00150193.2013.821002
Modeling and Simulation of the Ferroelectric Based
Micro Gyroscope: FEM Analysis
ZAFER OZER,
1,∗AMIRULLAH M. MAMEDOV,
2AND EKMEL OZBAY
21Mersin University, Mersin, Turkey
2Bilkent University, Nanotechnology Research Center (NANOTAM),
Ankara, Turkey
This paper presents the design and modeling of micro-electromechanical systems (MEMS) on the ternary ferroelectric compounds (PZT) based by using finite element model (FEM) simulation. The conceptual framework establishes five steps to perform the critical analysis: design a novel structure, define the failure mechanisms under the given conditions, analyze different vibrations, analyze the operation principle, and de-tect resonance modes. In addition, MEMS failure modes were analyzed under different scenarios and the obtained results discussed.
Keywords gyroscope; ferroelectrics; FEM
I. Introduction
Micro-electro-mechanical systems (MEMS), a technology which allows the integration of micro machined mechanical structures with integrated circuits (IC), has been a fast growing area of research and technology during the last two decades (e.g., CMOS, Bipolar or BICMOS processes). The success of MEMS technology largely depends on successfully solving the material issues associated with the design and fabrication of complex devices. In the early stages of MEMS development, the material used in MEMS were limited to those used in microelectronics, taking advantage of well-known processes and materials such as Si and GaAs.
A wide variety of functional materials could not be used due to integration, compatibil-ity, or even contamination issues. Two examples are lead zirconate titanate (PZT) and other oxygen-octahedral ferroelectrics (ABO3). Although PZT and ABO3 were very attractive
materials for MEMS due to its high sensitivity in gyroscope applications.
It is well-known that MEMS gyroscopes rely on two principles. The first principle is the resonating vibration of proof mass. The second principle is the Coriolis effect [1–2]. The majority of MEMS vibratory gyroscopes use the Coriolis force to detect the angular velocity of a rotating body, which the gyroscope is attached to, by oscillating a proof mass that is suspended with elastic springs that restrict the mass to move in two degrees of freedom (DOF).
Received September 29, 2012; in final form April 4, 2013.
∗Corresponding author. E-mail: [email protected]
46
The physical mechanisms underlying MEMS devices include capacitive, piezoresistive, electromagnetic, piezoelectric, ferroelectric, optical, and tunneling. The most successful types are based on capacitive transduction [3–5].
In this paper, we design novel structures, that are resistant to shock and sensitive to biaxial applied angular velocity, and analyze different reference vibrations. Finally, the best one with a higher resolution, lower coupling effect, and convenient anchor is chosen as the device. In addition, we analyze the operation principle, discuss the problem about the fixing gyroscope and find a special point to detect the resonance mode. This gyroscope has a simple structure and is completely solid. It is excited in special resonance mode and utilized mode vibration of piezoelectric materials (as material we used PZT-ceramics) as reference vibrations.
II. MEMS Gyroscope Structure, Design and Simulation
ANSYS is a general-purpose finite element analysis (FEA) software package [6]. Finite Element Analysis is a numerical method of deconstructing a complex system into very small pieces (of user-designated size) called elements. A mesh of SOLID5 elements with 8 DOF was used to define the structure of the device within ANSYS. The software implements equations that govern the behavior of these elements and solves all of them by creating a comprehensive explanation of how the system acts as a whole.
This type of analysis is typically used for the design and optimization of a system far too complex to analyze by hand.
Systems that may fit into this category are too complex due to their geometry, scale, or governing equations. The structure itself is more complex in comparison to the other gyroscope since it contains an additional frame that increases the DOF. Several of the significant mode shapes are shown below. For PZT-5H, the 25th, 28th mode shapes are in-plane modes that occur at 436379 kHz, 452251 kHz, for PZT-5J, the 19th, 29th mode shapes are in-plane modes which occur at 355681 kHz, 427659 kHz. The first mode is in the deriving, x-direction, which only affects the middle frame.
For PZT-5H, the 25th mode is in the sensing, x-direction, which exclusively affects the proof mass since it is the only mass that has a DOF in that direction. The 28th mode also vibrates in the driving direction but the middle and outside frames vibrate out of phase each other.
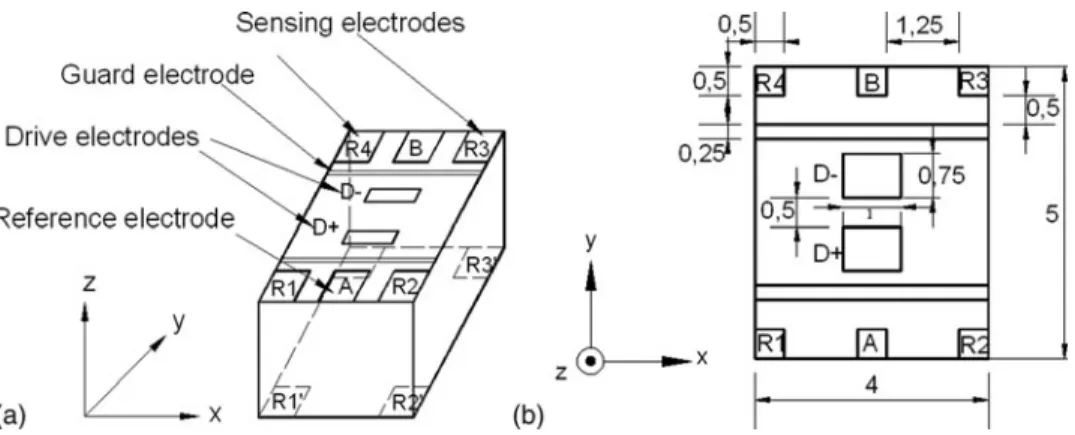
In 2006, Maenaka et al., proposed a novel piezoelectric solid gyroscope [7], which is named as piezoelectric micromachined modal gyroscope (PMMG) [8]. The basic op-eration principle of the device is shown in Figure 1. At first, assume that the rectan-gular prism is made of PZT, and it has polarization along the z-axis. With the excita-tion of the PZT prism at the operaexcita-tion mode menexcita-tioned before, the differential vibra-tion to the x-axis in the prism appears as shown in Figure 1. When the angular velocity along the y-axis is applied, the Coriolis force is generated according to the movement of the mass elements, resulting in compressive and tensile stresses depending on the posi-tion. These stresses differentially generate the piezoelectric voltage at the surface of the device.
This voltage is proportional to the applied angular rate and is an output signal of the device. Piezoelectric ceramic material PZT is selected as the substrate block. On the top and bottom surfaces of the PZT block, a lot of driving electrodes and sensing elec-trodes are distributed. As shown in Figure 1a, D+ and D− are the driving elecelec-trodes, and the exciting voltages are applied on the D+ and D− electrodes. A and B are the
Figure 1. a) Principle of operation, b) detail structure of the solid state gyroscope.
reference electrodes, which can be used for searching and tracking the working resonance mode. R1, R2, R3, and R4 are the sensing electrodes. When there is no angular input, the voltages of two adjacent electrodes, such as R1 and R2, or R3 and R4, are the same because of the symmetric structure of the piezoelectric block. If the rotation in any di-rection perpendicular to the modal vibration is input, the voltage of sensing electrodes is changed because of the coupling of the Coriolis effect, and then the voltages of two adjacent electrodes are not the same. Through detecting the voltage difference of two ad-jacent sensing electrodes, the rotation input can be quantized. On the bottom surface, the sensing and driving electrodes are distributed in the corresponding positions as on the top surface.
Table 1
The calculated performance of gyroscopes, when some resonance modes are used as reference vibration PZT-4 PZT-5H PZT-5J PZT-6B PZT-7A PZT-8 Working Resonance Frequency (Hz) 403867 452251 355681 558485 429330 410531 Sense axis displacement of A electrode (e−8m) 2.79 1.67 3.70 5.69 1.41 1.37 Sense axis displacement of R1 electrode (e−8 m) 2.59 1.09 3.35 1.06 1.29 1.44
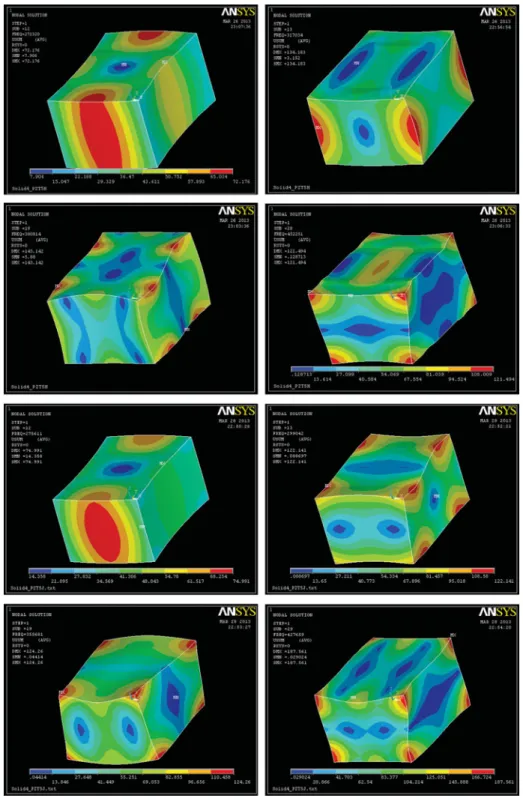
Figure 2. Longitudinal resonance modes with no DOF restrictions for PZT-5H and PZT-5J (Contours show displacement sum). a) 12th mode 272319 Hz, b) 13th mode 317033 Hz, c) 19th mode 390814 Hz, d) 28th mode 452251 Hz, e) 12th mode 275610 Hz, f) 13th mode 299042 Hz, g) 19th mode 355681 Hz, h) 29th mode 427659 Hz.
Table 2
Modal analysis results of PZT-5H and PZT-5J Mode PZT-5H PZT-5J 1 — — 2 — — 3 — — 4 — — 5 0.012277 — 6 0.024138 0.006622 7 161230.4 156443.4 8 228584.2 213839.2 9 233138.8 228395.9 10 248334.8 253895.5 11 269011.6 260173.4 12 272319.9 275610.6 13 317033.6 299042.3 14 323823.1 299864.1 15 328113.2 310354.4 16 330038.8 321235.9 17 361750.4 328080.3 18 381463.3 345772.2 19 390814.2 355681.4 20 395379.2 357233.1 21 405511.3 365596.8 22 430863.2 373302 23 431051.5 386676.3 24 434995 392953.5 25 436378.7 398499.8 26 438865.7 399431.2 27 447050.7 407484.4 28 452251.5 419268.3 29 454544.4 427659.3 30 455987.2 427798.2 31 461692 428201.1 32 479980.5 434685.8 33 494187.7 439853.6 34 499831 441150.7 35 511306 475071.1 36 551420.1 482285.2 37 554148.9 487261.1 38 555950.4 492282.6 39 558411.3 492511.2 40 559051.3 495285.6 41 562909.3 520820.1 42 566550.4 523780.2 43 582475.2 530307.3
(Continued on next page)
Table 2
Modal analysis results of PZT-5H and PZT-5J
(Continued) Mode PZT-5H PZT-5J 44 595451.3 538583.2 45 — 550233.1 46 — 554730.3 47 — 557708.8 48 — 563303.5 49 — 566583.1 50 — 567096.3 51 — 570782.5 52 — 574774.1 53 — 583080.7 54 — 585160.5 55 — 594014.6 56 — 597235.7
III. Results and Discussions
Material Selection
Piezoelectric material is commonly used for electromechanical transducers, and the require-ments for the performance of piezoelectric ceramic vary for different regions of applications. As for the solid-state micro gyroscope we used, the piezoelectric material serves as the excitation source and sensing element simultaneously, so the piezoelectric material should have larger piezoelectric constant d33 and electromechanical coupling constants k33 and
k15.
Based on these conditions, we selected PZT-5H and PZT-5J during following simula-tion. The PZT-5H material constants used in this paper are listed as follows: the relative dielectric permittivity (εr):ε11= 1700, ε33= 1470, material mass density (ρ): 7500 kg/m3,
the piezoelectric constant (e): e31= −6.5 C/m2, e33= 23.3 C/m2, e15= 17 C/m2, the elastic
constant matrix (c): c11= 12.6 × 10¹⁰N/m2, c12= 7.95 × 10¹⁰N/m2, c13= 8.41 × 10¹⁰ N/m2, c33= 11.7 × 10¹⁰N/m2, c44= 2.30 × 10¹⁰N/m2, c66= 2.33 × 10¹⁰N/m2. Compliance SE = ⎡ ⎢ ⎢ ⎢ ⎢ ⎢ ⎢ ⎣ 16.7 −4.84 −8.5 0 0 0 −4.84 16.7 −8.5 0 0 0 −8.5 −8.5 20.8 0 0 0 0 0 0 43.5 0 0 0 0 0 0 43.5 0 0 0 0 0 0 43 ⎤ ⎥ ⎥ ⎥ ⎥ ⎥ ⎥ ⎦ ∗ 10−12m 2 N
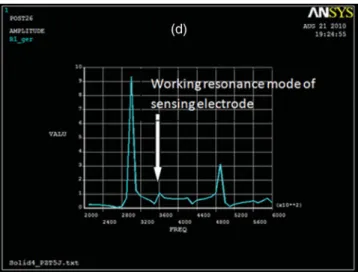
Figure 3. a) The piezoelectric voltage on reference electrode versus different driving frequencies for PZT-5H. b) The piezoelectric voltage on sensing electrode versus different driving frequencies for PZT-5H. c) The piezoelectric voltage on reference electrode versus different driving frequen-cies for PZT-5J. d) The piezoelectric voltage on sensing electrode versus different driving frequenfrequen-cies for PZT-5J (Color figure available online).
Figure 3. (Continued) (Color figure available online). Piezoelectric Coupling d= ⎡ ⎣ 00 00 00 739 0 00 739 0 −275 −275 594 0 0 0 ⎤ ⎦ ∗ 10−12C N Relative Permittivity εr ε0 = ⎡ ⎣17000 17000 00 0 0 1470 ⎤ ⎦ , ε0= 8.854∗10−12 F m
The PZT-5J material constants used in this paper are listed as follows: the relative dielectric permittivity (εr):ε11= 2720, ε33= 2600, material mass density (ρ): 7400 kg/m3,
the piezoelectric constant (e): e31 = −10.47 C/m2, e33 = 16.57 C/m2, e15 = 14.25 C/m2,
the elastic constant matrix (c): c11= 8.23 × 10¹⁰N/m2, c12= 3.41 × 10¹⁰N/m2, c13= 3.02
× 1010N/m2, c 33= 5.98 × 10¹⁰N/m2, c44= 2.13 × 10¹⁰N/m2, c66= 2.41 × 10¹⁰N/m2. Compliance SE = ⎡ ⎢ ⎢ ⎢ ⎢ ⎢ ⎢ ⎣ 16.2 −4.54 −5.9 0 0 0 −4.54 16.2 −5.9 0 0 0 −5.9 −5.9 227 0 0 0 0 0 0 47 0 0 0 0 0 0 47 0 0 0 0 0 0 415 ⎤ ⎥ ⎥ ⎥ ⎥ ⎥ ⎥ ⎦ ∗ 10−12m 2 N Piezoelectric Coupling d= ⎡ ⎣ 00 00 00 670 0 00 670 0 −220 −220 500 0 0 0 ⎤ ⎦ ∗ 10−12C N
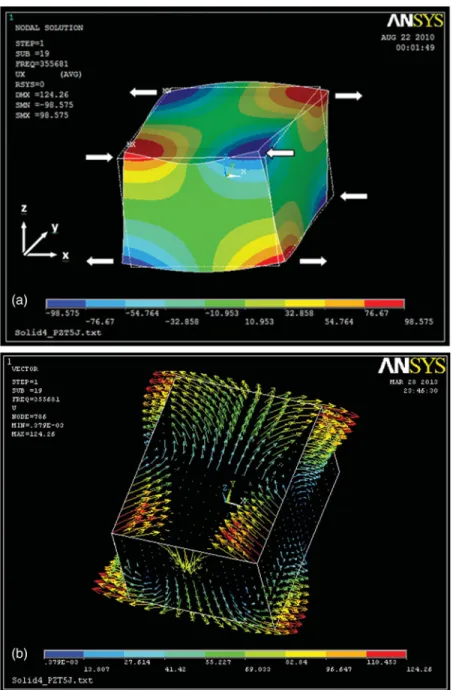
Figure 4. a) The x-axis displacement counter. b) Node displacement vectors on top surface of the 19th mode for PZT-5J. Relative Permittivity εr ε0 = ⎡ ⎣27200 27200 00 0 0 2600 ⎤ ⎦ , ε0= 8.854∗10−12 F m
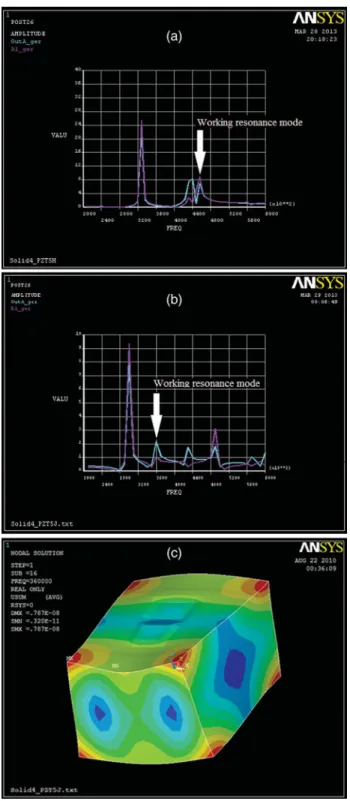
Figure 5. a) The piezoelectric voltage on reference and sensing electrodes vs different driving frequencies for PZT-5H. b) The piezoelectric voltage on reference and sensing electrodes vs different driving frequencies for PZT-5J. c) Harmonic excitation analysis result of the solid gyroscope (PZT-5J).
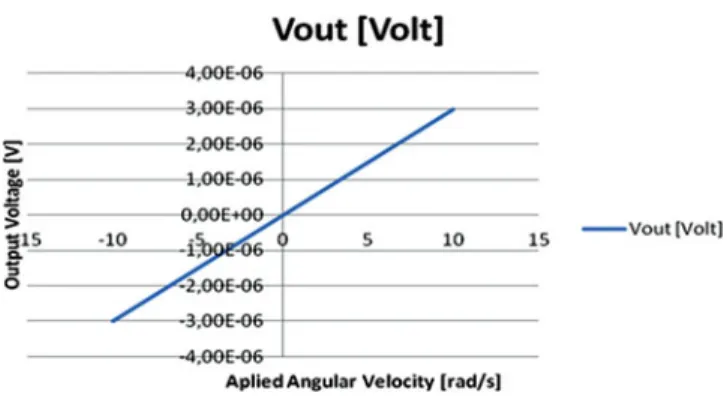
Figure 6. Output voltage vs. applied angular velocity for PZT-5H (Color figure available online).
Modal Analysis
In this section, the finite element analysis of the piezoelectric body of the PMMG was first conducted to find the operation mode, and then quantitative indicators were introduced to evaluate these modes and at last the best operation mode and the corresponding size of the device were given. From the operation principle of the PMMG, it can be concluded that the working resonance mode should have the following characteristics.
I. The movement of points in the piezoelectric block should be almost in one direction,
x-axis in this paper.
II. The moving direction of points should be perpendicular to the polarization direction of the piezoelectric block.
III. The moving direction of a point on one edge is the same as that of the corresponding point on the diagonal edge and is opposite to that of the corresponding point on the adjacent edge.
IV. Moving edges should be in the state of tension or compression. To get this special modal shape, we used ANSYS to perform modal analysis and list corresponding frequencies under which the modal shapes meet these characteristics.
We now present the results of numerical study. Figures 2(a)–(h) are some of simulation results that were obtained : Figure 2(a), mode (12), 272319 Hz, Figure 2(b), mode (13), 317033 Hz, Figure 2(c), mode (19), 390814 Hz, and Figure 2(e), mode (12), 452251 Hz for PZT-5H and Figure 2(e), mode (12), 275261 Hz, Figure 2(f), mode (13), 299042 Hz, Figure 2(g), mode (19), 355681 Hz, and Figure 2(h), mode (29), 427659 Hz for PZT-5J. It is seen from this Fig. that maximum stress is generated at the part of the edges of the PMMG. This gives the location of placing the electrodes on the surfaces of the PMMG to get the maximum sensitivity of sensor. Here, we introduce the results for PZT-5H and PZT-5J, but the results for all other PZT ceramics are very close to each other. The corresponding results for all PZT ceramics PMMG are listed in Tables 1 and 2.
Harmonic Analysis
In real applications, we need to apply a driving voltage to actuate the device. To make sure that the mode shape we activate is the same as the one we get in modal analysis, we used ANSYS to perform harmonic analysis. The configuration of the driving electrodes is shown in Figure 1. The amplitude of driving voltage is up to10V, and the phase difference
of the voltages on D+ and D− is 180o. The damping constant of the piezoelectric material
was introduced with the value 0.02. The frequency of the driving voltage was scanned from 200 kHz to 600 kHz. Figure 3 gives the harmonic analysis results of the PMMG. From the figure, we can see that there are two peaks of the voltage of the reference electrode (PZT-5H). The peak corresponding to the resonance mode is in the position of around 452 kHz. The frequency of the working resonance mode is 452251 Hz. for PZT-5H and 355681 Hz. for PZT-5J. We found five peaks of the voltage of the reference electrode and the peak corresponding to the working resonance mode is in the position of around 360 kHz for PZT-5J. In Figure 4a, the x-coordinate refers to the frequency of the driving voltage and the z-coordinate refers to the piezoelectric voltage amplitude on the reference electrode, R1 or R2. The peak corresponding to the working resonance mode is in the position of around 450 kHz. Also, from Figure 4b we can observe the node displacement directivity of our model. The figure shows that there is more kinetic energy stored in the effective vibration, and the vibration quality of piezoelectric block is better, than other configurations of PMMG. Figure 5a gives the harmonic analysis results of the PMMG (frequency of the working resonance mode is 452251 Hz for PZT-5H) and Figures 5b gives the harmonic analysis results of the PMMG (frequency of the working resonance mode is 355681 Hz for PZT-5J). Figure 5c shows the mode shape at the exciting frequency of the working resonance mode for PZT-5J. It is concluded that the exciting vibration of the piezoelectric block is the same as the vibrating shape of the working resonance mode. That is to say that through applying driving voltage with the frequency of the working resonance mode on the driving electrodes, the vibration of the working resonance mode can be the actuated account of the Coriolis force. Because the raw result of the output voltage for the applied angular velocity is differential with respect to x = 0, we applied the subtraction of the potentials at symmetric points, that is, Vsub1= VB − VA and Vsub2 = VC − VD. Fig. 6 shows the configuration of the driving electrodes, and Fig. 6 shows the relation between the Vsub1, Vsub2 and angular velocity applied to the device, respectively. As we can see from Figure 6, Vsub1 and Vsub2 have a liner relation with angular velocity, which agrees with the working principle of PMMG and testifies that the rotation input can be quantized through detecting the voltage difference of two adjacent sensing electrodes. To further optimize the size of the additional driving electrodes, we introduced three variables which should be changed: the length of the driving electrodes, the voltage applied on the driving electrodes, and the distance between two adjacent electrodes.
IV. Conclusions
In this paper, modal analysis was firstly conducted to determine the best operation mode for PMMG and we developed a set of quantitative indicators to evaluate various operation modes. The longitudinal vibrating gyroscope presented here will be one of the candidates for the next generation of gyroscopes which can operate in a heavy acceleration and shock environment. Futhermore, based on the analysis result, it is concluded that the model with integrated masses has a better vibration quality of the resonance mode and higher sensitivity to the rotation.
References
1. J. Soderkvist, Micromachined Gyroscopes, Sens. Actuators, A43, 65–71 (1994).
2. N. M. Barbour, Inertial Navigation Sensors, (NATO R&T Organization Publ.) RTO-EN-SET-116 (2011).
3. D. H.. Li, X. J. Zheng, B. Wu, and Y. C. Zhou, Fracture analysis of a surface through-thickness crack in PZT thin film under a continuous laser irradiation. Engineering Fracture Mechanics 76, 525–532 (2009).
4. X. Wu, W. Chen, W. Zhang, Y. Lu, F. Cui, and X. Zhao, Modeling Analysis of Piezoelectric Mi-cromachined Modal Gyroscope. In: Proc. Of the IEEE Intern. Conf. on Nano-Micro Engineered and Molecular Systems (2009, Shenzhen, China).
5. Y. Lu, X. Wu, W. Zhang, W. Chen, F. Cui, and W. Liu, Optimization and analysis of novel piezo-electric solid micro-gyroscope with high resistance to shock, Microsyst. Technol., 16, 571–584 (2010). Optimal special vibration used as reference vibration of vibratory gyroscopes, Electronics Lett. 46(2), (2010).
6. www.ansys.com
7. K Maenaka, H Kohara, (2006) Novel solid micro-gyroscope. In: Proceedings of micro electro mechanical systems workshop (MEMS 2006, Istanbul, Trukey January 2006), pp 634–639 8. X. Hu, X. Wu, Z. Wang, W. Chen, and W. Zhang, J. Sensors ID 106482, (2011).