Newcastle University ePrints - eprint.ncl.ac.uk
Akin S, Ulusu Y, Waller H, Lakey JH, Sonmezoglu S.
Insight into Interface Engineering at TiO
2/Dye through Molecularly
Functionalized Caf1 Biopolymer.
ACS Sustainable Chemistry and Engineering 2018, 6(2), 1825-1836.
Copyright:
This document is the Accepted Manuscript version of a Published Work that appeared in final form in ACS Sustainable Chemistry and Engineering, copyright © American Chemical Society after peer review and technical editing by the publisher. To access the final edited and published work see:
https://doi.org/10.1021/acssuschemeng.7b03206 DOI link to article:
https://doi.org/10.1021/acssuschemeng.7b03206 Date deposited:
13/03/2018
Embargo release date: 21 December 2018
Insight into interface engineering at TiO2/dye through molecularly functionalized Caf1 bio-polymer
Seckin Akin1,2, Yakup Ulusu3,4, Helen Waller4, Jeremy H. Lakey4, Savas Sonmezoglu1,2,*
1Department of Metallurgical & Materials Engineering, Karamanoglu Mehmetbey University, Karaman, Turkey 2Nanotechnology R&D Laboratory, Karamanoglu Mehmetbey University, Karaman, Turkey
3Department of Bioengineering, Karamanoglu Mehmetbey University, Karaman, Turkey
4Institute for Cell and Molecular Biosciences, Newcastle University, Newcastle upon Tyne,United Kingdom
Abstract
The fast charge recombination kinetics and poor sensitizing ability in dye-sensitized solar cells (DSSCs) result in a significant electron loss and performance degradation. However, the retarding of electron recombination and/or increasing light-harvesting efficiency (LHE) via employing an appropriate interface modifier in DSSCs has rarely been investigated. Here, we firstly report a molecularly engineered Caf1 protein (both in monomeric and polymeric forms) to modify the surface states by effectively shielding the unfavorable reactions and improve the light absorption properties by introducing alternative anchoring facilities. Using this novel Caf1bio-polymer with high thermal stability (even at 90 oC), we achieved an unprecedented efficiency of 8.31% under standard illumination test conditions and maintain the output performance even under prolonged irradiation. Time-resolved fluorescence spectroscopy measurement reveals an improved electron transfer rate (kET = 0.26 to 0.98×10⁸ s–1), whereas
Voc decay rate is lower (70% decay in 90 s) for Caf1-P@TiO2 based cell than that of bare one
(~85% decay in <10 s). We attributed this trend to the presence of chains in bio-polymer structure and the enhanced population of binding facilities with sensitizer molecules, promoting rapid charge transfer into TiO2 and enhanced dye-loading capability. Our results
shed light on the interface engineering and this novel Caf1bio-polymer offers a meaningful transfer of energy to develop efficient electrochemical cells with attractive properties for scale up and practical applications.
Keywords:Dye-sensitized solar cell, Interface engineering at TiO2/dye, Recombination kinetics, Photoinduced
electron transfer, Caf1bio-polymer.
*
Corresponding author.
Introduction
As has been the case for past years, the key challenge in the commercialization of dye-sensitized solar cells (DSSCs) is the insufficient electron transfer kinetics and/or highly occurred recombination reactions in device architecture 1, 2. Even though several approaches such as increasing the thickness or changing the morphology of photoelectrode 3-5, adding scattering layers or back reflectors 6, 7, employing various redox mediators 8, 9have been reported to further augment the light absorption, improve the electron transfer, and minimize the back reactions; surface modification of photoelectrode is still one of the most efficient way. Since a photoelectrode in DSSC acts as a light-harvesting part as well as a charge carrier. Its modification could, in principle, play a crucial role in enhancing the power conversion efficiency (PCE) contribution.
Up to date, various biomaterials have been employed as surface modifier on the functionalization of photoelectrodes. It has long been established that biomaterials with microscale features, including porosity and surface topography, have opened up the use of many different areas. While this field is still in its infancy, it is receiving enormous research attention, with the number of reports growing exponentially over the past few years 1, 2, 10, 11. For instance, Sewvandi et al. reported different kinds of organic silane to decrease the back electron transfer on the TiO2 surface. They found that silanization enhances the interfacial
resistances (Rrc) and the electron lifetimes (τ) of the TiO2 electrode, yielding a 22%
improvement in PCE (8.20%)12. An increase in PCE with correlative approach has also been reported in our previous reports1, 2. Although, similar reports claimed a more efficient energy yielding, even better than metal oxide based modifiers, these cells still suffer a series of energy losses due to the low thermal stability and short-term durability/resistance of biomaterials. In most of these studies, in addition to stability degradation, a significant reduction in Jsc was observed due to the poor anchoring facilities even though Voc and FF
were improved. As a solution to this deficiency, bio-polymeric structures have been developed which can provide a direct path to the electrodes for rapid charge transport (indicating high Jsc) hence, faster transport, as well known, tolerates higher recombination rate
(indicating high Voc) 1, 13-15. This approach has a green light for polymeric biomaterials to be
used in the energy sector and can be easily adapted/modified to the energy transfer mechanism in photovoltaic cells.
If a suitable material is immobilized onto photoelectrode, not only surface states are passivated by effectively shielding the unfavorable reactions (increase in Voc) but also LHEs
are improved by introducing alternative anchoring facilities (increase in Jsc).Caf1,from the
plague bacterium Yersinia pestis, can be the right biomaterial due to its definable bioactivity, especially for a wide pH stability ranges, long-term durability against monovalent and divalent salt, resistance to chemicals and also economical production/purification processes16. Apart from the other biomaterials, Caf1 has a high thermal stability even at 90 oC which makes it a quite suitable material in photovoltaic cells. It is likely that assembly of Caf1 on the photoelectrode was facilitated by the many carboxyl, hydroxyl, and/or other residues, contained in the protein sequence of Caf1, which binds easily to the surface of photoelectrode and catches the dye molecules effectively.
The enhancement in light-harvesting efficiency (LHE) by dye adsorption or other ways and suppress in back reactions are major aims to functionalize TiO2 by thermally stabile Caf1
bio-molecules. In this study, monomeric Caf1 bio-molecules were successfully polymerized and firstly applied in DSSCs as an interface modifier at bare TiO2/dye interface. We used the
interface-modification strategy and this strategy extended Jsc from 14.15 to 16.99 mA/cm2by
increasing the surface area, broadening the light absorption spectra as well as increased Voc from 725.9 to 741.3 mV by playing the role of assisting charge separation. Furthermore,
we describe the effects of chain length on the adsorption parameters, interfacial resistance, electron lifetime, and photovoltaic performances of DSSCs. These findings suggest that bio-functionalization by engineering of the photoelectrode can be a feasible strategy toward facile passivating mechanisms and high efficiencies. These phenomenons generated in this arena, such as genetically modified energy, have a potential to dominate the future of global energy demand and help increase the span and quality of our lives.
2. Materials and Methods
2.1. Materials
We have used all of starting materials and reagents by standard analytical grade from Merck or Aldrich without additional purification.
2.2. Expression/purification and characterizations of Caf1bio-polymer
Protein expression and purification:Recombinant Caf1 was produced in E. coli by expression
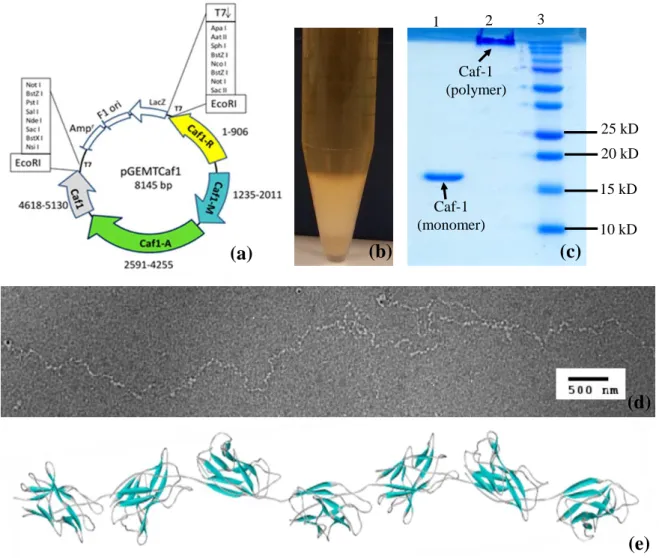
of the Caf1R (expression regulator) Caf1, Caf1M, and Caf1A (usher) genes (Fig. 1a). As previously reported in our study 17, pGEM-T Caf1 plasmid was transformed into BL21 (DE3)
competent E. coli cells. 500 mL terrific broth (TB) containing 100 µg ml-1 ampicillin in 2 L shake flasks were inoculated with single colonies and grown for 21 h at 35°C, 180 rpm. The cell pellet and flocculent layer shown in Fig. 1(b) were harvested at 8000 rpm, 22°C, 30 min (JA10 rotor) followed by ultracentrifugation at 40000 rpm, 22°C for 60 min (45Ti rotor). These were pooled and resuspended in PBS buffer plus 5 mg DNase and RNase. Caf1 was extracted by incubation in a water bath at 55 °C for 3-4 hr followed by 22°C overnight, and was collected in the supernatant from 2 x 60 min spins, 40000 rpm, 22°C (45Ti rotor). This was concentrated using a Vivacell100 (Sartorius), 100k MWCO concentrator and purified by size exclusion chromatography using a Superdex 200 16/60 column (GE Healthcare), with PBS as the running buffer (Figs. 1c and S1).
10 kD 20 kD 25 kD 15 kD Caf-1 (monomer) Caf-1 (polymer) (c) (a) (b) (d) (e) 1 2 3
Fig. 1.(a)- Schematic diagram of pGEMTCaf1 plasmid(b)- Secreted Caf1 as flocculent layer in terrific broth (c)-
15 % SDS-PAGE of purified Caf1, 1.Monomeric Caf1 (15.5 kDa) 2.Polymeric Caf1(≥250kDa) 3. Biorad precision plus molecular weight marker (d)- TEM image of Caf1 polymer, adapted from Ref. 20 with permission from corresponding author. Scale bar indicates 500 nm.(e)- Schematic model of Caf1 constructed using coordinates in PDB file 1Z9S.
Determination of thermal unfolding point of Caf1 by circular dichroism (CD):Thermal
unfolding experiments were conducted using a Jasco 810 spectropolarimeter with 1 mg.mL-1 Caf1 protein in a 0.1 cm quartz glass cuvette (Hellma; 110-1-40 QS). The temperature was increased from 20 – 95 °C at a rate of 2 °C /min. Data were collected in triplicate for all conditions at a wavelength of 290 nm, a data pitch of 0.2 °C, and a width of 2 nm. For testing the effect of pH on the thermostability of the protein, the following buffers were used: 50 mM glycine-hydrogen chloride (C2H5NO2-HCl) pH 2; 50 mM sodium citrate (C6H5Na3O7) pH 3-5;
50 mM sodium phosphate (Na3PO4) pH 6-8; 50 mM glycine-sodium hydroxide (C2H5NO2
-NaOH) pH 9-10; 50 mM sodium phosphate (Na2HPO4-NaOH) pH 11-12 (Fig. 2).
Differential Scanning Calorimetry (DSC) measurements: Caf1bio-polymer at a concentration
of 0.5 mg mL-1 was dialysed extensively into the buffer to be tested: 50 mM glycine-HCl pH 2.0, 20 mM sodium phosphate pH 6.0 or 50 mM sodium phosphate (Na2HPO4-NaOH) pH
12.0. DSC experiments were carried out from 20 to 120 °C. Six measurements of the buffer were acquired to allow baseline subtraction. Data were analysed using the Origin software package (OriginLab). Briefly, a buffer reference was subtracted, the data were normalized by concentration, and a baseline fitted and subtracted from the data (Fig. S2).
2.3. DSSC assembly
The preparation of TiO2 paste as well as the synthesis of di-tetrabutylammonium
cis-bis(isothiocyanato)bis(2,2’-bipyridyl-4,4’ dicarboxylato)ruthenium(II) (N-719) and I−/I3− based redox electrolyte were reported in our previous papers with some modifications2, 18
. To prepare the working electrodes, the fluorine doped tin oxide (FTO) substrate used as current collector (Asahi Glass; sheet resistance:<15/cm2) was first ultrasonically cleaned by a previously reported procedure19. After treatment in a UV-O3system (Bioforce– ProCleaner
Plus) for 15 min, the prepared TiO2 paste was deposited on substrate by doctor blading and
films were then sintered following a series of firing steps (at 125oC for 5 min, 325oC for 10 min, 450 oC for 15 min, and 500 oC for 30 min)to remove the polymeric binders and to ensure better electronic contact between particles. To increase the effective surface area and to improve the cell performance, the TiO2 films were immersed into a40 mM aqueous TiCl4
solution at 70 oC for 30 min and rinsed with water and ethanol, and sintered again at 500 oC for 30 min.TiCl4 was diluted with water to 2 M at 0 oC to make a stock solution, which was
kept in a freezer and freshly diluted to 40 mM with water for each TiCl4 treatment of the TiO2
s; Holmarc Spin Coating Unit) was applied to cover the top surface of the TiO2/TCl4 films
with Caf1bio-polymer. Afterward, these Caf1 functionalized TiO2 (denoted as Caf1-M@TiO2
andCaf1-P@TiO2) electrodes were immersed in the corresponding dye solution (0.5 mM) in
ethanol and kept at RT for 18 h to complete the sensitizer uptake. To prepare the platinum (Pt) counter electrode (CE), a hole was drilled on the FTO substrate by a hobby drill. After cleaning process and treatment in a UV-O3 system, the Pt catalyst was deposited on the
substrate by spin–coating ofH2PtCl6 solution (2 mg Pt in 1 ml 2-propanol) and repeating the
heat treatment at 400 oC for 30 min.
The assembly of corresponding devices were carried out according to our previous reports with some modifications 1, 2, 5, 18. In briefly, dye-covered TiO2electrode and Pt-CE were
assembled into a sandwich type cell and sealed with a hot-melt gasket of 60µm thickness made of the Surlyn (Solaronix, 74301).A drop of I−/I3− redox electrolyte, a solution of 0.01 M
iodine, 0.6 M 1–butyl–3–methylimidazolium iodide, 0.1 M 4–tert–butylpridine, and 0.1 M lithium iodide hydrate prepared in 3–methoxypropionitrile solvent, was put on the hole in the back of the CE. The electrolyte was introduced into the cell via vacuum back filling. The cell was placed in a small vacuum chamber to remove inside air. Exposing it again to ambient pressure causes the electrolyte to be driven into the cell. Finally, the hole was sealed using a hot melt sealing of Meltonix 1170-100PF (Solaronix, 74401) and a glass disc. Thus, both bare TiO2 (as a reference device) and Caf1@TiO2 based DSSCs were fabricated. The active area of
each device is approximately 0.36 cm2.
2.4. Characterization techniques
Thermal analysis curves (TGA) were obtained using a Perkin–Elmer Diamond thermal analyser with a sample size of 5–10 mg and a heating rate of 10oC/min under nitrogen atmosphere. Fourier transform infrared spectroscopy (FTIR) spectra were recorded on a Perkin Elmer 1605 FTIR System Spectrometer. Raman spectra was obtained using Bruker Senterra Dispersive Raman microscope spectrometer with 633 nm excitation from a 3 B diode laser having 9 cm−1 resolution in the spectral region of 800–100 cm−1. The specific surface area was determined from the linear portion of Brunauer–Emmet–Teller (BET) equation by Quantachrome–Quadrasorb Evo 4 Gas Sorption Surface Area and Pore Size Analyzer. The photoluminescence (PL) spectra of the films were recorded using a PTI Quanta Master 30 PC spectrofluorophotometer with a Xe lamp as the excitation source. We conducted ultraviolet (UV)-visible absorption measurements of the bare and
Caf1-functionalizedfilms and dye-adsorbed electrodes using a dual wavelength/double beam Shimadzu UV-3600 spectrophotometer. We analyzed the morphology and elemental mapping of the TiO2 layers using a JEOL 6390-LV Scanning Electron Microscope (SEM). The
time-resolved fluorescence lifetime measurements were recorded using a PCI-Board system (TimeHarp 200, PicoQuant). The measurement of the fluorescence lifetime is based on the time correlated single photon counting (TCSPC) method. The CV studies of Caf1 molecules as well as dye adsorbed bare/modified TiO2 electrodes were conducted with a BASI cell stand
C3 model cyclic voltammetry in a three-electrode configuration. The current–voltage (I–V) and external quantum efficiency (EQE) measurements of the fabricated DSSCs were obtained by using Keithley 4200 semiconductor characterization system using OAI Class AAA solar simulator under the AM 1.5G illumination of 100 mW.cm−2 as the light source and Enlitech QE-R system, respectively. The curves were recorded using a Keithley 4200 SCS characterization system. We carried out capacitance-voltage (C-V) and electrochemical impedance spectroscopy (EIS) studies using an Ivium-compactStat model potentiostat/galvanostat in a three-electrode configuration. Furthermore, the open circuit voltage decay (OCVD), multiple start/stop (on−off) cycles and photo-current stability profiles of the cells were recorded by a set up including solar simulator and Ivium compactStat system.
Results and Discussion
The polymerization has been proved by monitoring the TEM image. TEM image of Caf1 bio-polymer 20 and schematic model of Caf1 constructed using coordinates in PDB file 1Z9S can be seen in Figs. 1(d) and (e), respectively. TEM image of Caf1 reveals a long flexible linear polymer with up to 1.5 µm long. The bead-like structures along the polymer are 5.8 ± 1 nm long and correspond to single Caf1 proteins.
Circular dichroism (CD) studies were carried out in order to determine the effects of pH on the thermal unfolding point of Caf1bio-polymer at different pH solutions. As clearly seen in Fig. 2, the CD absorbance at 290 nm of the Caf1 polymeric protein in solutions between pH 2-12 was measured at temperatures between 25-95 °C. The results showed that Caf1 was stable at about pH 6 to about 90 °C. During the measurements, it was observed that the bio-polymer was precipitated at the isoelectric point (4.54) while the pH was being scanned. Due to this reason, the thermal unfolding point at pH 4 could not be determined. CD thermal unfolding measurements show that Caf1bio-polymer maintains stabile even at extreme pH
conditions. Similar results were obtained and confirmed by differential scanning calorimetry (DSC) measurements of Caf1 polymer (please see Fig. S2). This phenomenon makes the Caf1 quite promising material as a interface modifier in photovoltaic cells.
30 40 50 60 70 80 90 0.0 0.2 0.4 0.6 0.8 1.0
(a)
C D [ M d e g ] 2 9 0 n m Temperature (oC) pH2 pH3 pH5 pH6 pH7 pH8 pH9 pH10 pH11 pH12 2 3 4 5 6 7 8 9 10 11 12 55 60 65 70 75 80 85 90 95(b)
T h e r m a l U n fo ld in g M id p o in t. ( o C ) pHFig. 2.(a)- Thermal unfolding curves of Caf1 polymer under different pH conditions (b)-Thermal unfolding
mid-point of Caf1 polymer at different pH values. The CD measurement was carried out at 290 nm and between 25-95 °C at 1oC min-1. Reproduced with permission from reference (41).
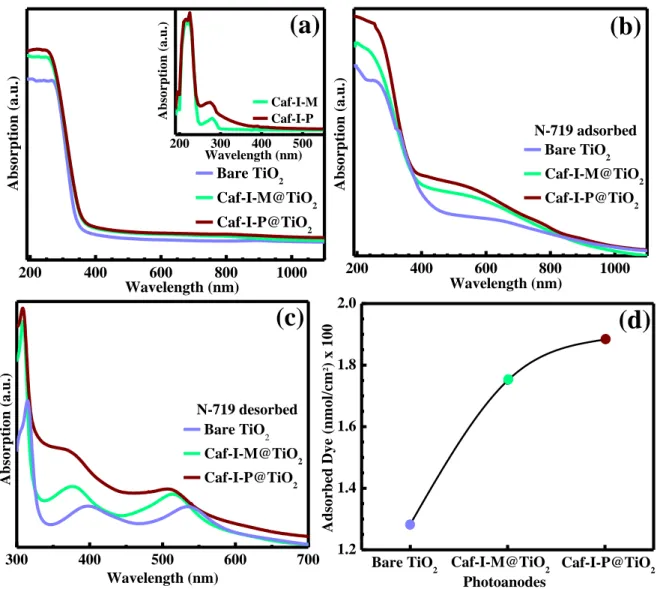
UV–visible absorption measurements were used to define the interactions between TiO2 and
Caf1, as well as Caf1@TiO2 and dye binding capability. Fig. 3(a) clearly shows an increased
absorptivity, especially in UV region, indicating that TiO2 interacts with Caf1molecules and
forms a complex. The inset of Fig. 3(a) shows the absorption spectra of Caf1-M and Caf1-P molecules in aqueous form, due to the absorption of UV sensitive aromatic base molecules in its architecture 1. This difference in their absorption intensity may be ascribed to two main approaches: the first is the difference in length of Caf1 molecules: polymerized Caf1-P has longer chains than monomer type Caf1-M whereas the second is the molecular character of Caf1molecule: Caf1-P (≥250 kDa) has a potential to provide more binding group hosted bases than Caf1-M (≈15kDa) (please see Fig. 1c).
Fig. 3(b) shows the absorption spectra of N–719 dye adsorbed bare and Caf1@TiO2
photoanodes. The dye accumulation at 400-600 nm range leads to an increase in the absorption of films(corresponding to the metal to ligand charge transfer of dye 21, confirming the robust binding of N-719 to the surface of the bare and functionalized TiO2. As compared
to bare TiO2, this functionalization provides new routes to enhance the response of the solar
functional groups. Both polar/nonpolar side chains of Caf1, shown in Fig. S3, and remaining empty sites on TiO2were expected to be occupied by dye molecules. There, these anchors may
act as agents to compensate defects on TiO2 and as charge recombination barriers at TiO2 /
redox electrolyte interface as well as may effectively enhance the light absorption of dye sensitized TiO2in both UV and visible regions as consistent with the blue shift of
Caf1-functionalized TiO2. In addition to their role in surface adsorption, these anchoring groups
typically act as electron acceptors. These phenomenons fulfill the major criterions for its usage as viable modifier in DSSCs. On the other hand, higher absorption value of Caf1-Pas compared to Caf1-M can be ascribed to a relatively longer series of molecule chains, indicating a higher distribution on the TiO2surface. Furthermore, it is likely that assembly of
Caf1 molecules on the TiO2was facilitated by the many carboxyl residues such as aspartic
acid, threonine, serine, phenylalanine, glutamic acid or etc., contained in the protein sequence of Caf1 (please see Fig. S3), which binds easily to the surface of electrode and dye molecules
22
.
The absorption spectra of N-719 dye desorbed from bare and Caf1@TiO2 photoanodes and
corresponding dye amounts of adsorbed dye were illustrated in Figs. 3(c) and (d), respectively. These results indicate an incredible enhancement (1.28x 10⁻⁷to 1.89 x 10
-7
mol.cm−2) in the amount of adsorbed dye in Caf1-P@TiO2photoanodes. In conclusion, these
results point to the fact that Caf1-P co-adsorbents would influence the intermolecular interactions on TiO2/dye interface and also extent of dye adsorption at the TiO2 surface due to
200 400 600 800 1000 200 300 400 500 Caf-I-M Caf-I-P A b so r p ti o n ( a .u .) Wavelength (nm)
(a)
Bare TiO2 Caf-I-M@TiO 2 Caf-I-P@TiO2 A b so r p ti o n ( a .u .) Wavelength (nm) 200 400 600 800 1000(b)
N-719 adsorbed Bare TiO 2 Caf-I-M@TiO2 Caf-I-P@TiO2 A b so r p ti o n ( a .u .) Wavelength (nm) 300 400 500 600 700 N-719 desorbed(c)
A b so r p ti o n ( a .u .) Wavelength (nm) Bare TiO2 Caf-I-M@TiO2 Caf-I-P@TiO2 1.2 1.4 1.6 1.8 2.0 Caf-I-P@TiO2 Bare TiO2(d)
Caf-I-M@TiO2 A d so rb ed D y e (n m o l/ cm 2) x 1 0 0 PhotoanodesFig. 3.(a)- Absorption spectra of bare and Caf1@TiO2 films. The inset shows the absorption spectra of
Caf1molecules in aqueous state. (b)- Absorption spectra of N–719 dye adsorbed bare and Caf1@TiO2 based
photoanodes. (c)- Absorption spectra of N–719 dye desorbed from bare and Caf1@TiO2 based photoanodes. (d)-
The corresponding concentrations of adsorbed dye as a function of photoanode material.
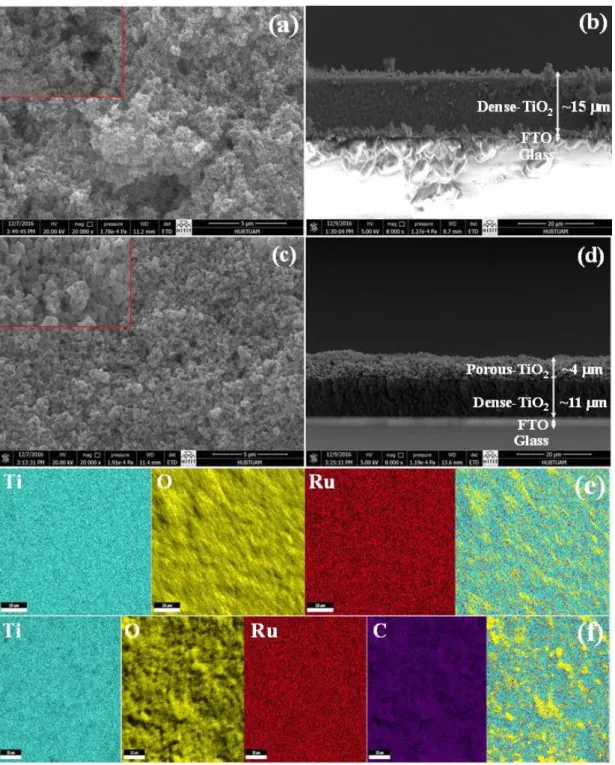
It is commonly reported that the photoelectrochemical performance of a photoanode is closely related to its structure at a micro/mesoscopic scale. The morphology and microstructure of bare and functionalizedTiO2photoanodes were characterized by FE-SEM analysis. The bare TiO2
presents a particulate morphology with an irregular and rough appearance (Fig. 4a). The particles grow on the FTO substrate non-continuously and formed agglomerates. In this electrode, there are not enough particle necking so electron diffusion is difficult. The surface of the functionalizedTiO2 photoanode is entirely covered by spherically oriented nanoparticles after
Caf1-Pimmobilization (Fig. 4c). It can be seen that the surface of the nanosphere is rough and has a porous structure, confirming a sponge-like structure for TiO2 layer, which is a
prerequisite for a highly efficient DSSC. It is anticipated that Caf1 molecules have been embedded into TiO2 surface to vigorously modify the surface in ward. This modification of
TiO2 concretizes particles’ borders, minimizes nanoparticle aggregation(indicating higher
LHE) and provides a higher surface area (51.38 m².g-1 to 79.77 m².g-1), so in these electrode, not only charge-transfer process is easier but also dye adsorption probability is higher than before as confirmed by absorption results (please see Figs. 3c and 3d).Furthermore, the thickness of the obtained TiO2 anodes were measured from the cross–sectional SEM images
as ~15 μm (Figs. 4b and 4d).In contrast to the visible change shown in the top-surface morphology of the films, any distinctive difference was not found in the cross–sectional images. That could be attributed greatly to the fact that Caf1 molecules were embedded into the TiO2
surface. Therefore, the effect of thickness on photovoltaic performance can be ignored. Furhermore, the side-view from the cross-section of Caf1-P grown on the TiO2 clearly confirms
that Caf1 molecules modify the top surface as plainly seen in surface image (Fig. 4c).The elemental distributions of bare and Caf1-P@TiO2 photoanodes are revealed by the EDS mappings
(Figs. 4e and 4f). The elemental mappings on bare and Caf1-P@TiO2 photoanodes confirm the
presence of Ti, O, and Ru elements in the structure. Obviously, the Ru ions are more strictly and uniformly distributed along surface of the functionalized TiO2 substrate as compared to hollow
bearing bare one. On the other hand, the presence of homogeneously distributed C elements display that C based Caf1bio-polymers are thoroughly encapsulated on thefunctionalizedTiO2
Fig. 4. SEM top view (left) and cross-section (right) images of bare (a,b) and CafI-P functionalized (c,d) TiO2
photoanodes. The insets show the magnified SEM images of corresponding photoanodes. Elemental mapping of bare (e) and Caf-I-P functionalized (f) TiO2 samples recorded by EDS spectroscopy. Ti, O, and Ru elements
have been detected by using bare and Caf1-P@TiO2 photoanodes while C element has been collected from the
Caf1-P@TiO2 film.
To determine the consistency of Caf1 in device architecture, in terms of energy levels, the cyclic voltammetry (CV) scan was monitored on Caf1-P with a 50 mV.s–1 scan rate. Representative cyclic voltammograms are displayed in Fig. S4(a) and the corresponding energy level alignments are shown in Fig. S4(b). From the Fig. S4(a), the onset of oxidation is
taken to be 649 mV, and used to calculate the HOMO levels of the Caf1-P molecules. To calculate the LUMO levels, the band gap of Caf1-P is determined from the absorbance data (Fig. 3a) where the band gap was derived from the observed optical edge and it is approximately 4.05 eV. The HOMO level of the Caf1-P (Caf1ECB) molecules is found to be
−5.05 eV whereas LUMO level (Caf1EVB) equals to −1.00 eV. This range is quite lower (more
negative) than the LUMO level of the N-719 (−3.01 eV) and higher (more positive) than the LUMO level of TiO2 (−4.26 eV). These results clearly demonstrate that a thin layer of Caf1-P
modifiers can be potentially efficient at suppressing recombination and minimizing back electron transportation in DSSC applications. Besides, functionalization with the Caf1-P layer, conduction–band electrons in TiO2 are unable to recombine with I3− ions at the
electrolytic interface.
Although protein based molecules are known as efficient modifier materials for device technology, the evergreen problem is their low thermal stability. To examine the role of Caf1 incorporation on the thermal stability of the TiO2 structure; dye, bare, and Caf1@TiO2samples
were investigated by thermogravimetric analysis (TGA). The TGA curves of the samples (please see Fig. S5) were collected under an inert atmosphere of N2 with a heating rate of 10
°C/min. A dramatic change was observed at ~230 °C for N-719 dye in solid state, indicating the thermal decomposition of dye. The obtained curve is in good agreement with the previously reported studies 23.Moreover, this technique allows us to distinguish between physically adsorbed and chemically bound hydroxyl or water groups on the TiO2 films. In
Fig.S5, the weight loss from 25°C to 120°C derives from the physically adsorbed water, while the weight loss in the range of 120-500°C is due to structural water or surface hydroxyl groups. In this analysis, the surface hydroxyl or molecular water contents of bare and Caf1-M@TiO2, and Caf1-P@TiO2is ~4.5 %, ~2.3 %,and ~2.1 %, respectively. Herein, we may
suggest that the surface hydroxyl groups play an important role and are involved in the binding between the dye and TiO2 surface producing binding sites or stabilizing the covalent
bonding. According to the TGA analysis, Caf1-M@TiO2, and Caf1-P@TiO2 have higher
stability than the bare one. These results suggest that the incorporation of Caf1 layers onto TiO2 structure results in an extra stability.
To evaluate the phase identification of the bare and functionalized TiO2, Raman spectroscopy
was performed in the range of 100-800 cm-1, and the obtained results are given in Fig. S6. The characteristic bands were observed at ~143, 198, 396, 519, and 638 cm-1for Eg(1), Eg(2), B1g,
the peak intensities were increased and broadened by the presence of Caf1 while all the samples have peak points at the same wavenumbers. This indicated that the interaction between the Caf1 and TiO2 affected the Raman resonance of the samples. This observation
also showed the successful deposition of Caf1 layer onto the TiO2 surface without any phase
transition 24.
In order to further look into the effect of Caf1 modification on the influence of photovoltaic performance, we investigated charge dynamics by measuring photoluminescence (PL) of the films. Fig. S7 shows the steady-state PL spectra of bare and Caf1 functionalized films excited at 325 nm. The bare TiO2 showed a broad and high PL intensity at around 580 nm, which can
be attributed to the recombination of the near band-to-band (B-B) as a result of the high photoinduced charge carrier recombination. The PL intensity of Caf1@TiO2was reduced by a
magnitude compared with that of bare one. This result indicates fast electron injection from dye into Caf1 and the presence of Caf1-P layer could be effective to enhance the photovoltaic performance of DSSCs. It is well known that polymeric structures and protein derivatives are strong electron acceptors, and provide high charge carrier transport since the bond would generate the new route of charge transfer25, 26. This was also ascribed to the formation of the Schottky barrier at the Caf1/TiO2 interface, which could act as an electron
sink to efficiently prevent the charge recombination processand consequently facilitate theseparation of charge carriers11, 27-29.
To demonstrate the binding performance of the Caf1-P molecule on the TiO2, FTIR transmittance
spectra ofbare TiO2 with or without Caf1-P were measured (Fig. S8). The stretching vibrational
peak for Ti–O–Ti bond was observed just below 1000 cm−1. The broad peak in the range of 2700–3600 cm−1 can be ascribed to the O–H stretching vibration of the hydroxyl groups on the surface of TiO2 30.The bands at 2865 and 2960 cm−1 can be assigned to the asymmetric and
symmetric stretching of CH2 groups on the alkyl chain. The peak near 1650 cm-1 in Fig. S8 is
mainly associated with the C=O stretching vibration(70-85%) and C-N groups (10-20%) and known as the amide I band31. It results from the C=O stretching vibrations of the peptide bond. Furthermore, the peak near 1400 cm-1 to result from protein side-chain
COO-32
.Comparing with the FTIR spectrum of bare TiO2, a noteworthy observation was the
disappearing and/or intensity decreasing of characteristic peaks in Caf1-P functionalized TiO2 samples while new peaks appeared. These alterations strongly confirm that, during
deposition process, strong chemical bonds via carbonyl, hydroxyl, and etc. functional groups were successfully formed between Caf1-P molecules and TiO2 nanoparticles19, 33.
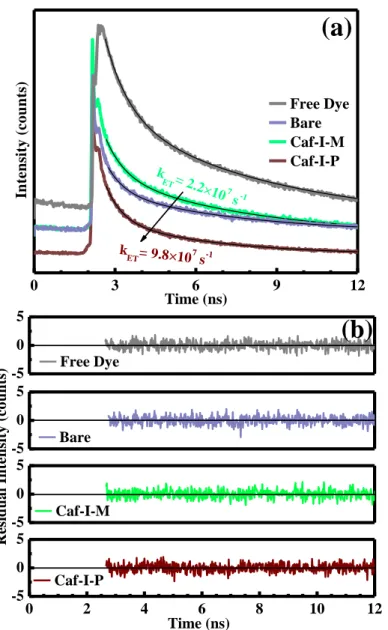
Charge transfer kinetics of bare and Caf1@TiO2 photoanodes, as primary photochemical
event, can be further appraised in terms of the photoinduced electron transfer (PET) theory. Decay parameters are determined using the double exponential tail fit model (Fig. 5a), and the best fits are obtained by minimizing χ2 values as seen in Fig.5(b). The fluorescence lifetime of a free N–719 dye molecule and dye-attached bare/Caf1-functionalized photoanodes were compared. Decay parameters of the samples were analyzed using double–exponential fitting model and calculated lifetime values were summarized in Table1. When Caf1-P molecules are functionalized on TiO2 surface, the intensity weighted fluorescence lifetime <> of the
molecules is inhibited (3.59 ns) as compared to bare TiO2 (4.83 ns) whereas Caf1-M yields
significantly less efficient inhibition of the decay parameters and the <> increases upto 4.94 ns. The dynamics behind the quenching mechanism of N–719 photoluminescence and the inhibition of the fluorescence lifetime of N–719 is anticipated due to the energy transfer mechanism from dye molecules to bare/Caf1@TiO2 nanoparticles. As shown in previous reports1, the dye molecules adsorbed on the semiconductor surface have significantly shorter <> values than the unadsorbed molecules. This decrease in lifetime can be correlated with the electron transfer process. If we suppose that this observed decrease in <> is entirely due to the PET process, the electron transfer rate constant, kET, can be estimated by comparing the
<> values in the presence and absence of TiO2 metal oxide nanoparticles (MON).
(1)
where and are the fluorescence lifetimes of the N-719 molecules in the absence and presence of the TiO2 nanoparticles, respectively. Using this relation, the electron transfer
rate can be obtained from the <>of dye on TiO2 MONs as shown in Table 1.
The presence ofCaf1-P layer promotes the interfacial charge transfer process in the excited state of dye to TiO2 and hence, higher value of kET (0.98×10⁸ s–1) was acquired compared to
bare TiO2 (0.26 × 10⁸ s−1) and Caf1-M@TiO2 (0.22 × 10⁸ s−1).This result indicates that the
charge transfer from dye to the conduction band of Caf1-P@TiO2 may be more efficient than
in the case of both bare and Caf1-M@TiO2. This means that we can increase the electron
transfer rate and obtain more efficient DSSCs by the presence of Caf1-P layer. This can be ascribed to the molecular nature of the Caf1-P and explained by the effective linker bridging role and larger surface area, which quickly transfer the excited electrons from dye to the conduction band of TiO2. On the other hand, the lower value of kET for bare and
Caf1-M@TiO2 can be attributed to several factors: i-) the non-porous structure, ii-) loosely bound
dye molecules, and iii-) the aggregated form that undergo poor electronic coupling with the Ti(3d) states of the TiO2 conduction band 19, 34. These obtained results clearly notify that
better charge transfer rate is possible in the case of Caf1-P@TiO2 system compared to both
bare and Caf1-M@TiO2 structure.
0 3 6 9 12 k ET= 9.8×10⁷ s-1 k ET= 2.2× 10⁷ s-1
(a)
In te n si ty ( c o u n ts ) Time (ns) Free Dye Bare Caf-I-M Caf-I-P 0 2 4 6 8 10 12 -5 0 5 -5 0 5 -5 0 5 -5 0 5(b)
Caf-I-P Time (ns) Caf-I-M R e si d u a l In te n si ty ( c o u n ts ) Bare Free DyeFig. 5. (a)- Fitting and calculation of decay parameters of N–719 dye molecules on microscope slide and TiO2
nanoparticles. (─) indicates double–exponential fitting curve. (b)- Residuals for fittings. The excitation source in the experiment is a nanosecond pulsed diode laser head with a wavelength of 405 nm.
Table 1. Decay parameters of N-719 dye on bare and Caf1@TiO2 and photoinduced electron transfer rates. A1
and A2: amplitude of each component; τ1 and τ2: corresponding lifetimes; <>: average lifetime; χ 2
:fitting parameters; kET: rate constant.
Samples A1 (kCnts) 1 (ns) A2 (kCnts) 2 (ns) <> (ns) χ2 k ET (s–1×10⁸) Dye 8.35 6.01 5.85 0.86 5.54 1.06 – Bare 2.27 5.20 1.48 0.63 4.83 1.00 0.26 Caf1-M 3.34 5.30 2.12 0.69 4.94 1.08 0.22 Caf1-P 1.90 4.05 1.93 0.61 3.59 1.01 0.98
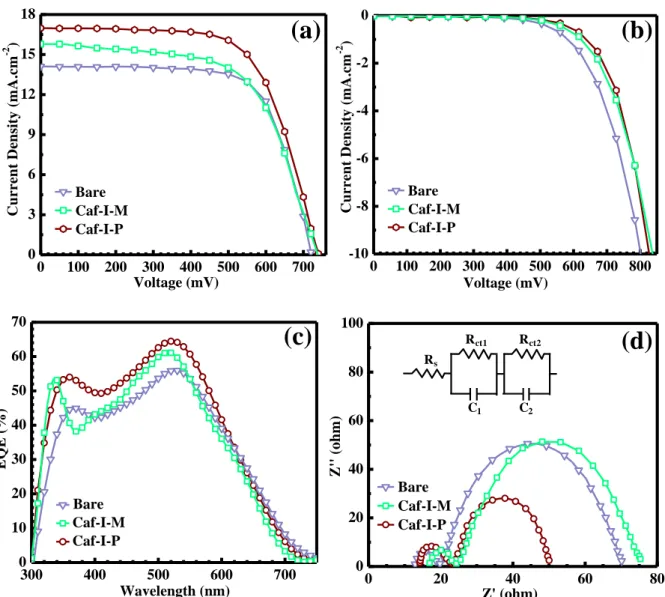
The performance of Caf1 molecules as surface modifier/co-absorbent in DSSCs was monitored using photocurrent density–photovoltage (J-V) data. The corresponding J-V curves are shown in Fig. 6a, and the obtained photovoltaic parameters are summarized in Table 2. With Caf1 materials, the Voc exhibited a considerable enhancement from ~726 mV for the
reference device to ~738 mV and ~741 mV for Caf1-M@TiO2 and Caf1-P@TiO2 based
DSSCs, respectively, while the Jsc exhibited an increase from 14.15 mA.cm−2 for the reference
DSSC to 15.82 mA.cm−2 and 16.99 mA.cm−2 for Caf1-M@TiO2 and Caf1-P@TiO2 based
DSSCs, respectively. The enhancement in Voc can be ascribed to less recombination rates at
the interface, due to the presence of Caf1 layer with a higher CB. The injected electrons have to overcome this barrier to recombine with the holes in HOMO level of dye and/or redox ions in the electrolyte. A similar enhancement in the Voc value has also been reported by Sewvandi
et al. with organic silane interposed layer modified TiO2 electrode [9]. However,
the relatively lower Voc and Jsc values of Caf1-M-functionalized DSSC can be ascribed to the
difference in side chains of Caf1 molecules, irregular distribution on the surface, and lower FF value. This indicates an unsuccessful charge transfer though well dye adsorption ability as shown in Fig. 3b.As the majority of known proteins are limited in their ability to increase the absorption of visible light, the TiO2 surface area, and the charge transfer rate. The use of
polymerized Caf1-P strategy extends Jsc by increasing the LHE and increases Voc by
minimizing the back electron transfer rate and/or charge recombination. This brings about the improvement of the PCE from 7.09% to 8.31%, through the efficient charge injection from proteins to TiO2 that improves the charge separation between TiO2 and dye and decreases the
current leakage between TiO2 and electrolyte as shown in the dark J-V curves (Fig. 6b).
To determine the accuracy of current densities obtained using J-V characteristics, we recorded the external quantum efficiency (EQE) curves of these devices (Fig. 6c). The differences between the Jsc values calculated from EQE integration and those calculated from J-V
characteristics were less than ~1%.The EQE characteristics show a similar tendency to absorption characteristics. As consistent with the absorption characteristics of the corresponding films shown in Fig. 3b, the devices based on Caf1 exhibited a higher EQE response in the range of 300-600 nm than that of bare one. This enhancement in visible region can be ascribed to more dye molecules adsorbed on the photoanodes which are bound to Caf1 molecules through a phosphonate anchor and larger specific surface area while co-sensitization effect of Caf1 molecules is dominant in UV region. This result can be further confirmed by comparing the PL spectra of the films, discussed further above. However, low conversion responses of bare TiO2 photoanode based DSSC may be because of the poor
interaction of sensitizers with the photoanode due to the vacant sites.
To understand the enhancement in Jsc, the electrochemical impedance spectroscopy (EIS)
analysis was carried out as shown in Fig. 6d. In the Nyquist plot, the resistance value of the lowest point in the semicircle (near to ~16 Ω) is related to the resistance of the both sides of electrodes (anode and cathode) and their interfaces. In this study, we consider that the reduced resistance value at the lower resistance region resulted from the improved carrier conductance in the bare and/or Caf1@TiO2/dye/electrolyte, because there were no changes
in the Pt/cathode part. The presence of Caf1 molecules at TiO2/dye interface brings
improvement in the current paths and enhancement in the charge conductance. Therefore, the charge transport performances of Caf1@TiO2 layer were improved due to the enhanced efficiency of the charge injection from dye, which resulted in the enhancement of Jsc parameter. The highest Jsc value of Caf1-P@TiO2 based DSSC is distinctly related to the
lowest value of charge transfer resistance (Rct2= 28.97 Ω).
To improve our understanding of the difference in Voc and the band energetics of the
Caf1@TiO2 electrode, we have performed capacitance-voltage (C-V) measurements at Voc
conditions (please see Fig. S9). From the flat-band potential (VFB) derived from a Mott–
Schottky plot, it is clear that flat band edge shows an obvious negative shift with Caf1immobilization on TiO2 electrode (from -0.52 V to -0.59 V and to -0.62 V for Caf1-M
and Caf1-P, respectively), which elongates the difference with the potential of the redox couple in the electrolyte. Meanwhile, after the immobilization of Caf1, the curve radius reduces, indicating that Caf1@TiO2 electrode could effectively improve the separation of
photo-generated electron–hole pairs. Furthermore, the slope decreased gradually, which confirms the role of Caf1immobilization on increasing the carrier density in TiO2. The carrier
densities of these electrodes can be calculated from the slopes of Mott-Schottky plots using the equation35
(2)
where Nd is the charge carrier density, e0 is the elementary electron charge, ε is the dielectric
constant of semiconductor electrode(ε = 170) 35, ε0 is the permittivity of free-space, and
d(1/C2)/dV is the slope of Mott-Schottky plot, which means the smaller the slope of Mott– Schottky plot is, the higher the charge carrier density will be 36. The calculated charge carrier densities of the bare TiO2, Caf1-M-, and Caf1-P@TiO2 are 6.28 × 10¹⁹, 6.90 × 10¹⁹, and 8.83×
1019 carrier/cm3, respectively. 0 100 200 300 400 500 600 700 0 3 6 9 12 15 18
(a)
Bare Caf-I-M Caf-I-P C u r r e n t D e n si ty ( m A .c m -2 ) Voltage (mV) 0 100 200 300 400 500 600 700 800 -10 -8 -6 -4 -2 0(b)
Bare Caf-I-M Caf-I-P C u rr en t D en si ty ( m A .c m -2 ) Voltage (mV) 300 400 500 600 700 0 10 20 30 40 50 60 70(c)
Bare Caf-I-M Caf-I-P E Q E ( % ) Wavelength (nm) 0 20 40 60 80 0 20 40 60 80 100 Rs Rct1 C1 Rct2 C2(d)
Bare Caf-I-M Caf-I-P Z '' ( o h m ) Z' (ohm)Fig. 6. (a)- The J-V curves of bare and Caf1@TiO2 photoanode based DSSCs. (b)- The dark J-V curves of bare
and and Caf1-assisted TiO2 photoanode based DSSCs.(c)- The EQE spectra of bare and and
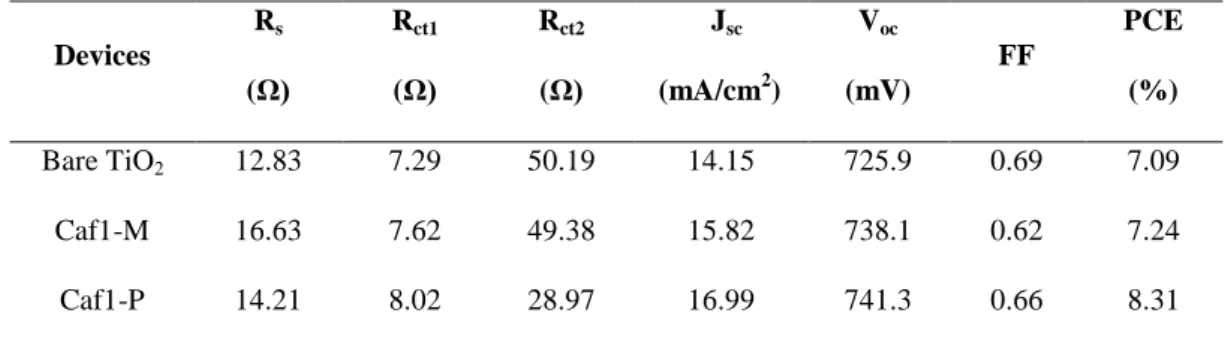
Table 2.TheEIS and photovoltaic parameters of bare and Caf1-functionalized photoanodes based DSSCs.
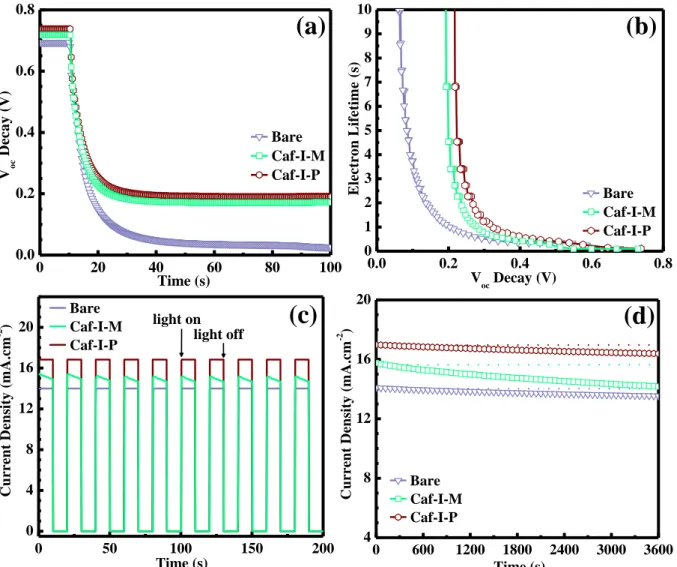
The OCVD analysis is performed using chronopotentiometry mode by switching off the illumination in a steady state and monitoring the subsequent decay of photovoltage. By OCVD profile shown in Fig 7a, useful information about the electron recombination processes and electron lifetime (τ) shown in Fig. 7b can be provided 37.The decay of the Voc
with decay-time thus reflects the recombination of electron with oxidized redox couple at the electrolyte interface38, 39. Apparently seen from the Fig. 7b, because of OCVD rate of DSSC based on Caf1-P@TiO2(70% decay in 90 s) is lower than that of bare one (~85% decay in <10
s), the electrons in Caf1-P@TiO2 based DSSC exhibit a longer τ and slower recombination
rate in comparison to bare TiO2 based DSSC, in keeping with the higher Voc and Jsc39. This is
exactly the expected trend due to the faster electron transfer kinetics at the Caf1-P@TiO2/dye
interface and lower electron recombination rate at theCaf1-P@TiO2/electrolyte interface.
These results emphasize the key role of recombination losses in limiting photoanode performance, and how these losses can be reduced by interface modification.
Devices Rs (Ω) Rct1 (Ω) Rct2 (Ω) Jsc (mA/cm2) Voc (mV) FF PCE (%) Bare TiO2 12.83 7.29 50.19 14.15 725.9 0.69 7.09 Caf1-M 16.63 7.62 49.38 15.82 738.1 0.62 7.24 Caf1-P 14.21 8.02 28.97 16.99 741.3 0.66 8.31
0 20 40 60 80 100 0.0 0.2 0.4 0.6 0.8
(a)
Bare Caf-I-M Caf-I-P V oc D e c a y ( V ) Time (s) 0.0 0.2 0.4 0.6 0.8 0 1 2 3 4 5 6 7 8 9 10(b)
Bare Caf-I-M Caf-I-P E le c tr o n L if e ti m e ( s) V oc Decay (V) 0 50 100 150 200 0 4 8 12 16 20 light off light on(c)
Bare Caf-I-M Caf-I-P C u rr en t D en si ty ( m A .c m -2 ) Time (s) 0 600 1200 1800 2400 3000 3600 4 8 12 16 20(d)
Bare Caf-I-M Caf-I-P C u rr en t D en si ty ( m A .c m -2 ) Time (s)Fig. 7. (a)- The variation of OCVD curve as a function of time recorded during the relaxation from illuminated
quasi-equilibrium to the dark. At the beginning of the OCVD measurement, cells were illuminated by the solar simulator for a steady voltage, and then the light was switched off and OCVD profiles were recorded using chronopotentiometry mode. (b)- Electron lifetime curves derived from OCVD measurement.(c)- The multiple start-stop switches. The on-off plots were obtained using chronoamperometry mode by alternately irradiating (1000 W/m2) and darkening (0 W/m2) the cells at 0 V, whereas the photocurrent stabilities were measured under a prolonged irradiation of 1000 W/m2.(d)- Photocurrent stabilities of the DSSCs with bare and Caf-I functionalized photoanodes. Stability profiles of the cells were recorded using chronoamperometry mode of the Ivium compactStat system under sustained irradiation of 100 mWcm−2 for 3600 s.
Transient photocurrent measurements (J-t) were performed to further determine the effects of Caf1 on the charge trapping and recombination of DSSCs while applying 0 V potential across the device and pulsing the light on the cell. Fig. 7c addresses the rise and fall of the Jscduring
several on–off cycles upon illumination at 100 mW.cm−2. The photocurrent of the bare and Caf1-P-functionalized devices increases sharply after illumination of the cell and remains almost constant until the illumination is turned off. The photocurrent decreases to its original value after turning off the illumination. The initial rise in the photocurrent transients indicates the
generation of more free charge carriers on illuminating the device while the decay of the photocurrent after turning off the illumination is due to trapping of the charge carriers in the deep levels. Moreover, the photocurrent of the bare and Caf1-P-functionalized devices under illumination is so stable (the operation of the cell is stable) and no obvious photocurrent decay is observed after ten start/stop cycles. The manifest photocurrent decay of Caf1-M-functionalized device is related to a larger number of trapped electrons and can be attributed to the lack of motivation in driving a DSSC. If a Jsc decay occurs under illumination (the
green curve in Fig. 7c), the cell’s dye regeneration is decaying due to the diffusion limit of electrolyte. The cause of lower value in FF can explain as a result of this phenomenon.
Long-term stability measurements using chronoamperometry mode were carried out on devices by subjecting them to continuous light soaking at full solar light intensity for 3600 s at RT (Fig. 7d). The cells were kept at their maximum power point during the prolonged illumination. We obtained almost better stability over this long period as compared to bare device (~96% of the initial Jsc remained), showing that the Caf1-P (~97% of the initial Jsc
remained) is a very stable modifier and not prone to degradation, even if exposed to intense sunlight for long illumination times. This can be ascribed to the introduction of stronger anchoring groups into the high-performance Caf1-P concept (covalent linkage). As generally known and seen in Caf1-P concept, insertion of proteins on a solid support often leads to a significant increase in stability 40, however, this phenomenon is not exactly exist for Caf1-M-functionalized device (~89% of the initial Jsc remained) during the 3600 s of light soaking,
resulting from the irregular distribution on the surface.
Conclusions
In this study, molecularly engineered Caf1proteins in monomeric and polymeric forms were successfully synthesized and firstly assembled at TiO2/dye interface. The immobilization of
Caf1-P leads to higher value of kET (0.98 × 10⁸ s–1) and enhanced dye loading capability
(~48%) as compared to bare TiO2 (0.26 × 10⁸ s−1). As a consequence, the PCE of the Caf1
functionalized TiO2electrode (7.24% and 8.31%) was improved to a great extent upon Caf1
immobilization as compared to bare cell (7.09%), dependent on the base length of Caf1 molecules. This improvement in the PCE is due to the fact that Caf1not only reduced the electrolyte–electrode interfacial resistance and the charge recombination rate, but also construct a bridge between photoanode and N-719 molecules, thereby facilitating the electron
transfer from the excited state of the photosensitizers to the CB of TiO2, confirming the
enhanced transport of electrons. This architecture based on Caf1-P@TiO2 with relatively high
thermal/chemical stability, enhanced surface area/dye adsorption, higher electron transfer rate/minimized back reactions, can also serve as substitution for bare structures in other opto-electronic applications including photocatalysis, photodetectors, water splitting, etc.
Acknowledgments
The authors would like to express their thanks to Dr. Andrei Soliakov due to his excellent technical support for providing TEM image of polymeric Caf1.
References
(1) Ates Sonmezoglu, O.; Akin, S.; Terzi, B.; Mutlu, S.; Sonmezoglu, S. An Effective Approach for High-Efficiency Photoelectrochemical Solar Cells by Using Bifunctional DNA Molecules Modified Photoanode. Adv Funct Mater 2016, 26, 8776-8783.
(2) Akin, S.; Gulen, M.; Sayin, S.; Azak, H.; Yildiz H. B.; Sonmezoglu, S. Modification of Photoelectrode with Thiol-Functionalized Calix[4]arenes as Interface Energy Barrier for High Efficiency in Dye-Sensitized Solar Cells. J Power Sources 2016, 307, 796-805.
(3) Kim, K. S.; Song, H.; Nam, S. H.; Kim, S. M.; Jeong, H.; Kim W. B.; Jung, G. Y. Fabrication of an Efficient Light-Scattering Functionalized Photoanode Using Periodically Aligned ZnO Hemisphere Crystals for Dye-Sensitized Solar Cells. Adv
Mater 2012, 24, 792-798.
(4) Feng, X. J.; Zhu, K.; Frank, A. J.; Grimes, C. A.; Mallouk, T. E. Rapid Charge Transport in Dye-Sensitized Solar Cells Made from Vertically Aligned Single-Crystal Rutile TiO2 Nanowires. Angew Chem Int Edit 2012, 51, 2727-2730.
(5) Sonmezoglu, S.; Eskizeybek, V.; Toumiat, A.; Avci, A. Fast production of ZnO Nanorods by Arc Discharge in De-Ionized Water and Applications in Dye-Sensitized Solar Cells. J Alloy Compd 2014, 586, 593-599.
(6) Roy, P.; Kim, D.; Lee, K.; Spiecker, E.; Schmuki, P. TiO2 Nanotubes and Their
Application in Dye-Sensitized Solar Cells. Nanoscale 2010, 2, 45-59.
(7) Han, S. H.; Lee, S.; Shin, H.; Jung, H. S. A Quasi-Inverse Opal Layer Based on Highly Crystalline TiO2 Nanoparticles: A New Light-Scattering Layer in
(8) Hao, Y.; Yang, W.; Zhang, L.; Jiang, R.; Mijangos, E.; Saygili, Y.; Hammarstrom, L.; Hagfeldt, A.; Boschloo, G. A Small Electron Donor in Cobalt Complex Electrolyte Significantly Improves Efficiency in Dye-Sensitized Solar Cells. Nature
Communications 2016, 7, 13934.
(9) Sonmezoglu, S.; Akyurek, C.; Akin, S. High-Efficiency Dye-Sensitized Solar Cells using Ferrocene-Based Electrolytes and Natural Photosensitizers. J Phys D Appl Phys
2012, 45, Artn 425101.
(10) Park, H.; Heldman, N.; Rebentrost, P.; Abbondanza, L.; Iagatti A.; Alessi, A.; Patrizi, B.; Salvalaggio, M.; Bussotti, L.; Mohseni, M.; Caruso, F.; Johnsen, H. C.; Fusco, R.; Foggi, P.; Scudo, P. F.; Lloyd S.; Belcher, A. M. Enhanced Energy Transport in Genetically Engineered Excitonic Networks. Nat Mater 2016, 15, 211-216.
(11) Schuergers, N.; Werlang, C.; Ajo-Franklin, C. M.; Boghossian, A. A. A Synthetic Biology Approach to Engineering Living Photovoltaics. Energ Environ Sci 2017, 10, 1102-1115.
(12) Sewvandi, G. A.; Tao, Z. Q.; Kusunose, T.; Tanaka, Y.; Nakanishi, S.; Feng, Q. Modification of TiO2 Electrode with Organic Silane Interposed Layer for
High-Performance of Dye-Sensitized Solar Cells. ACS Appl Mater Inter 2014, 6, 5818-5826.
(13) Koh, J. K.; Kim, J.; Kim, B.; Kim, J. H.; Kim, E. Highly Efficient, Iodine-Free Dye-Sensitized Solar Cells with Solid-State Synthesis of Conducting Polymers. Adv Mater
2011, 23, 1641-1646.
(14) Liu, X. Z. Zhang, W.; Uchida, S.; Cai, L. P.; Liu, B.; Ramakrishna, S. An Efficient Organic-Dye-Sensitized Solar Cell with in situ Polymerized Poly(3,4-ethylenedioxythiophene) as a Hole-Transporting Material. Adv Mater 2010, 22, E150-E155.
(15) Sonmezoglu, S.; Tas, R.; Akin, S.; Can, M. Polyaniline Micro-Rods Based Heterojunction Solar Cell: Structural and Photovoltaic Properties. Appl Phys Lett
2012, 101, Artn 253301.
(16) Zavialov, A. V.; Berglund, J.; Pudney, A. F.; Fooks, L. J.; Ibrahim, T. M.; MacIntyre, S.; Knight, S. D. Structure and Biogenesis of the Capsular F1 Antigen From Yersinia Pestis: Preserved folding Energy Drives Fiber Formation. Cell 2003, 113, 587-596.
(17) Roque, A. I.; Soliakov, A.; Birch, M. A.; Philips, S. R.; Shah, D. S. H.; Lakey, J. H. Reversible Non-Stick Behaviour of a Bacterial Protein Polymer Provides a Tuneable Molecular Mimic for Cell and Tissue Engineering. Adv Mater 2014, 26, 2704-2709. (18) Ozel, F.; Sarilmaz, A.; Istanbullu, B.; Aljabour, A.; Kus, M.; Sonmezoglu, S.
Penternary Chalcogenides Nanocrystals as Catalytic Materials for Efficient Counter Electrodes in Dye-Synthesized Solar Cells. Sci Rep 2016, 6, Artn 29207.
(19) Akin, S.; Acikgoz, S.; Gulen, M.; Akyurek, C.; Sonmezoglu, S. Investigation of the Photoinduced Electron Injection Processes for Natural Dye-Sensitized Solar Cells: The Impact of Anchoring Groups. RSC Adv 2016, 6, 85125-85134.
(20) Soliakov, A.; Harris, J. R.; Watkinson, A.; Lakey, J. H. The Structure of Yersinia Pestis Caf1 Polymer in Free and Adjuvant Bound States. Vaccine 2010, 28, 5746-5754.
(21) Dell'Orto, E.; Raimondo, L.; Sassella, A.; Abbotto, A. Dye-Sensitized Solar Cells: Spectroscopic Evaluation of Dye Loading on TiO2. J Mater Chem 2012, 22,
11364-11369.
(22) Nagata, M.; Amano, M.; Joke, T.; Fujii, K.; Okuda, A.; Kondo, M.; Ishigure, S.;Dewa, T.; Iida, K.; Secundo, F.; Amao, Y.; Hashimoto, H.; Nango, M. Immobilization and Photocurrent Activity of a Light-Harvesting Antenna Complex II, LHCII, Isolated from a Plant on Electrodes. ACS Macro Lett 2012, 1, 296-299.
(23) Jeon, S. O.; Yook, K. S.; Chin, B. D.; Park, Y. S.; Lee, J. Y. Improved Open-Circuit Voltage and Efficiency in Organic Solar Cells using a Phosphine Oxide Based Interlayer Material. Sol Energ Mat Sol C 2010, 94, 1389-1392.
(24) Sivaranjani, K.; Gopinath, C. S. Porosity Driven Photocatalytic Activity of Wormhole Mesoporous TiO2-xNx in Direct Sunlight. J Mater Chem 2011, 21, 2639-2647.
(25) Chang, H.; Chen, Z. M.; Yang, X. Y.; Yin, Q. W.; Zhang, J.; Ying, L.; Jiang, X. F.; Xu, B. M.; Huang, F.; Cao, Y. Novel Perylene Diimide Based Polymeric Electron-Acceptors Containing Ethynyl as the Pi-Bridge for All-Polymer Solar Cells. Org
Electron 2017, 45, 227-233.
(26) Kitano, S.; Murakami, N.; Ohno, T.; Mitani, Y.; Nosaka, Y.; Asakura, H.; Teramura, K.;Tanaka, T.; Tada, H.; Hashimoto, K.; Kominami, H. Bifunctionality of Rh3+ Modifier on TiO2 and Working Mechanism of Rh3+/TiO2 Photocatalyst under
(27) Emilio, C. A.; Litter, M. I.; Kunst, M.; Bouchard, M.; Colbeau-Justin, C. Phenol Photodegradation on Platinized-TiO2 Photocatalysts related to Charge-Carrier
Dynamics. Langmuir 2006, 22, 3606-3613.
(28) Zhao, R. Y.; Bi, Z. Z.;Dou, C. D.;Ma, W.; Han, Y. C.; Liu, J.; Wang, L. X. Polymer Electron Acceptors with Conjugated Side Chains for Improved Photovoltaic Performance. Macromolecules 2017, 50, 3171-3178.
(29) Yao, N. N.; Huang, J. Z.; Fu, K.; Deng, X. L.;Ding, M.; Zhang, S. W.; Xu, X. J.; Li, L. Reduced Interfacial Recombination in Dye-Sensitized Solar Cells assisted with NiO:Eu3+, Tb3+ coated TiO2 Film. Sci Rep 2016, 6, Artn 31123.
(30) Hasan, M. R.; Abd Hamid, S. B.; Basirun, W. J.; Chowdhury, Z. Z.; Kandjani, A. E.; Bhargava, S. K. Ga doped RGO-TiO2 Composite on an ITO Surface Electrode for
Investigation of Photoelectrocatalytic Activity under Visible Light Irradiation. New J
Chem 2015, 39, 369-376.
(31) Pan, L.; Zou, J. J.;Wang, S. B.; Liu, X. Y.; Zhang, X. W.; Wang, L. Morphology Evolution of TiO2 Facets and Vital Influences on Photocatalytic Activity. ACS Appl
Mater Inter 2012, 4, 1650-1655.
(32) Krimm, S.; Bandekar, J. Vibrational Spectroscopy and Conformation of Peptides, Polypeptides, and Proteins. Adv Protein Chem 1986, 38, 181-364.
(33) Silva, C. E.; Silva, L. P.; Edwards, H. G. M.; de Oliveira, L. F. C. Diffuse Reflection FTIR Spectral Database of Dyes and Pigments. Anal Bioanal Chem 2006, 386, 2183-2191.
(34) Solar Energy Conversion: Dynamics of Interfacial Electron and Excitation Transfer.
379 (Royal Society of Chemistry, 2013).
(35) Wang, G. M.; Wang, H. Y.; Ling, Y. C.; Tang, Y. C.; Yang, X. Y.; Fitzmorris, R. C.;Wang, C. C.; Zhang, J. Z.; Li, Y. Hydrogen-Treated TiO2 Nanowire Arrays for
Photoelectrochemical Water Splitting. Nano Lett 2011, 11, 3026-3033.
(36) Cui, H. L.; Zhao, W.; Yang, C. Y.; Yin, H.; Lin, T. Q.; Shan, Y. F.; Xie, Y.; Gu, H.; Huang, F. Q. Black TiO2 Nanotube Arrays for High-Efficiency Photoelectrochemical
Water-Splitting. J Mater Chem A 2014, 2, 8612-8616.
(37) Zhang, Q. X.; Guo, X. Z.; Huang, X. M.; Huang, S. Q.; Li, D. M.; Luo, Y. H.;Shen, Q.; Toyoda, T.; Meng, Q. B. Highly Efficient CdS/CdSe-Sensitized Solar Cells Controlled by the structural Properties of Compact Porous TiO2 Photoelectrodes. Phys
(38) Bisquert, J.; Zaban, A.; Greenshtein, M.; Mora-Sero, I. Determination of Rate Constants for Charge Transfer and the Distribution of Semiconductor and Electrolyte Electronic Energy Levels in Dye-Sensitized Solar Cells by Open-Circuit Photovoltage Decay Method. J Am Chem Soc 2004, 126, 13550-13559.
(39) Zaban, A.; Greenshtein, M.; Bisquert, J. Determination of the Electron Lifetime in Nanocrystalline Dye Solar Cells by Open-Circuit Voltage Decay Measurements.
Chemphyschem 2003, 4, 859-864.
(40) Tran, D. N.; Balkus, K. J. Perspective of Recent Progress in Immobilization of Enzymes. RSC Catal 2011, 1, 956-968.
(41) Ulusu, Y.; Dura, G.; Waller, H.; Benning, M. J.; Fulton, D. A.; Lakey, J. H.; Peters, D. T. Thermal stability and rheological properties of the ‘non-stick’ Caf1 biomaterial. Biomedical Materials 2017, 12(5), 051001.