Evaluation of Flexibility Capacity in Pediatric Overweight
Onur Oral1*, Mesut Cerit 2 and Murat Erdogan 3 1Ege University, Faculty of Sports Sciences, Izmir.
2Lokman Hekim University, Faculty of Sport Sciences, Sogutozü, 06510, Ankara, Turkey.
3Baskent University Faculty of Sports Sciences, Ankara, Turkey. *Corresponding author
ARTICLE INFORMATION Original Research Paper
Doi: 10.26655/IJAEP.2019.12.17 Received February. 2019 Accepted December. 2019 Keywords:
Body Mass Index flexibility overweight
ABSTRACT
Childhood is a severe threat to human health. There is a suggested relationship between overweight and physical fitness. The aim of the present study is to determine the association between overweight and flexibility in children. The sample consisted of individuals aged 10 and 12 ages. The sample includes of 105 students residing in Izmir. Body mass index (BMI) was calculated by using weight in kg unit and height in meter unit. Data analyzed by SPSS 11.0 package programs. Correlation and crosstabs analyses were also used in the research. It was determined that there was no relationship between body mass index values and the left and right flexibility values of the subjects. While obesity is linked to physical fitness in accordance with several studies and tests, the present study and previous studies state that flexibility and obesity have no meaningful association. Even though overweight constitutes physical difficulties for children, it does not cause a significant problem in terms of physical flexibility.
1. Introduction
Obesity is a prevalent health problem of today’s world. Obesity, which is proved to be a processor of several diseases, is a serious health problem that is on rise. Especially, obesity is very common in developed countries [1]. Moreover, childhood obesity, which is also prevalent in developed countries, constitutes an important threat to human health, too [2]. In the past years, the rate of people that take part in physical activities fell considerably and the number of people who prefer a sedentary lifestyle have increased. This recent lifestyle threatens public health severely because of its possibility to result in hypertension, obesity, muscle atrophy, cardiovascular disease [3,4,5].
The main cause of obesity is generally explained as energy intake being more than energy consumption. Inheritance is a common cause of obesity. As for other factors, imbalanced nutritional behaviours, lack of physical activity and sedentary lifestyle are the major influences [6].
There is a suggested relationship between obesity and physical fitness. Several studies in literature stated a significant association through physical tests and BMI calculations of test participants. Yet, flexibility is an exceptional factor. Sit and reach tests assess the level of flexibility and majority of studies suggest that there is no meaningful relation between BMI and flexibility.
146 1.1. Childhood Obesity
Along with obesity, childhood obesity is also a severe epidemic. The rates rose significantly in the past few decades. For instance, the number of obese children was nearly more than 42 million in 2010[2]. This increase is observed commonly in developed countries. In addition, studies in developing countries such as India also show similar results [5,6,7,8,9]. In short, childhood obesity can simply be defined as having excess body fat [2]. According to statement of The Center for Disease Control and Prevention, a person is overweight if there is the 95th percentile of BMI
(Body Mass Index). According to European researchers identification of overweight can be explained as the 85th
percentile of BMI and obese as the 95th percentile of BMI [10,11,12].
Sedentary lifestyle is considered as one of the major influences of obesity. For instance, according to some studies an additional hour spent in front of a television increases the risk of becoming obese by 2% [13]. This is an important percentage since the habit of watching television has become very common with children and teenagers [13,14]. The prevalence of these type of behaviours cause the tendency towards physical activity to decrease significantly [2]. Thus, the less physically active the person is in childhood, the more they lean towards a sedentary lifestyle in adulthood.
Childhood obesity may be triggered by several factors. In order to ensure a healthy development process, It is important for a child to have a physically active life. Therefore, participating in physical activities is a definite must for children. Findings suggest that exercising on a regular basis especially between the ages of 8 and 12 is very effective for avoiding the disease [15]. Nutritional factors are quite important for the prevention of obesity. When a person is surrounded by healthy food options, it is a positive influence on eating habits. Another factor, fast food, is frequently linked to obesity because of the inadequate nutritive values and high calories they contain. It is especially a common influencer for obesity because they fast food is easily accessible, attractive for children and considerably cheap [16]. The factor of snack food consumption is also examined as an obesity trigger yet there is no concrete evidence that proves the direct relationship [13]. Basal Metabolic Rate (BMR) is also suggested to play a role in the occurrence of obesity. BMR can be defined as the amount of energy body during rest. However, the literature doesn’t indicate a direct relation between BMR and obesity [13, 2].
1.2. Flexibility
Flexibility, being a significant element in terms of physical fitness, is influential in the avoidance of orthopaedic problems. Flexibility of all body parts including legs, lower back and shoulders is important for the prevention of musculoskeletal injuries. In the period of adolescence, the skeletal growth rate is higher than soft tissue growth and thus increases tightness. For instance, the feet and hands grow rapidly, then the calf, forearms, hips and chest, and the shoulders at last follow. Therefore, young people may experience having large hands and feet compared to the other parts of their bodies. Similarly, legs may have a higher growth rate compared to the trunk during the period between childhood and adolescence, resulting in having very long legs. This significant growth in skeletal system causes soft tissue to be tighter. The daily life habits also affect the muscles including hamstring. Hamstring is a muscle that is likely to experience this tightness in the period of adolescence [17]. Sedentary life style, spending too much time sitting in front of a television or desk cause the hamstring to stay shortened. In case the sedentary behaviours continue for a long period, the hamstring may adjust its current state [18].
2. Material and Methods
148 2.1. Data Collection Tools
Height measures of individuals were recorded by a height measuring scale in 1mm precision. Weights were recorded by an electronic weighing machine. Body mass index (BMI) was calculated by using weight in kg unit and height in meter unit. The following formula was used to calculate BMI. BMI (kg/ mt2) = Weight (kg) / Height2 (mt2).
Subjects were supine, the knees were twisted 90 degrees, the hands were on the nape and the soles of the feet were in contact with the ground, and the command was repeated for 30 seconds. The number of sit-ups they could repeat within 30 seconds was recorded. The left and right sit-up dimensions of the subjects were recorded with the sit and reach the device. Firstly, the students were able to extend their right feet to the instrument in the sitting position, and their left feet would get in contact with the ground bent over the knee. Then the students were asked to stretch their hands to the front. The best value is saved after this operation has been done twice. During flexing, attention was paid to the non-twisted state of the right knees of the students. The same procedure was performed in the left foot and the values were recorded. 2.2. Data Analysis
Data analyzed by SPSS 11.0 package programs. Correlation and crosstabs analyses were also used in the research. Correlation and some variables have been found to be related to each other (P < 0.05).
3. Results
Table 1 shows the participants' physical properties and measured test values. Table 1: Physical characteristics of the participants and measured test values
Variables N X SD Age (year) 105 11,47 0,889 Height (cm) 105 156,98 9,908 Weight (kg) 105 54,17 14,864 BMI (kg/m2) 105 22,5 3,527 Left Flexibility 105 18,74 6,458 Right Flexibility 105 19,18 5,896
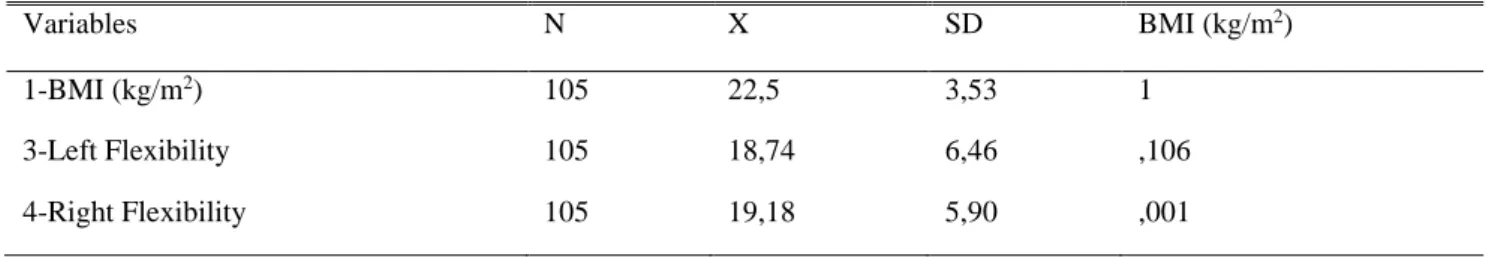
Table 2: Relation between measured test values of participants and BMI values
Variables N X SD BMI (kg/m2)
1-BMI (kg/m2) 105 22,5 3,53 1
3-Left Flexibility 105 18,74 6,46 ,106
4-Right Flexibility 105 19,18 5,90 ,001
** Correlation is significant at the 0.01 level
H0: There is no correlation between body mass index values and the left flexibility values of students. The significant value was greater than 0.05 (0.283 >0.05).In this case, the hypothesis H0 cannot be rejected. As a result of this analysis, it was determined that there was no relationship between body mass index values and left flexibility values of the subjects.
149 H0 hypothesis cannot be rejected. As a result of this analysis, there was no correlation between body mass index value and right flexibility values of the subjects.
Table 3: Distribution of BMI values according to age(Age * BMI Crosstabulation) BMI Total 18.5 and below 18.5-24.9 25.5-29.9 30-34.9 Age 10 9 15 3 1 28 12 6 57 12 2 77 Total 15 72 15 3 105
When we look at the table, it was observed that 15 of the students evaluated were in thin weight class. (Nine people out of fifteen people were ten years old and six were twelve years old.) It was observed that 72 of the students evaluated were in normal weight class. (Fifteen out of seventy-two people were ten years old and fifty seven were twelve years old.) It was observed that 15 of the students evaluated were in overweight class. (Three out of fifteen people were ten years old and twelve were twelve years old.) It was observed that 3 of the students evaluated were in first degree obese class. (One out of three people were ten years old and two were twelve years old) Finally there are no second degree obese and morbid obese individuals among 105 students.
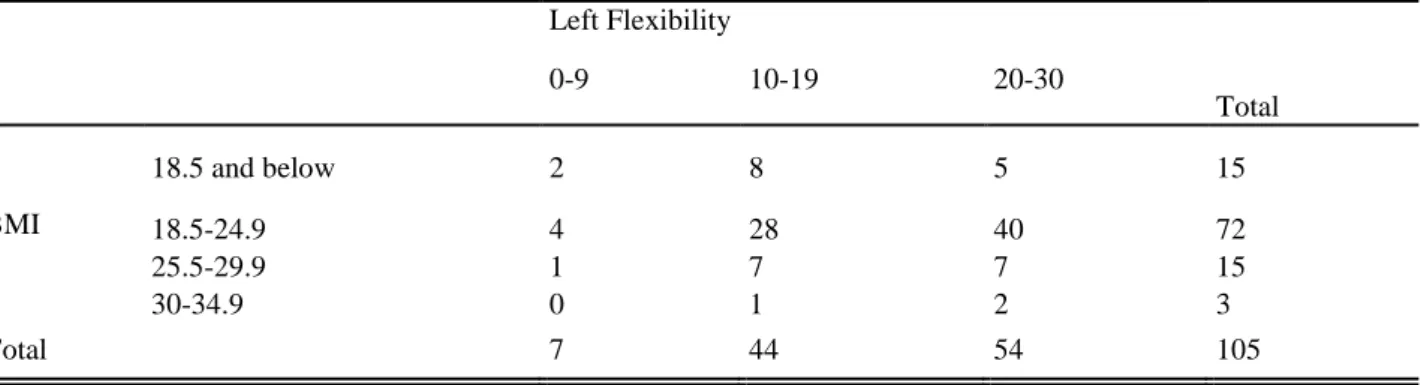
Table 4: Distribution of left flexibility values according to BMI values (BMI*Left Flexibility Test Crosstabulation) Left Flexibility Total 0-9 10-19 20-30 BMI 18.5 and below 2 8 5 15 18.5-24.9 4 28 40 72 25.5-29.9 1 7 7 15 30-34.9 0 1 2 3 Total 7 44 54 105
Of the 15 students whose body mass index was weak, 5 of them had normal left flexibility values, 40 of 72 students with normal body mass index had normal left resilience values, and 7 of the 15 students with body mass index had normal left flexibility values. 2 students out of 3 that had 1st degree obese BMI had normal left flexibility values. In total, 54 out of 105 subjects had normal left flexibility values.
Table 5: Distribution of right flexibility values according to BMI values ( BMI*Right Flexibility Test Crosstabulation)
Right Flexibility Total 0-9 10-19 20-30 BMI 18.5 and below 1 8 6 15 18.5-24.9 2 28 42 72 25.5-29.9 1 7 7 15 30-34.9 0 2 1 3 Total 4 45 56 105
150 Of the 15 students whose body mass index was weak, 6 of them had normal right flexibility, 72 of them had normal right flexibility, 42 of them had normal right flexibility, 15 of body weight index had normal right flexibility, 7 of them had normal right flexibility, and 1 student of 3 students with 1st degree obese BMI showed normal right flexibility values. In total, 56 of the 105 subjects had normal right flexibility values.
4. Discussion
The physical fitness and obesity relationship is studied in various researches. Yet, the studies fail to meet at an agreement in terms of defining the term “obesity”. This situation prevents the studies to meet at a common ground [19, 20]. According to The International Obesity Task Force (IOTF), the body mass index (BMI) is a reliable adiposity index and the organisation suggests the use of BMI for determining obesity in children and adolescents [20, 21, 22].
One study in Brasil, which aimed to determine a specified relationship between BMIs and growth charts of gender and age, 519 students between the ages of 7 and 15 were examined. The subject group consisted of both normal weight and overweight students. Various types of tests were conducted including the sit-and-reach test that assesses physical flexibility. In this test, students sit and outstretch their legs. In this process, it is essential to support the sole part of the feet with a box. The students stretch out in the direction of their feet with their hands, bending their trunk. The purpose is to determine the maximum distance the students can reach and estimate the level of flexibility. As the result, flexibility levels were found to be not dependent on BMI. This result matches the previous studies [23, 25]. However, the general result demonstrated that overweight students did not perform as well as normal weight students in the tests excluding the sit-and-reach test and medicine ball throw test [24]. The negative correlation between flexibility and obesity that was found in a study also matches the results of the study of Tokmakidis et al.(2006) The study was conducted on 709 Greek primary school students, consisting of 8.9±1.6 years mean age. While 59.4% of the subject group were normal weight students, 25.8% were overweight and 14.8% were obese students. 5 types of tests were applied to all participants, including the sit-and-reach test. While the tests indicated a significant relationship between BMI and fitness tests, flexibility was found to be independent from BMI. This result applied for both males and females [23]. The findings of the study that was conducted by Stanislaw et al. is consistent with the result of our present study. The study of Stanislaw et al. examined the relationship between obesity and physical fitness on Polish students from various ages. The results showed a negative relationship in general except for the sit and reach tests that assess the physical flexibility. In addition, a positive relationship was found between flexibility and body hip ratio. Similar results were found for each age group [24].
Fogelholm et al. (2008) examined the relation between BMI and physical fitness in 2266 adolescents of 15-16 ages. In total, 29.1% of the subject group was overweight, meaning they had a BMI over 85th percentile. Seven types of
tests were applied including the sit-and-reach test. Overweight was determined to be an influential factor in the tests excluding the sit-and-reach test. No significant link was found between flexibility and overweight [25].
In Mumbai, a research that consisted of 300 adolescents between the ages of 10 and 19 examined the BMI and hamstring flexibility relation. In the study, the link was determined to be quite insignificant [18].
5. Conclusion
While obesity is linked to physical fitness in accordance with several studies and tests, the present study and previous studies state that flexibility and obesity have no meaningful association. Even though overweight constitute physical difficulties for children, it does not cause a significant problem in terms of physical flexibility.
References
1. Popkin BM, Doak CM, The obesity epidemic is a worldwide phenomenon. NutrRev. 1998.56:106–14.[PubMed: 9584495].
151 J Family Med Prim Care. 2015,4(2): 187–192. di:10.4103/2249-4863.154628: 10.4103/2249-4863.154628.
3. Imamoglu O,. Acute effect of aerobic and anaerobic exercise on lipid levels, HealthMED – 2014.Volume 8 / Number 1 /, pp.112-118
4. Imamoglu O, Akyol P, Bayram L.The effects of a three monhts exercise on physical fitness, body composition and some blood parameters in sedanter middle aged women, 2002.7 st. International Congress of Sports Science, 27-29 October, pp.19.
5. Chhatwal J, Verma M, Riar SK, Obesity among pre-adolescent and adolescents of a developing country (India)Asia Pac J ClinNutr. 2004.13:231–5.[PubMed: 15331333]
6. Khadilkar VV, Khadilkar AV, Prevalence of obesity in affluent school boys in Pune. Indian Pediatr. 2004.41:857– 8.[PubMed: 15347879]
7. Laxmaiah A, Nagalla B, Vijayaraghavan K, Nair M, Factors affecting prevalence of overweight among 12 to 17 year old urban adolescents in Hyderabad, India. Obesity (Silver Spring) 2007. 15:1384–90.[PubMed: 17557974]. 8. Subramanyam V, R,J, Rafi M, Prevalence of overweight and obesity in affluent adolescent girls in Chennai in 1981
and 1998.Indian Pediatr. 2003.40:332–6.[PubMed: 12736406]
9. Panjikkaran ST, Kumari K, Augmenting BMI and Waist-Height Ratio for establishing more efficient obesity percentiles among school children.Indian J Community Med. 2009.34:135–9.[PMCID: PMC2731976][PubMed: 19714259].
10. Flegal KM, Wei R, Ogden C, Weight-for-stature compared with body mass index-for-age growth charts for the United States from the Centers for Disease Control and Prevention. Am J ClinNutr. 2002.75:761–6.[PubMed: 11916765].
11. Himes JH, Dietz WH, 1994. Guidelines for overweight in adolescent preventive services - recommendations from an expert committee. The Expert Committee on Clinical Guidelines for Overweight in Adolescent Preventive Services. Am J ClinNutr. 59:307–16. [PubMed: 8310979].
12. Ghosh A, Explaining overweight and obesity in children and adolescents of Asian Indian origin: The Calcutta childhood obesity study. Indian J Public Health. 2014.58:125–8.[PubMed: 24820988].
13. Anderson PM, Butcher KE, Childhood obesity: trends and potential causes. Future Child. 2006. 16:19–45.[PubMed: 16532657].
14. Kapil U, Bhadoria AS, Television viewing and overweight and obesity amongst children. [Last accessed on 2014 Jul 11]; Biomed J. 2014.37:337–8.Available from:http://biomedj.org/preprintarticle.asp?id = 125654. [PubMed: 25163497].
15. NSW Schools Physical Activity and Nutrition Survey (SPANS) 2006.
16. Niehoff V,. Childhood obesity: A call to action. Bariatric Nursing and Surgical Patient Care. 2009.4:17–23.
17. Harisson DD, Cailliet R, Janik TJ, Troyanovich SJ, Harrison DE, Hollard B,. Ellipical modelling of the saggital lumbar lordosis and segmental rotation angles as a method to discriminate between normal and low back. J Spinal Disord. 1998.11(5):430-9.
18. Arora A, Souza SD, Yardi S,. Association between Body Mass Index and Hamstring/Back Flexibility in Adolescent Subjects. International Journal of Science and Research (IJSR) ISSN (Online): 2013. 2319-7064.
19. Deforche B, Lefevre J, De Bourdeaudhuij I, Hills AP, DuquetW, Bouckaert J, Physical fitness and physical activity in obeseand nonobese Flemish youth. Obes Res 2003.11(3):434–441.
20. Malina RM, Beunen GP, Classens AL, Lefevre J, Vanden Eynde BV, Renson R, Vanreusel B, Simons J, Fatness and physical fitness of girls 7 to 17 years. Obes Res 1995. 3(3):221–231.
152 21. Bellizzi MC, Dietz WH, Workshop on childhood obesity: summary of the discussion. Am J Clin Nutr 1999.70:173–
175.
22. Cole TJ, Bellizzi C, Flegal KM, Dietz WH, Establishing a standard definition for child overweight and obesity worldwide: international survey. BMJ 2000.320(7244):1240–1253.
23. Tokmakidis SP, Kasambalis A, Christodoulos AD, Fitness levels of Greek primary schoolchildren in relationship to overweight and obesity. Eur J Pediatr. 2006.165(12):867–874.
24. Czyż SH, Toriola AL, Starościak W, Lewandowski M, Paul Y, Oyeyemi AL, Physical fitness, physical activity, sedentary behaviour, or diet-what are the correlates of obesity in polish school children?. Int J Environ Res Public Health. 2017.14(6):664. doi:10.3390/ijerph14060664.
25. Fogelholm M, Stigman S, Huisman T, Metsamuuronen J, Physical fitness in adolescents with normal weight and overweight. Scand J Med Sci Sports. 2008.18(2):162–170.
26. Dumith SC, Ramires VV, Souza MA, Moraes DS, Petry FG, Oliveira ES, Ramires SV, Hallal PC, Overweight/obesity and physical fitness among children and adolescents. J Phys Act Health. 2010.7(5):641-8.