YAŞAR UNIVERSITY
GRADUATE SCHOOL OF SOCIAL SCIENCES
BUSINESS ADMINISTRATION PROGRAMME
MASTER THESIS
BRANDING OF TEXTILE SECTOR IN TURKEY
AND ITS IMPACT ON
INTERNATIONAL RECOGNITION
ASLI YALÇIN
THESIS ADVISOR: ASSOC. PROF
. DR.
YÜCEL ÖZTÜRKOĞLU
ABSTRACT
Branding of Textile Sector in Turkey and Its Impact on
International Recognition
Aslı Yalçın
Master, Business Administration Advisor: Assoc. Prof. Yücel Öztürkoğlu
2017
Present global markets have been forcing all the participants including small medium enterprises, big size companies and others to have a major and continuous role by forwarding them to use internal or external resources to become more competitive one in case they intend to survive and be able to keep on their business in a growing purposed path, since there is no company who does not assume to be in line with any sustainable economic welfare which creates an open expressions that all the companies wish to maintain their business life as long as possible likewise human-beings. In order to exist in the competitive markets companies are being forced to find out all the business strategies for making and keeping them alive by setting their business based on vision and missions. Any basic economic theory would say that while resources are limited but need are limitless which is precisely same for the companies who would like to carry out a business with higher profit by incurring minimum cost as possible.
Market conditions are not easy to adopt not only for the early started business but also for the rest of enterprises in all sizes. Locally existed markets are giving up their past roles, shifting to become a global trade zone day by day, and wishing to welcome globally known companies all along with their all products with famous brands, since they gradually become weaker against global powers.
In this study, textile and clothing sector was reviewed in terms of branding and trading by analyzing the worldwide trade as well as Turkish markets with the help of macroeconomic statistics as well as annually prepared official reports of governmental foundations. Major features intended to be shown with the help of an applied SWOT analyses on Turkish textile and clothing sector.
As a conclusion of the study, even there has been a remarkable potential in the textile sector, realized outcomes shows that business in the action has been performing under its suitable level, and sector has not reached its desired place in local and international markets.
ÖZET
Aslı Yalçın
Yüksek Lisans, İşletme Bölümü Danışman: Doç. Dr. Yücel Öztürkoğlu
2017
Günümüz global piyasaları içinde bulundurduğu küçük, orta ve büyük ölçekleri şirketlerden oluşan tüm katılımcıları ve diğer birimleri iç ve dış kaynakları kullanarak daha rekabetçi olup verecekleri var olma mücadelesinde büyüme amaçlı bir yol izlemeleri için zorlamalaktadır, öyledir ki, hiçbir şirket sürdürülebilir ekonomik refah amaçlamadan var olma güdüsünde olmaz, şirketler insanoğlu gibi ömrü olan varlıklardır. Rekabetçi piyasalarda var olabilmeleri için, şirketler kendilerini bu yarışta tutacak stratejiler belirlemeleri, vizyon ve misyonlarına göre hayatta kalabilmeleri için zorlanmaktadırlar. Herhangi genl bir iktisat teorisinin de dile getirebileceği gibi,kaynaklar sınırlı ve ihtiyaçlar sınırsız iken şirketler karlarını maksimum seviyeye çıkarırken bu yolda katlanılan maliyetleri en düşük olası maliyet seviyesinde tutmayı amaçlarlar.
Piyasa koşulları ne yeni başlayan işletmeler ne de geride kalan her büyüklükteki girişimler için adapte olması çok zor bir haldedir. İç piyasalar, zamanla global marketlerin gücü karşısında zayıfladıkları için artık geçmişteki sınırlı rollerinden vazgeçmekte ve global bir ticaret sahasına dönüşmek için sıçramalar yapmakta ve günden güne uluslarası piyasalardan bilinen şirketleri ve de beraberlerinde ünlü markalı ürünlerini bünyelerine katmaktadır.
Bu çalışmada, tekstik ve giyim sektörü, makro ekonomik göstergeler ve hükümet organlarınca hazırlanan yıllık resmi raporların yardımıyla analiz edilerek incelenmiştir. Tekstil ve giyim sektörü SWOT analizi ilegenel özellikleriyle gösterilmeye çalışılmış ve analiz edilmiştir.
Sonuç olarak, Türkiye’de tekstil ve giyim sektöründe kaydadeğer bir potansiyel olmasına rağmen, sektör olması gerektiği seviyenin altında kalmakta ve henüz ulusal ve uluslarası piyasalarda olması gereken arzulanan yerine kavuşamamıştır.
ACKNOWLEDGEMENTS
I would like to thank my consultant Assoc. Prof. Yücel Öztürkoğlu for her guidance and patience during this study.
Aslı Yalçın İzmir, 2017
TABLE OF CONTENTS ABSTRACT i ÖZET……….ii ACKNOWLEDGEMENT...iii TEXT OF OATH...iv TABLE OF CONTENT...v LIST OF TABLES...vii LIST OF FIGURES...viii LIST OF ABBREVIATION...ix INTRODUCTION... 1. Chapter 1:Conceptual Framework of Brand……..………….………..2
1.1. The Brand………..……….………..……2
1.1.1. Definition of Brand………..…..2
1.1.2. The Role and Importance of Brand………..………..…....4
1.1.3. Types of Brand………..…...6
1.1.3.1 According to Product Variety………...…..…....6
1.1.3.2. According to Areas of Use ………. ………..7
1.1.4. Brand Elements….…….……….………...8 1.1.4.1 Name……….…………..………....9 1.1.4.2 Package………….…………..………9 1.1.4.3 Logos&Symbols….………..10 1.1.4.4 Slogans………..….………...11 1.1.4.5 Jingles……….………...11 1.1.4.6 Character………….………...11 1.2.Brand Equity………....………...12 1.3. Brand Strategy…………..………15
1.3.1. Manufacturer Brand Strategy.………...15
1.3.2. Private Branding Strategy..………….……….…...16
1.3.3. Mixed Branding Strategy……. …….………..…...16
1.3.4. Generic Branding Strategy ……...…...….………....16
2. Chapter 2: Brands and Textile Sector in International Market………….……...17
2.1. Textile and Clothing Trade History in International Markets...17
2.2. International Brands in Textile Sector …..………..…...25
3. Chapter 3: Brands and Textile Sector in Turkey………..………..28
3.1. Textile and Clothing Trade History in Turkey………...28
3.1.1. Textile and Clothing Export History in Turkey ……..……… ..…...28
3.1.2. Textile and Clothing Import History in Turkey …..………….…...31
3.2. International and National Brands in Textile Sector …..………... 35
4. Chapter 4: SWOT Analysis of Textile Sector in Turkey ………….………..38
4.1. Definition of SWOT Analysis...38
4.2. Application of SWOT Analyses of Textile and Clothing in Turkey…...39
CONCLUSION...………... 52
LIST OF TABLES
Table 1 : Difference in between Product and Brand……….3
Table 2 : Export In The World Trade-(1980-1990)………...……..18
Table 3 : Export In The World Trade (1990-2000)……….18
Table 4 : Trade Split for Textile in The World Economy………...19
Table 5 : Exports in Clothing and Textile (In million USD)………...20
Table 6 : Export Comparison in Clothing and Textile by EU and World………...23
Table 7 : Apparel World Wide Brand Ranking in 2016&2015………...26
Table 8 : Export in Textile and Clothing (1980-1990)………28
Table 9 : Export in Textile and Clothing (1991-2000)………...29
Table 10 : Export in Textile and Clothing (2001-2009)………30
Table 11 : Export in Textile and Clothing (2010-2015)………31
Table 12 : Import in Textile and Clothing (1980-1990)………32
Table 13 : Import in Textile and Clothing (1991-2000)………32
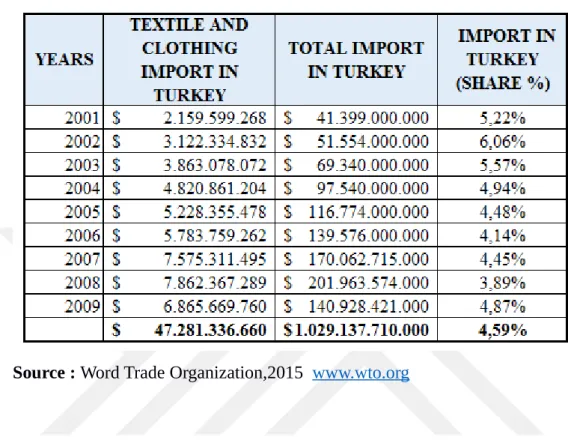
Table 14 : Import in Textile and Clothing (2001-2009)………33
Table 15 : Import in Textile and Clothing (2010-2015)………33
Table 16 : Brand Ranking in Turkey (2016-2015)………35
Table 17 : Top 20' Business Field……….36
Table 18 : Top 20' Brand Sectoral Share………..36
Table 19 : Clothing and Textile Brand Ranking in Turkey (2016-2015)………..37
Table 20 : SWOT Analyses………...38
Table 21 : SWOT Analyses of Textile and Clothing in Turkey-STRENGTHS……….39
Table 22 : Workforce in Turkey………....40
Table 23 : Number of Insured Person to Social Security System in Production of Textile and Clothing……….42
Table 24 : Number of Business/Work Places in Textile/Clothing Production…………..41
Table 25 : Foreign Trade Deficit and Surplus in Turkey 1980-2000………....42
Table 26 : Foreign Trade Deficit and Surplus in Turkey 2001-2015………42
Table 27 : Clothing Exports in 2014&2015 ( Thousand USD)……….43
Table 28 : Clothing Import in 2014&2015 (Thousand USD)……… 44 Table 29 : SWOT Analyses of Textile and Clothing in Turkey-WEAKNESSES……… 45 Table 30 : Distribution of Trademark Applications with Respect to Countries That Applied to Turkish Patent Institute ( %Changes by Previous Year) ………...46
Table 31 :
Central Bank of Turkey, FX Buying Rates……… 46
Table 32 :
SWOT Analyses of Textile and Clothing in Turkey-OPPORTUNITIES…… 47
Table 33 :
Distribution of Trademark Applications with Respect to Countries That
Applied to Turkish Patent
Institute………48
Table 34 : Trademark Application Counts Based on Cities in Turkey (2014, top 10)…..49 Table 35 : Application Numbers in Years-Istanbul………...49 Table 36 :
Application Numbers in Years-Izmir……… 50
Table 37 : Application Numbers in Years-Ankara………50 Table 38 : SWOT Analyses of Textile and Clothing in Turkey-THREATS………51
LIST OF FIGURES
Figure 1: Relation in Between Consumer& Companies and Role of Brand……….5
Figure 2 : Elements of Brand………...9
Figure 3 : Aaker’s Brand Equity Model………...13
Figure 4 : Brand Association Map………...14
Figure 5 : Economies of Scale………...15
Figure 6 : Textile and Clothing Trade Trend in The World Between 1980-2000….19 Figure 7 : 2015- World Export Ranking………...……….25
LIST OF ABBREVIATIONS
AMA :American Marketing Association
CU :Custom Union EU : European Union
SME :Small Medium Enterprises TARİŞ :Tarım Satış Kooperatifler Birliği TP :Turkish Patent and Trademark Office TSE :Turkish Standards Institution
TUIK :Turkish Statistical Institute
INTRODUCTION
Globalization has been enlarging its limitless and visible growing as effective 80’s on wards around the world. This penetration has been happening in contribution to each participant existed in the economies. Globalization always carry the competitiveness with itself by forcing those participations no matter how their size, power or volume of their possible additional values could be, in order to become a player in the markets, each participants have to figure out the way of surviving by using internal or external resources, since there is no company who does not assume to be in line with any sustainable economic welfare which creates an open expressions that all the companies wish to maintain their business life as long as possible likewise human-beings
In order to exist in the competitive global markets companies are being forced to find out all the business strategies for making and keeping them alive by setting their business based on vision and missions. Any basic economic theory would say that while resources are limited but need are limitless which is precisely same for the companies who would like to carry out a business with higher profit by incurring minimum cost as possible.
Market conditions are not easy to adopt not only for the early started business but also for the rest of enterprises in all sizes. Locally existed markets are giving up their past roles and shifting to become a global trade zone day by day and wishing to welcome globally known companies all along with their all products with famous brands, since they gradually become weaker against global powers.
This thesis study is organized to be presented as follows. After the introduction, first chapter will cover the conceptual frame of brand by including some literature review as well as supported real life examples. Following chapter one and two review how brands and textile and clothing sector is in international and in Turkey. Next chapter four, a SWOT analyses will be applied in order to illustrate how the situation is in Turkey in terms of textile and clothing sector by using statistics and brief recommendations.
CHAPTER 1. CONCEPTUAL FRAMEWORK OF BRAND
1.1. Brand
1.1.1 Definition of Brand
Brand as a word were explained in the literature or practice by many different definitions. Brand is a tool that makes a product alive like a real person and let the product travel among countries, cities or households with its passport and existence. In today’s world, there is almost no household or an individual left who is not aware what a brand is. Brand with its basic definition is any specific characteristics that gives a meaning to a product to be capable of distinguishing itself from the rest of others.
Brands can be an image, symbol, name, color, shape, design, term or any other specific feature to let the product be known in the markets. Brand is the name or symbol that aims at representing the product or service to consumers (Tokol, 1994:94)
Brand is a name, symbol, shape or harmony of them which defines the identity of a product or service (Cemalcılar, 1994:116)
There is another definition in of the brand in literature as “Brand is the guarantee of promise or quality among interrelated relations (Perry, 2014:12)
American Marketing Association (AMA) has defined brand as “brand is a name, term, sign, symbol, design or a combination of them intended to identify the goods or services of one seller or a group of sellers and to differentiate them from those of competition”1
In the past, needs were in first place before making a buying decision for consumer who were tending to make a purchase if or when they need it. However, in time, there has been a slightly change in this buying process since the consumer of the day is tending to make a purchase even if they do not need it. Brand is a concept that has been gaining power for past years and affecting the consumer decision, because of the fact that consumer persuades owning a product, which is known in the
1The American Marketing Association, one of the largest professional associations for marketers, has 38,000 members worldwide in every area of marketing. For over six
public, it can give them a higher social statue in society. In other words, as described in the literature “consumers choose the brand that they believe to fulfill their needs with it. Hence, today’ consumer, apart from their current needs to be satisfied, they expect to be respectable, belong to a group, develop themselves etc. Parallel to this fact, they would like to show their personal values, life styles, interests, economic power with the brand they choose. (Kapfeerer, 1992)
As another definition, the characteristic feature of a brand is the additional values to various physiologic needs to functional needs of a consumer (Hamish and Marjorie,2000) which directly affects the consumer who would end the buying process by focusing on the best match depending on his/her needs. Attention is to be drawn at this point that consumer would be buying the branded product not only his/her natural or physical needs but also physiologic mood in the process of purchase. Thanks to this harmony, consumer would be ready to pay a price maybe more than what the needs could/should be, because of the brand power (Keller, 2003:207)
“A product is something made in the factory; a brand is something the customer buys. A product can be copied or imitated by a competitor; a brand is unique. A product can be outdated; a successful brand is timeless.”
− Stephen King (WPP Group, London)
Brand is a supporting instrument that prevent the company from external competitive threats as it gradually gains powers. (Uztuğ,2003 :21)
Brand is way beyond the product, because of the facts placed in the summary table below (Aktuğlu,2004:15)
TABLE 1: Difference in Between Product and Brand
Product Brand
Required to produce in a facility Has to be created/generated Fulfil the basic needs of consumer Gives a statue in society
Similar Has identity, Unique
Can be copied, multiplied (Easier) Under protection by law, harder tocopy or multiply without a prior process
Pricing is easier to define comparing incurred cost and market conditions& competition
Price range cannot be easily defined comparing the incurred cost. Brand can be in first place than a market price such as luxury cars, when production cost is compared sales price, the gap in between is the profit thanks to brand power.
Has no natural features to make itself distinguish from other products
Has certain features to be distinguished (Name, Logo, Shape, Design etc)
Awareness are not vital to be chosen for a product.
Creates the awareness of what is consumed, sometimes can be remembered rather than a product. A person who asks for Cola most probably is asking Coca-Cola.
1.1.2. The Role and Importance of Brand
Globalization has been making not only international but also local markets to become more and more competitive and creating extra pressure on each participants including entrepreneurs, SME (Small Medium Enterprise), companies to be able to exist with their own products. Each participant in the markets has one mutual goal, that is for sure, ‘’existing’’. In order to exist, all the participants started to aim at prolonging their existence by maximizing their welfare, earning, profits in the meantime minimizing the incurred cost. Brand is right at this point has a crucial role for all the participants to be able to survive for longer periods by enabling them to be different from other their rivals. There is one another crucial participant in the markets called ‘’The Consumer’’ who actually defines what a brand really means by owning it with a paid price. In the eyes of consumers, brand can be illustrated to an address, since when the address is known, way can be found. The frame is exactly same for consumers, when the product brand is known like an address, it can be
to find and buy it in today ‘world for consumers who have also been adopting itself to the markets.
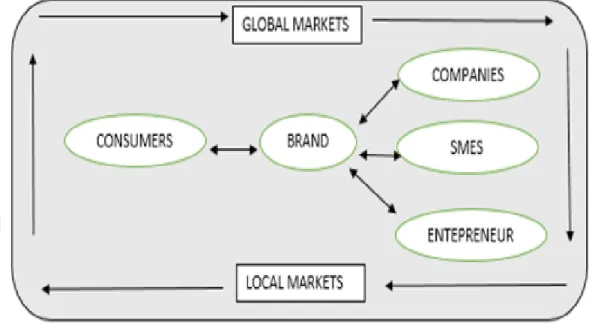
Figure 1: Relation in Between Consumer & Companies and Role of the Brand
In the figure above, it can be seen that brand has an interim role in the market environment and stands in between of all participants. Global markets are expanding itself to other potential environment by actually establishing its own unique place with two possible ways; one is global market are a replacement with local markets in the way of making them global or as a second way is destroying them permanently and create a new global market instead, the flow can be also considered in the other way around from local markets to global ones, since consumers’ needs are enlarging everyday where local markets are not being easily supplying what consumers are demanding and naturally in time the changes start to be in place to become more demanding markets by welcoming global standards.
Brand plays crucial role in the eyes of each player in the market. Any consumer upon buying a branded product would easily expect he/she is actually buying a priority including the belief in quality, trust feelings, after sales services in case of product related problems etc. A known brand with these features would be in a better position to be chosen by the consumer. In the eyes of companies, entities, SME’s, entrepreneur or shortly all the produces, having branded products would create permanent space in the market for their business to prolong the existence, protect the current and potential volume of transaction in the business, because brand
a power called brand loyalty. Thanks to brand loyalty, all the producers can continue to produce their branded product in better sales environment.
1.1.3. Types of Brands
There are two main brand types can be mentioned in this study that is depending on product variety and areas of use where product variety has its own split into two as commodity brands and service brands. The other, areas of use has three categories and consists of in order individual brands, guarantee brands and collective brands.
1.1.3.1. Brands According to Product Variety
Products under this category can be categorized as commodity brands or service brands.
Commodity brands are products (goods) being produced at factories or similar facilities and then being sold by those factories such as Arçelik, Vestel, since both company produce their products within their brand family and sell from their factories to local or foreign markets. Remembering the fact that, brands would make product to differentiate it from the other, so same principle applies, that is, when any product in factory would carry a brand that would make that product unique. Commodity brands are known as Trade brands as well. Trade brands can be registered to trade registry to enable having legal protection by the law and regulations. Trade brands are the products belongs to a company where it is produced and/or sold that could enable to differentiate the product from the others. (Özer,2002:32)
On the other hand, service brands are as it is understood by its definition where services are produced and delivered to final users like travel agencies such as carrier companies, hotels, tourism agencies, hospitals as company examples, Lufthansa, Expedia, Hilton, Florence Nightingale etc. Service brands are the signs those differentiates the services from one provider to other. (Yosmanoğlu, 1978:110).As mentioned, hotels, agencies, advertising companies, banks, insurance companies are selling the services rather than the goods as their products. Therefore, when this services connect with the brand, that is accepted as service brands. (Deryal,2003:75).
1.1.3.2. Brands According to Areas of Use
According to areas of use can be divided into three categories in order individual brands, guarantee brands and collective-brands.
Individual brands: are the goods or services belongs to a producer or a company along with their rights those are reserved to only those related producers or companies. Individual brands can be concluded as these examples; Kinder, Algida, Gucci are related to individual commodity brands while HSBC, UPS, Marriot are related to services.
Individual brands no matter if it belongs to a real person or a corporate ensures right of usage the brand to its owner (Özer,2002:32)
Thanks to the advantages of individual brands, owner of individual brands can penetrate different markets with different brand names under the same roof company. However, this penetration can create interim competitive in between the own products of the company. Therefore, a harmony in order to balance the operation is essential. (Çiftçi and Cop,2007:74)
Guarantee Brands: This type of brands is still being produced by companies under certain regulation, standards as well as rules to enable brands are with certain level of quality, healthy and useful. ISO (International Organization for Standardization) can be an example for this type of brands. ISO as organization publishes the packages of standards those are supposed to be on the products as well as services. Another example for this type can be TSE (Turkish Standards Institution) stands for ensuring standards to be applied on goods and services.
Other example in private sector or industry can be given from Kitkat is the chocolate brand of Nestle. In this example, Nestle plays a guarantee brand role since Kitkat is under Nestle guarantee. (Randall,2005:22).
Guarantee brands are the signs that enables a lot of companies to keep way of production and quality under the supervision of owner of the brand (Çamlıbel, 2001:38)
Collective brands are the foundations those are established to make similar products keep under one single roof by aiming at creating a network to make products sell by taking into consideration all participant benefits are under the control as well as supervision of these foundations such as TARİŞ where olive related products were included to be sold to consumers.
In collective brands, it is essential that all participant’s products are the brands of owner of the collective foundation. In example of TARİŞ who pretends like the single brand by holding the rights of use of participant products those were already differentiated by joining the network of TARİŞ.
Collective brands ensure the products & services within the group to differentiate from other companies’ good & services. (Karahan,1996:29-30).
Collective brand is indicator that helps the products of services belongs to the group that can be consisting of producers, service providers or trading companies to differentiate the collective brand to be different from the others.(Özer,2002:34)
1.1.4. Brand Elements
Elements are the main features of any brand to make them the brand. Those elements can be any main characteristic to make brand distinguish from the others, therefore, it can be count as name, package, logos and symbols, slogans, jingles, character. Benefits of elements can be useful for a brand as followings:
Make easier to be remembered Enable a brand re-buy again
Create a place in consumer minds and desires Build a trusted zone in market place
Play a crucial role in consumers’ life Make brand keep closeable
Figure 2: Elements of Brand
Elements can be summarized in the chart above where it can be understood that a brand is a consist of minimum one element, or a harmony depending on the branding of a product.
1.1.4.1. Name
Name is a must in brand existence. Without a name, there is no consumer who could define a basic specification of any product with its brand. Therefore, name has a crucial importance in the brand concept since other elements can be changed in time or depending on demand, market conditions and other factors meanwhile name can’t. Maybe, there can be some in real life examples where names are changed. A good example at this point can be meaning of the name, imagine a global brand in automotive sector from Mitsubishi where they named their one of car as Pajero in Spain, where pajero as a meaning masturbation. That is why, when defining a name, a lot criteria are place in such as culture type of a society, needs, suitable in market area of that country, meet with demand, easy to be pronounced or remembered etc. For example, name should be easily said by a French consumer as well as Indian ones.
1.1.4.2. Package
The other important element is the packaging of the products, since when a packaging done, in the eyes of consumer, that package would be actually making the product with the brand, because it will be chosen by knowing and remembering thanks to its package. It would be first thing to be remembered when the brand is
mentioned, such as Toblerone, when hearing this brand, any consumer would actually remember its package.
Packages are the seen part of the products, therefore, they are really crucial for brands, has to be attractive, catchy and be able to draw consumer attention to the product with their out looking.
1.1.4.3. Logos & Symbols
A logo is a means of creating an instant, distinctive presence that can separate a brand from the competition, and allow it to develop language of its own (Vaid,2003:29). Logos are by far the most powerful and familiar visual expressions of brand. Logos denote the business visually; link brands with their historical predecessors(Vaid,2003:58) Logos do not have to be based on products, it can be fixed in the beginning and apply to each products to let consumer see who has own those products in the origin. Thus, logos can be the visual face that represents the owner (company, entity etc).A consumer who choses that brand with its logo is actually aware of the responsible by recognizing its logo. Logo below can be given as an example of first acknowledgement in consumer minds, there is no need to take place further information to show this logo is related to Dominos, the company which is in fast food sector.
Another examples can be from textile sector were shown below, in same order from left to right: Lacoste, Giorgio Armani, Adidas Classic and Adidas. Adidas group has been intending to protect their brand logo and its culture by keeping classic
logo alive but also applying in their other designs and representing it them with new logo. Any consumer who would shorty have a look at logos below, can have a quick information about what they are and in which sector they do their business.
1.1.4.4. Slogans
In today advertisements, it can be realized that in TV’s, radio or magazines, brands are using special slogans to make consumer remember even though when they are not doing shopping. Slogans are strong tool for any brand, since they will create their own space in consumer minds, even consumers do not tend to remember, and subconsciously they do. Because, it is in slogan nature to be existed.
Slogans are mostly carrying the specific part, feature, essential information (price, fashion, consumption tendency etc.) or a message to be delivered to final user such as Just do It by Nike which the company is calling everybody by not only addressing to special sport man but also addressing to everybody who could be interested in not Nike but the sport. It is general slogan, brand name is in the back stage but the message is purely clear and strong.
1.1.4.5. Jingles
Jingles are musical definition and very strong brand elements and another communicative messenger of the brands. With the help of flowing harmony of musical expressions, intended messages can be delivered to consumers. Jingles can be a question, order, directory as well as easy to remember, enjoyable, catchy to draw consumer attention on the products. For example, nowadays, many consumer can easily remember Turkish Airlines as “Turkish Airlines, Globally Yours”. Jingles are important because, they can communicate brand benefits, they are relating wit brand associations and they help creating brand awareness. (Keller,2003:210)
1.1.4.6. Characters
Characters stands for the brands to represent and can be as symbols, special style, animal shaped, human or a thing. For example, M&M company’ mascot or as a statue for McDonald’s as shown below in pictures.
Furthermore, characters are the information pool and illustrated to products, relevancy can be in colors, logos, product shape etc. When the brand has a character, the ability of consumers to have a relationship with a brand can be easier. (Keller,2003:199).
In conclusion, all the brand elements have different, major and crucial importance to make brand more attractive, chosen, exist in the market place, and let consumer know the existence of those products by highlighting the features, characteristics of the products in the eyes of consumer to enable consumer be aware of the brand with its powerful perception.
1.2. Brand Equity
Brand equity stands for the value created for goods and services by the brand. The value premium that a company realizes from a product with a recognizable name as compared to its generic equivalent. This term was further elaborated as brand equity is a set of assets (and liabilities) linked to a brand’s name and symbol that adds to (or subtracts from) the value provided by a product or service to a firm or that firm’s customers (Kotler and Keller,2012:25)
Brand equity is the sum that contains perceived form, financial performance, customer loyalty and satisfaction, respect to the product. (Knapp,2000:3)
By another definition in terms of economics that brand equity is the brand power than enables demand curve upward for a product belongs to goods & services. (VanAuken,2003:6)
In order to add any additional value to goods or services, there has to be some essential components those can be illustrated as defined in Aaker’s2 brand equity model in order:
Brand loyalty Brand awareness Perceived quality Brand associations Other proprietary assets
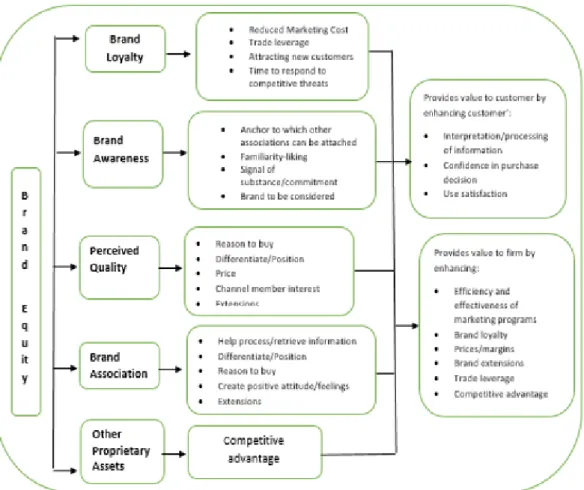
Figure 3: Aaker’s Brand Equity Model
In the view of Aaker, as shown in the Figure 3 above, brand loyalty is the first component that indicates the importance of brand equity, since any loyal consumer would definitely be easier to be reached and remain as the main target in the eyes of brand owners. It would be definitely harder to make brand expand among new potential consumers, therefore, consumes by being royal do a favor to keep marketing cost on themselves lower than the new potential ones. Company who has loyal consumers are able to manage easier their trading volume, since they do know their power in the market and volume of consumption thanks to royal consumers. Furthermore, the more loyalty would draw new potential customer’s attention, thanks to brand loyalty, companies can present their brands without struggling more than required on marketing, because their loyal customer would do this job on behalf of companies by spreading the usage of that brand in the market and they do attract their piers to use the same brand. Brand loyalty would also enable any company have stronger position in market against threats. Markets are global and quite enough competitive for all participants, hence, owing to loyal consumers, companies can take the advantage of taking the first solid step against all difficulties, competiveness, marketing barriers, economic crises all along with their valuable royal power.
What Aaker stands for brand awareness is not far away of mutual understanding in other marketing theories. Brand awareness is the level of “triteness” of the brand in the market. Brand awareness is not an easy component to build for
any company which requires to include certain conditions such as a strength of brand name and all other brand elements those were mentioned before in this study are the basic principles of awareness since they do have direct influence on brand to be known by consumers and awareness is directly correlated with these elements in a positive way. Likewise, brand loyalty, brand awareness is stronger with the users of the brand because they do spread mouth to mouth or similar unconscious advertising methodologies on their own. Brand awareness is one of the strongest component of the brand equity because consumer who is aware what he/she is buying is natural goal of the brand owner. That is, awareness makes the branded product to be considered or purchased or at least placed in the list of options in consumer minds. Figure 4: Brand Association Map
Source:http://www.marketoloji.com/?p=3413
Brand associations can be expressed by an example in relation to Nike brand that is shown in the Figure 4 above where brand in middle is considered the key information for consumers. Upon realizing this brand name, any consumer would easily recall main information related to Nike such as it is a Sport brand that has categories in shoes, equipment, sport wear etc., When the recalling starts, consumer also recalls it is competitors, prices, which sport that Nike is placing in. In this information flow, consumer also intends to recognize the brand power with plusses and minuses, that is, they do evaluate in their minds. This process can be expressed how brand association works. In the figure 4 above, Aaker has the quite similar expressions in his model, in other words, consumers with the help of brand association do tend to choose the branded product they desire to purchase. As a last component that Aaker has mentioned in his model is other proprietary assets by means of patent, intellectual property rights etc. (Aaker,1991)As whole components’
1.3. Brand Strategy
In present competitive markets, branded products are necessary to let the company maintain a more successful business, and thanks to them, companies can differentiate themselves from the other competitors which can be happening with the help of strategic plans to let branded products extent their extinctions. Strategies are prepared, provided and applied by the management of the companies. Therefore, strategies play a vital role to define a destiny path for brands as well as requires a strong management. Strategies are helpful for companies to keep them in the competitive market condition for longer period in a more solid path. In this part of the study, main strategies were mentioned to present the importance of strategies in branding with theoretical background.
1.3.1. Manufacturer Brand Strategy
Manufacturer brands are the branded goods those are linked to its own manufacturer. Therefore, targeted customer’ attention is focused not only for single product but also other branded products of the owner. In this regard, strategies play an important role to make this happen, since companies can produce more than one type of product at the same time, that can be called as multiple branding or multi-branding. Manufacturer branding strategy can be a cost-efficient strategy, because of the fact that the production level might be high, the more a company intend to produce, the less cost that company would incur as the production volume gets higher while the producing per unit cost gets lower. Figure 5 was given below to show how the economies of scale works and gives an advantage of the companies. Figure 5: Economies of Scale
1.3.2. Private Branding Strategy
Private branding stands for the branding strategy on purchased products from manufacturers/producers that is applied by retailer or wholesaler. Thus, private brand owners have the advantage of keep away from production cost by focusing on their core responsibility, which ensures those purchased products to be delivered to final users from retailer/ wholesaler hands with their own brand names.
1.3.3. Mixed Branding Strategy
This strategy is the combination of manufacturer and private branding strategies at one. Manufacturer is the same but marketing segments are different in this strategy, that is with an example, company A produces the products and deliver to retailer/wholesaler to be reached to final users who are not in same segments such as level of income, consumption of luxury goods etc. From textile sector, as an example of Inditex that owns Zara, Pull&Bear, Massimo Dutti, Bershka, Oysho, Zara Home brands, as it can be realized that such as Massimo Dutti tend to address higher level of income customers while Pull&Bear address the young generation with middle income generation or else, Zara Home tends to target home textile under the roof of Inditex.
1.3.4. Generic Branding Strategy
This strategy enables companies to take a further step with their branded product, which became a very well-known name that is already replaced with product name. By a better definition, brand name is one-step ahead of product itself. For instance, when any consumer hears the brand of Vespa, easily recall mentioned product is actually a motorbike, but it is motorbike model name or brand belongs to Piaggio & Co S.P.A. Therefore, for the open market which is less competitive than global ones, if any entity would take the advantage of penetrating first would also be able to spread its brand to make it generic one in the near future, since it will be known better and better as it is consumed in society of that market. Having a generic brand would create many advantages for its owner such as cost effective, loyalty, continuous consumption, strong positioning in the market.
CHAPTER 2. BRANDS AND TEXTILE SECTOR IN
INTERNATIONAL MARKETS
Textile sector has been playing important role in the international markets with the help of globalization that enables capital power to move easier and quicker by resisting less than how it was before among continents, overseas countries and around the world. After the period of 80’s, economic theories were started to be applied in consideration of open economic models. That is, countries would go and reduce the barrier of trading entries for their economics for foreign investors and this would enable those countries to welcome external capital mobility to their economies to create additional values and increase the welfare. Open economy would start to trigger global economic models starting in 80s. In these past almost 40 years, it can be seen almost every country in the world, markets have been becoming competitive markets. Actually, there has been a power shift from governmental regulations to global companies. Since, in perfect competitive markets, decision makers are the market itself, and government intervention are straightly limited. All the market prices, fashion, technology, production& consumption level, types of them have a back stage hero -companies. Powerful economies created powerful companies, in order to economically grow, likewise countries, companies needed to expand their limits to worldwide levels. In order to survive, companies needed to have strategy to see where they are going, intend to keep business under control with having strong management, they have set the targets, vision &missions to keep on.
In this part of this study, one of the important factor of each economics that is textile would be the focusing point with the help of some important macro-economic indicators related to textile sector in summary tables on international wise.
2.1. Textile and Clothing Trade History in International
Markets
With the help major radical changes in the economic history of the world during 80’s, world economies needed to create the representatives called companies where the production of theirs started to differentiate and present as branded goods and services. Actually, big sized companies started to take over the roles of governments, by acting as major power of economics. In short, international companies became more and more important in last 40 years, after their products could start too mobile internationally thanks to globalization. Thus, the early visible effects of globalization were placed in early stages of 80’s in the world.
This part of study will give a place for economic changes in a very brief way after the period of 80’s with the help of some macroeconomic statistics for the understanding of close history in world trade. As mentioned before, 80s was the visible milestone of world trade where open economic policies implemented in world economics, which would enable those economies to feed the rest of the world with their products.
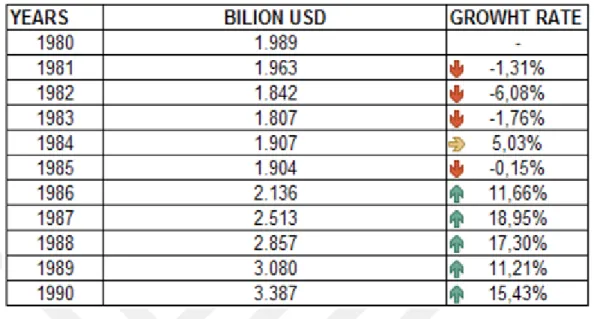
Table 2: Export in World Trade (1980-1990)
Source : Word Trade Organization,2015, www.wto.org
The table above is actually the picture of volume increase in the world trade as export with the help of applied open economic models and policies in the world economies. After a couple of years of adoption, the real effects can be seen as visible in numbers starting from 1984 onwards, where the growth trend is quite certain.
After the period of 90s, there was a continuous change in world trade, which could be considered a stable open economic trade what was on during those 10 years as well. Growth rates were calculated from previous year and shown below in table as well.
In these 20 years, textile and clothing sector was following the trend of trade by adopting itself very quickly to worldwide trade trends which can be seen in the table below while world economies took their first steps to globalization, textile and clothing sector was following these steps in the back stage. The total trade in 1980 was 96 Billion USD and started to increase with open economic actions that resulted as 121 % according to 1980.
Table 3: Export in The Word Trade (1990-2000)
Source : Word Trade Organization,2015, www.wto.org
On the other hand, having a look at each 5 years’ changes, in totals, continues increment can be measured in textile and clothing trade for each of them which is in order 1985 was larger than 1980 by 10 %, 1990 was larger than 1995by 101% which was the biggest jump in trend line of world textile and clothing trade volume. In addition to this, 1995 continued to grow comparing to 1990 by 45 % and last phase of that era 2000 grew 16 % than 1995.
Table 4 : Trade Split for Textile in The World Economy
Source : Word Trade Organization,2015, www.wto.org *Billion USD
Figure 6 is consisting of billion USD in vertical line and years in the horizontal line to demonstrate the growing path of textile and clothing sector in between 1980-2000 where color light blue is 1980, orange is 1985, grey is 1990, yellow is 1995 and lastly darker blue is for 2000. Having a look at textile for that 20 years performance, especially after 1985 until the year of 2000, had a slight growing line likewise ready to wear clothing sector trade and in total had shown a straight linear growth line for each 5 years values.
After the picture of exporting in textile and clothing in chosen country, bases can be shown in Table 5:
In the table 5 , exportation of textile and clothing can be seen in numbers of million USD where the further information can be produced from the above mentioned table in share of trade as percentages for 2014 and 2015.
Table 5 : Exports in Textile and Clothing (In million USD) COUNTRY 2000 2001 2002 2003 2004 2005 Australia 543 484 458 524 539 535 Austria 3.026 2.993 3.093 3.784 4.405 4.643 Bangladesh 5.460 5.238 5.314 6.067 6.892 7.595 Belgium 10.251 10.285 10.893 12.467 13.905 14.178 Brazil 1.177 1.136 1.066 1.412 1.610 1.695 Bulgaria 826 1.052 1.268 1.744 2.063 2.048 Canada 4.281 4.105 4.170 4.229 4.424 4.325 China 52.206 53.475 61.863 78.961 95.284 115.213 Chinese Taipei 14.906 12.369 11.718 11.405 11.989 11.267 Colombia 788 836 729 866 1.187 1.264 Croatia 556 577 593 705 749 677 Czech Republic 1.858 1.976 2.018 2.374 3.035 3.360 Denmark 2.644 2.657 2.829 3.332 3.682 3.880 Egypt 724 526 457 511 505 456 Finland 542 536 573 645 688 580 France 12.078 11.747 12.270 14.251 15.395 15.495 Germany 18.171 17.991 19.212 22.417 25.916 25.972 Greece 2.001 1.927 1.858 2.408 2.515 2.252
Hong Kong, China 37.656 35.659 34.851 36.245 39.393 41.122
Hungary 1.599 1.737 1.749 2.006 2.133 1.905 India 11.558 11.010 11.646 12.750 14.332 17.070 Indonesia 8.239 7.733 6.784 6.973 7.246 8.312 Iran 890 836 909 1.029 955 946 Israel 1.219 1.135 1.086 1.091 1.208 1.193 Italy 25.424 26.385 26.773 30.431 33.588 33.489 Japan 7.528 6.650 6.488 6.917 7.723 7.374 Korea 17.737 15.246 14.908 14.420 14.230 12.972 Macao, China 2.115 1.940 1.974 2.137 2.265 1.928 Malaysia 3.526 3.126 2.993 3.073 3.568 3.834 Mexico 11.202 10.102 9.961 9.406 9.561 9.444 Netherlands 5.425 5.438 6.105 7.367 9.084 8.792 Norway 232 238 258 265 294 304 Pakistan 6.676 6.662 7.019 8.521 9.150 10.691 Philippines 2.833 2.639 2.648 2.520 2.415 2.556 Poland 2.734 2.847 2.887 3.342 3.669 3.791 Portugal 4.510 4.541 4.659 5.184 5.369 4.781 Romania 2.530 3.024 3.565 4.525 5.294 5.287 Russian Federation 922 945 999 1.176 1.117 739 Saudi Arabia 122 144 169 217 244 347 Singapore 2.732 2.362 2.391 2.891 2.949 2.613 Slovak Republic 826 905 1.017 1.179 1.372 1.427 South Africa 456 468 502 608 559 485 Spain 5.116 5.349 5.969 6.982 7.786 7.903 Sri Lanka 3.056 2.643 2.520 2.674 2.925 3.009 Sweden 1.335 1.264 1.446 1.783 1.935 2.021
Switzerland 1.889 1.875 2.183 2.619 2.893 2.840
Thailand 5.717 5.459 5.358 5.775 6.548 6.850
Tunisia 2.381 2.800 2.923 3.263 3.614 3.451
Turkey 10.205 10.604 12.301 15.223 17.622 18.909 United Arab Emirates 1.753 1.348 1.699 1.886 2.082 2.160 United Kingdom 8.780 8.062 8.022 9.223 10.184 9.716 United States 19.581 17.487 16.695 16.420 17.098 17.404 European Union (28) 113.533 114.695 120.292 140.161 157.229 156.953 World 352.813 342.374 358.295 406.206 454.886 481.866 TABLE 5: Exports in Clothing and Textile (In million USD)-CONTINOUS
COUNTRY 2006 2007 2008 2009 2010 Australia 496 539 531 424 455 Austria 4.748 5.271 5.617 4.488 4.638 Bangladesh 9.812 9.739 12.762 12.778 16.118 Belgium 14.899 16.937 17.960 14.787 14.314 Brazil 1.670 1.717 1.613 1.126 1.249 Bulgaria 2.184 2.454 2.424 1.945 1.913 Canada 4.167 3.902 3.263 2.649 3.080 China 144.057 171.552 185.771 167.087 206.692 Chinese Taipei 11.190 11.006 10.447 8.795 10.698 Colombia 1.345 1.979 2.080 1.231 1.064 Croatia 651 717 745 627 603 Czech Republic 3.423 3.879 4.259 3.469 3.546 Denmark 4.300 5.109 5.356 4.475 4.495 Egypt 392 463 1.532 2.340 2.569 Finland 620 720 755 568 581 France 16.275 18.590 19.009 15.749 15.774 Germany 28.366 32.864 35.064 29.882 31.457 Greece 2.190 2.330 2.376 1.743 1.670
Hong Kong, China 42.301 42.182 40.164 32.801 35.356
Hungary 1.705 1.687 1.647 1.313 1.458 India 18.444 19.546 21.340 21.115 24.063 Indonesia 9.374 9.699 9.959 9.123 10.964 Iran 904 1.163 1.245 1.008 1.121 Israel 1.209 1.147 981 972 1.029 Italy 35.427 39.868 41.377 31.441 33.088 Japan 7.419 7.624 7.928 6.592 7.618 Korea 12.292 12.288 12.112 10.552 12.577 Macao, China 1.852 1.689 1.160 326 219 Malaysia 4.280 4.628 5.173 4.485 5.552 Mexico 8.515 7.327 6.904 5.724 6.292 Netherlands 9.888 11.557 12.212 10.892 11.782 Norway 325 367 370 283 291 Pakistan 11.375 11.178 11.092 9.867 11.778 Philippines 2.863 2.499 2.173 1.682 1.934 Poland 3.969 4.728 5.638 4.759 5.289
Russian Federation 748 649 618 518 727 Saudi Arabia 380 395 141 102 507 Singapore 2.895 2.748 2.442 1.750 1.878 Slovak Republic 1.540 1.979 2.118 1.640 1.864 South Africa 445 451 420 326 840 Spain 8.824 10.142 11.331 10.605 10.925 Sri Lanka 3.202 3.433 3.606 3.404 3.663 Sweden 2.254 2.449 2.604 2.129 2.397 Switzerland 2.965 3.257 3.431 2.772 2.631 Thailand 7.120 7.187 7.452 6.727 8.061 Tunisia 3.368 4.066 4.243 3.516 3.535 Turkey 19.637 22.828 22.990 19.280 21.724
United Arab Emirates 2.336 2.615 2.848 2.709 2.934
United Kingdom 10.193 11.238 10.671 8.851 9.469
United States 17.565 16.746 16.945 14.117 16.861
European Union (28) 166.435 188.576 196.842 161.898 168.699
World 529.239 587.249 613.901 528.368 606.289
TABLE 5: Exports in Clothing and Textile (In million USD)-CONTINOUS
COUNTRY 2011 2012 2013 2014 2015 Australia 530 521 456 437 439 Austria 5.328 4.671 4.863 5.204 4.433 Bangladesh 21.112 21.422 25.762 26.945 29.130 Belgium 15.968 13.861 14.735 15.301 14.104 Brazil 1.301 1.163 1.112 1.042 1.016 Bulgaria 2.283 2.022 2.250 2.346 2.010 Canada 3.312 3.298 3.170 3.202 3.195 China 248.184 255.253 284.154 298.430 282.899 Chinese Taipei 12.010 11.264 11.137 11.170 10.525 Colombia 1.136 1.157 1.001 907 832 Croatia 699 626 663 996 888 Czech Republic 4.090 3.853 4.004 4.300 3.908 Denmark 5.242 4.686 4.890 5.324 4.720 Egypt 3.076 2.622 2.854 2.840 2.581 Finland 693 670 721 701 595 France 17.160 15.693 16.558 17.303 15.411 Germany 35.759 32.005 33.554 35.258 30.060 Greece 1.710 1.422 1.451 1.448 1.108
Hong Kong, China 35.787 33.119 32.636 30.295 27.523
Hungary 1.750 1.556 1.713 1.753 1.459 India 30.012 29.276 32.959 36.082 35.543 Indonesia 12.836 12.065 12.325 12.394 11.986 Iran 1.020 1.169 1.029 963 872 Israel 978 904 857 923 907 Italy 37.998 35.333 37.209 39.135 33.000 Japan 8.629 8.375 7.329 7.180 6.662
Korea 14.208 13.880 14.143 14.157 12.765 Macao, China 184 132 110 67 60 Malaysia 6.604 6.346 6.430 6.663 6.467 Mexico 6.778 6.684 6.976 7.167 7.046 Netherlands 14.016 12.955 13.846 14.718 11.826 Norway 341 332 328 322 268 Pakistan 13.632 12.919 13.890 14.068 13.255 Philippines 1.586 1.782 1.763 2.096 1.654 Poland 6.072 5.686 6.307 7.239 7.191 Portugal 5.656 5.212 5.606 6.057 5.313 Romania 4.883 4.477 4.713 4.986 4.197 Russian Federation 907 978 1.005 1.185 898 Saudi Arabia 595 559 549 564 522 Singapore 2.041 2.136 2.162 2.224 2.119 Slovak Republic 2.398 2.217 2.306 2.629 2.135 South Africa 938 904 927 904 737 Spain 13.930 13.986 15.934 17.066 15.645 Sri Lanka 4.409 4.231 4.752 5.186 5.057 Sweden 2.824 2.766 2.907 2.986 2.672 Switzerland 2.926 2.576 2.553 2.631 2.408 Thailand 8.633 7.796 7.974 8.020 7.178 Tunisia 3.786 3.148 3.215 3.187 2.548 Turkey 24.720 25.344 27.542 29.184 26.073 United Arab Emirates 2.964 3.688 4.370 4.578 4.269 United Kingdom 11.000 11.127 11.862 12.865 12.123 United States 19.092 19.086 19.795 20.471 19.834 European Union (28) 194.545 179.580 190.903 202.641 176.892 World 712.367 704.983 765.508 803.789 744.414
Source : Word Trade Organization,2015, www.wto.org
In the table 6, some important exporters were highlighted in yellow. In 2015, China has succeeded to become bigger than EU by % 159 and consisted % 38 world total export of textile and clothing and with a figure below, the picture is summarized by leaders. By referring the Figure 7, as shown, China leads the textile and clothing exports and followed by 28 country members of EU. India, Bangladesh and Hong Kong was the followers of Chinese leader ship. Turkey had an important place in ranking which this study will focus on in Chapter 3, therefore, country bases was mentioned in this chapter in general lines.
Table 6: Export Comparison in Clothing and Textile by EU and World COUNTRY 2014 2015 Australia 0,05% 0,06% Austria 0,65% 0,60% Bangladesh 3,35% 3,91% Belgium 1,90% 1,89% Brazil 0,13% 0,14% Bulgaria 0,29% 0,27% Canada 0,40% 0,43% China 37,13% 38,00% Chinese Taipei 1,39% 1,41% Colombia 0,11% 0,11% Croatia 0,12% 0,12% Czech Republic 0,54% 0,53% Denmark 0,66% 0,63% Egypt 0,35% 0,35% Finland 0,09% 0,08% France 2,15% 2,07% Germany 4,39% 4,04% Greece 0,18% 0,15%
Hong Kong, China 3,77% 3,70%
Hungary 0,22% 0,20% India 4,49% 4,77% Indonesia 1,54% 1,61% Iran 0,12% 0,12% Israel 0,11% 0,12% Italy 4,87% 4,43% Japan 0,89% 0,89% Korea 1,76% 1,71% Macao, China 0,01% 0,01% Malaysia 0,83% 0,87% Mexico 0,89% 0,95% Netherlands 1,83% 1,59% Norway 0,04% 0,04% Pakistan 1,75% 1,78% Philippines 0,26% 0,22% Poland 0,90% 0,97% Portugal 0,75% 0,71% Romania 0,62% 0,56% Russian Federation 0,15% 0,12% Saudi Arabia 0,07% 0,07% Singapore 0,28% 0,28% Slovak Republic 0,33% 0,29% South Africa 0,11% 0,10%
Spain 2,12% 2,10% Sri Lanka 0,65% 0,68% Sweden 0,37% 0,36% Switzerland 0,33% 0,32% Thailand 1,00% 0,96% Tunisia 0,40% 0,34% Turkey 3,63% 3,50%
United Arab Emirates 0,57% 0,57%
United Kingdom 1,60% 1,63%
United States 2,55% 2,66%
European Union (28) 25,21% 23,76%
World 100,00% 100,00%
Source : Word Trade Organization,2015, www.wto.org Figure 7: 2015- World Export Ranking
Source : Word Trade Organization,2015, www.wto.org
World Trade Organization last available data of world countries was with 2015 and so near history was shown in textile and clothing sector by mentioning the radical changes after 1980 and trade improvement in last 35 years with published official data.
The period after 1980s in world considered a time frame where globalization took a place and starter to emerge and expand its effects to other countries, therefore, in clothing and textile sector had a role change or share from developed countries to
industry has been recognized as one of the most globalized industry in the world(Rossen,2004)
2.2. International Brands in Textile Sector
While international trade was developing itself after the period 80s with the help of open economic model that would enable capital to move internationally would also bring international companies who were in charge of international trade by their products. Those companies after they established, quickly adopted themselves these historical economic changes in every business field including clothing and textile. In this part of thesis, world-wide brands will be mentioned in order to be illustrated with economic developments and aim at demonstrating the importance of branding in international markets.
Table 7 below presents the best ranked apparel brands in world-wide in 2015 and 2016 by their brand values. According to table, a USA origin company Nike ranked for both years as first by increasing its brand value by 16% than 2015 in 2016. A Sweden company H & M was able to hold its second position by % 5 growth in its brand value. Zara a Spanish entity belongs to Inditex group could also succeed to hold its position at third place but with a remarkable growth rate in its brand value by 17 %. In best ranked ten, Cartier one of the two French company in the list was able to climb in positioning from seventh to fourth with and increment in his brand value by 18 %, and the other French company Hermes could stabilize its ranking at fifth with an increment of its brand value by 9 %.
Table 7: Apparel World Wide Brands Ranking in 2016&2015
Source: Brandirectory, www.brandirectory.com
An interesting penetration can be seen by a Japanese company called Uniqlo that achieved to an up ranking from 8th to 6th. In one of German brand Adidas, was lower its ranking from 4th to 7th. On the other hand, Switzerland Rolex made a penetration to become within a brand in first ten, and became 8th in 2016 in the brand value ranking by cutting of its brand value by 2 %. The biggest jump was carried by Victoria’s Secret that is an American company and could show a big performance by being in the first ten valued brand in apparel by coming from 17th line and the brand
value of Victoria’s Secret. The last one is in the list Gucci, which is an Italian brand, lost its 6th place, became the 10th valued brand in apparel, and lost its brand value by 19 % as well. In the end, the table above shows the movement in brand values, please refer your information
To conclude this chapter, it can be said that, it is not a coincidence there is strong correlation with economic power and big sized companies. By the produced time series from Word Trade Organization, it was seen that more than 150 world country were in trade of textile and clothing, which only itself states the fact and shows the necessity and importance of the entire sector as well. Starting from 1980 era and onwards, there was a slightly shaped economic policy during the world. These policies were not only applied in trade but also applied more truly changed other macroeconomic indicators such as foreign direct investment which stands for the investment done in another country to increase the welfare, create employment, increase the production of country, develop the economic conditions of the cities that FDI is placed.
Another indicator can be called education, since after the period of 1980 economies became more open to international trade, not only for consumption goods and services but also for high tech machinery and industrial know-how that would obviously require skilled labor force who would be maintaining this high tech with a combination of their skill and knowledge into an output that is called ‘’Product’’. Products for sure needed to be produced by companies where countries needed these private entities who would do the job of government by acting like a small regulator in the economy who would employ, produce, seek and create new markets to place in, import and export, do business in local and global zones.
By economic numbers in exportation, barriers of trade lowered and resulted in slightly increment in world trade in entire sectors including textile and clothing. As soon as trade would become easier to maintain not only nationally but also globally, companies started to be in charge in markets and gradually created their brands to maintain their life. As mentioned in above chapter, products needed to variate itself to distinguish from the others therefore, just to become a company was no longer enough and that would mean another way of doing business by creating special brands and strategies to expand these branded goods into markets.
The correlation between economic policy, history and brands are so obvious, since policies trigger the international trade that would make a new movement and create new pressure on companies to become unique with their products in local and global markets by putting upfront their brand names. The global actions of brands were affected by the economy itself and found himself more free to move internationally which would in near future create grand competitive markets where surviving is not easy without being unique, without brands or capital power.
In the world, last 35 years’ history had and direct effect on Turkey, which will be covered in the next chapter.
CHAPTER 3. BRANDS AND TEXTILE SECTOR IN TURKEY
In this chapter, Turkish clothing and textile industry will be covered likewise Chapter 2; some macroeconomic indicators will be given for supporting purposes and well-known brands will be mentioned with some useful supporting information.
After the period of 1980s, in Turkey, there has been milestones in terms of economic policies, which resulted to make a shift from mainly closed economy to open economic models; more truly, these policies generated an economic growth model based on exportation to rest of the world. Similar to other developing countries, Turkey aimed at having exportations as an economic force; therefore, these applied policies would intend to enlarge the Turkish economy to be realized as economic growth.
3.1. Textile and Clothing Trade History in Turkey
3.1.1. Textile and Clothing Export History in Turkey
In order to illustrate the intended policies with economic results, starting from 1980 onwards will be summarized below with the help of tables and figures for foreign trade as export and import.
Table 8: Export in Textile and Clothing (1980-1990)
Source : Word Trade Organization,2015, www.wto.org
As mentioned 80s were crucial in Turkish economic history where 24 January 1980 was the first action taken by government that would actually opening country gates to abroad which was including a devaluation policy in Turkey, since world economics and their governmental approaches started to leave the economic
intervenes with their tight monetary policies, would also mean for Turkey to start to leave monetary policy approaches to the markets. By decisions of 24 January, international trade became free, government visibility in the markets started to invisible. Prices were mainly controlled by government of Turkey until 1980, after January 24, markets would be there to specify prices itself.
In 12 September 1980, Turkey witnessed a radical governmental change where country was ruled military forces for a quite long time. Then the election took place in 1983 where politicians started to maintain country policies. In 1989, that would be considered as a third milestone after 24 January decision, and 12 September, because in this year, Turkey would officially led foreign capitals to get in and get out of restrictions of Turkey easily.
In table 8 shows the effects of political changes in Turkey for the first following 10th year of 1980. Thanks to 24 January 1980, Turkey could succeed to increase its exportation capabilities in total of 88 billion USD where on the average textile and clothing exports were consisting of this success story by having a share of 30 %. Free international trade helped Turkey to increase slight its exports continuously. This was the aim of applied economic policies to enable Turkish economic to be able to trade with the outside of the world easily. Following ten years shown in the table 9 below where the export capabilities would remain powerful even though the economic crises seen in 1994, which can be considered a result of unsuccessful short, termed and speculative foreign capital movement.
Table 9: Export in Textile and Clothing (1991-2000)
Source : Word Trade Organization,2015, www.wto.org
1994 economic crises would cause a reduction of exportation by a very little effect right after 94 and onwards, economy in terms of exportation would be seen as successful in total of 10 years clothing and textile were exported of 81 billion USD
followed 10 years were summarized where there was one significant note to be shared, that is, another economic crisis seen in 2001.
This economic crisis was a financial crisis where the effects seen in bank and financial institution and therefore had a remarkable effect in the history of Turkey. The effects of this crisis, can be seen a reduction in total export of Turkey where the exportation had a serious damage since exporter business can be always maintained with a sustainable financial support where Turkish finance institution could not provide this support when needed and a lot of private banks declared bankruptcy, in short, 2001 was a serious economic crisis for Turkey and its effect was not only seen in foreign trade but also in entire economies. Thus, since the topic of this study would be focusing of textile and clothing, details of effects will not be given and only related information would mean to be shared.
Table 10: Export in Textile and Clothing(2001-2009)
Source : Word Trade Organization,2015, www.wto.org
In table 10, textile and clothing export as it can be seen, continued its enlargement, especially after 2003, since 2001 economic crisis effects were continued to effect for 2 years Turkey could not react the crises with foreign trade. Table 10 had another remarkable point that is last crises seen in the world in 2008 and effected Turkey with a delayed period. As it was seen in 2009, textile and clothing export reduced according to previous year by almost 3 billion USD and total trade according to 2008 was reduced almost 30 Billion USD.
Last data will be with table 11 for last available years export and clothing data to be compared with total export. As it can be seen the table below, 2009 economic crisis could be reacted by Turkish economy in exportation of textile and clothing as well as total export volume.
Table 11: Export in Textile and Clothing (2010-2015)
Source : Word Trade Organization,2015, www.wto.org
This table is important since it is the picture of most recent situation of textile and clothing industry where starting from 2010 export of textile and clothing was on its way to increase, no matter how the entire total export moved.
For this 35 years clearly showed the significance of clothing and textile in Turkish industry. Actually, in exportation, that is a picture of how a whole country can demonstrate its economic forces in its trade profile. Textile not only for last 35 years, in the entire history of Turkey was so important since Turkey is still rich country with its not only raw material, textile experiences but also people surrounded the textile sector.
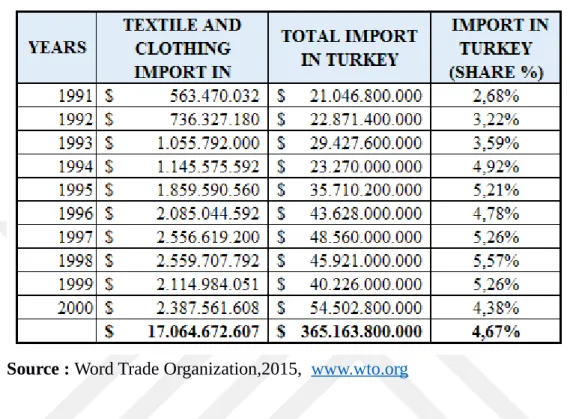
3.1.2. Textile and Clothing Import History in Turkey
So far this chapter, export side of foreign trade was covered, but how about in the same time period the importation of textile and clothing and comparability with total import? There was a fact to keep in the minds, 24 January and 1989 foreign capital freedom was not only covering export side but for import side of the foreign trade.
Table 12 below shows the first 10 followed year of 1980 period. Where it can be clearly commented textile and clothing importation was not the biggest share of total import since many resources for producing and selling these final goods were available in Turkey therefore a foreign help was limitedly needed.