Ankara Ecz. Fak. Mec. J. Fac. Pharm. Ankara
8. 51 (1978) 8. 51 (1978)
Standardization of Carboxyhemoglobin Determination by Microspectrophotometric Method and Application of The
Method to Workers Occupationally Exposed to Carbon Monoxide
Mikrospektrofotometrik Yöntemle Karboksihemoglobin Tayi-niMn Standardizasyonu ve Bu Yöntemle Mesleksel Olarak Karbon monoksit'e Maruz Kalanlarda Karbon monoksit İnhalasyonunun
Saptanması
Nevin VURAL Zeynep MOTACEDED**
Carbon monoxide (CO) is a toxic gas known since prehistoric times when man first discovered fire. Accidental CO poisonings due to incomplete combustion of organic materials used for making fire or due to exposure to natural CO sources first reported by LEWIJ (29) and others (28). Although the main source of CO is incomplete burning of materials, several natural sources of CO in both biological (1,2,32) and nonbiological origin (11) have also been identified.
As civilization developed and modern techniques spread over larger areas, the sources of CO increased both around our occupa-tional and nonoccupaoccupa-tional environment. In many countries the incidence of acute CO intoxications stili take the second place (21) while in some, the total number of deaths due to CO approaches the number of deaths because of other chemicals (15).
The signs and symptoms of acute CO intoxication are well known and they only appear with carboxyhemoglobin (COHb) levels above 10 %. But these levels are seldom met in subjects expo-sed to traffic exhaust or industrical CO sources occupationally. As
Redaksiyona verildiği tarih: 20 Mart 1978.
* Ecz. Zeynep Motaceded'in aynı isimli doktora tezinin özetidir. Sınav tarihi : Mayıs, 1977. ** Toksikoloji Kürsüsü, Eczacılık Fakültesi, Ankara Üniversitesi.
52 Nevin VURAL, Zeynep MOTACEDED
clinical effects only depend upon the concentration of CO entering the body, the sensitivity and reproducibility of the method used for the determination of COHb levels below % 10 is very important (8, 14). There are at least 133 successful methods for the determination of CO in blood (9) but only a few them are convenient for the en-vironmental and industrial application (3, 31).
In the first part of this research the standardization of COHb by direct microspectrophotometric method of COMMINS and LAWTHER (13) adapted by BUCHWALD (5), in our laboratory is presented. The second part of the study is the application of the met-hod to the workers of the Factory of Electricity Gas, Ankara who occupationally exposed to CO. CO in the working area was also de-termined by infrared gas analyser to relate the concentration of at-occupationally exposed to CO. CO in the working area was also de-termined by infrared gas analyser to relate the concentration of at-mospheric CO with COHb levels.
EXPERIMENTAL DATA MATERIAL and METHOD
1 . Standardization of COHb determination. Equipment:
Pure CO: Obtained in our laboratory using formic acid (HCOOH) and 1-1,SO4 (30).
Pure 02 bottle: (Habaş, purity 99.5 %)
Ammonia solution: 1 ml Concentrated NH 3 , specific gravity 0.880, diluted to 800 ml with deionized water.
Blood samples: Obtained from the hematology Department of Ankara Yüksek Ihtisas Hastanesi which were collected from normal male subjects confirmed by hematological analysis in the hospital.
Spectrophotometer: pye Unicam, sp 1700
Heparinized capillary tubes: (Hettich, 1.4mm x 75 mm) Flowmeter.
Standardization of Corboxyhemoglobin Determination— 53
Method:
The principle of the direct microspectrophotometric method for the COHb determination depends on the absorbance difference of oxyhe moglobin (02Hb) and COHb in the Soret band. We used BUCHWALD'S method (5) with so me little modifications.
Blood samples were collected in heparinizied capillary tubes. The tubes were quickly and completely filled with blood from a fin-ger pricked with a Frankel needle. The tubes were sealed at both ends with plasticine and stored at the refrigerator until analysis. Dupli-cate samples were obtained from each person. The blood sample (about 0.02 ml) was diluted with 18 ml ammonia solution in a volumetric flask. This solution was divided into three parts. The first portion was transferred into the spectrophotometer cell (I). The second portion was saturated with oxygen (O2Hb % 100, II) and the third with CO (COHb % 100, III) by bubbling the gas through the solutions about a rate of about 50 ml/min for 15 and 2 minutes respectively.
Using O2Hb (II) as reference, the absorbances of I and III were measured at 415, 420 and 428 nm (nanometer). The COHb satura-tion of the sample (I) was calculated from the equasatura-tion giyen below (5) :
COHb % = 100 a l /Am
a2 = a420 1 /2 (a 4 , 5 -+- a428) Ani --- A420 — 1 /2 (A415 -F A428)
where a, is the difference of absorbances of I and A l is the difference of absorbances of III at wavelengths shown above.
Control of the method was carried with standard COHb solu-tions prepared after KNIGHT et al (20). A standard curve was ob-tained plotting concentrations (from 0-20) against optical heights calculated after COMMINS and LAWTHER (13).
The sensitivity, repeatability and reproducibility of the method were also estimated.
2 . Determination of CO inhalation degree of the workers
occupationally exposed to CO.
The male workers employed by the Electricity and To wngas, Maltepe, Ankara, were examined. The factory, established in 1929,
54 Nevin VURAL, Zeynep MOTACEDED
produces 220 000 M' town gas daily. The working areas where the subjects can expose to CO were selected:
a) 26 generator workers, employed for the control and fee-ding of the generator furnaces.
b) 12 pipe controlers, whose job are to check any gas leakage from the pipes used to distribute town gas to the city.
c) 8 compressor workers who work in the open door to compress town gas to the depots.
d) 20 enclosed garage workers who employed for the service and repairing of vehicles of the factory.
e) 19 drivers in charge of the factory transport.
f) 6 laboratory technicians employed for the chemical analysis of town gas, coal and other chemicals used in the factory.
g) Control group: 6 F moking male subjects were selected as a a control group among the normal who do not exposed to CO oc-cupationally. Smoking -ubjects. are chosed among the males who smoke 15-20 cigarettes per day.
Control subjects work at the Faculty of pharmacy, Ankara Uni-versity.
All the subjects investigated in our research were male subjects.
Method:
Blood samples were taken from the workers just before the work (BW) and after the work (AW). The working period was 8 hours. Blood samples were collected at 8.00 o'clock in the morning and at 16.30 o'clock in the afternoon. A questionnaire card for each sub-ject was completed to provide the following information: Sampling
date and time, name, age, smoking habits (number of cigarettes per day and during the sampling time), history of working, health comp-laints such as head ache. The major part of our survey took place during the November 1974 to the end of March 1976.
3. Determination of CO in the working atmosphere.
Atmospheric CO in the working area mentioned above was determined by a portable infrared CO analyzer (Mijnhardt). CO was measured at several times of the day and points of the wor-
Standardization of Carboxyhemoglobin Determination... 55
king area to get the maximum, minimum and mean concentration levels. CO was also determined outside of the working environment.
RESULTS
(FINDINGŞ)
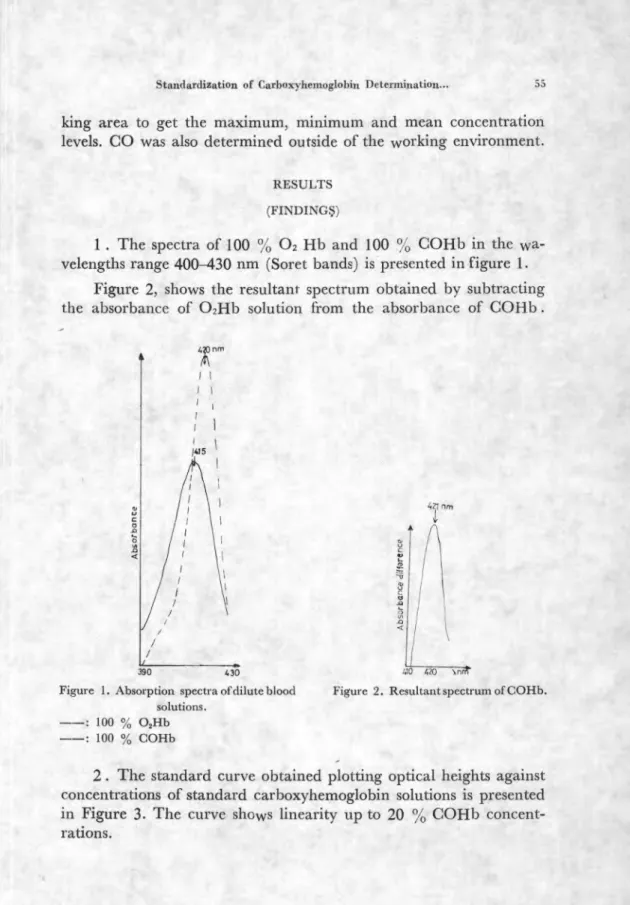
1 . The spectra of 100 % 02 Hb and 100 °, 10 COHb in the wa-velengths range 400-430 nm (Soret bands) is presented in figure 1.
Figure 2, shows the resultant spectrum obtained by subtracting the absorbance of 02Hb solution from the absorbance of C01113 .
42'1 nm
390 430
Figure 1. Absorption spectra of dilute blood solutions.
--: 100 % 0,11b
--: 100 % COHb
Figure 2. Resultant spectrum of COHb.
2 . The standard curve obtained plotting optical heights against concentrations of standard carboxyhemoglobin solutions is presented in Figure 3. The curve shows linearity up to 20 °,/o COHb concent-rations.
:14 0700 I A Nevi n V URAL , Z e yn ep M O TA CEDE D SOBA %C0Hb Figure 3. Standard curve of
Standardization of Corboxyhemoglobin Detern6nation... 57
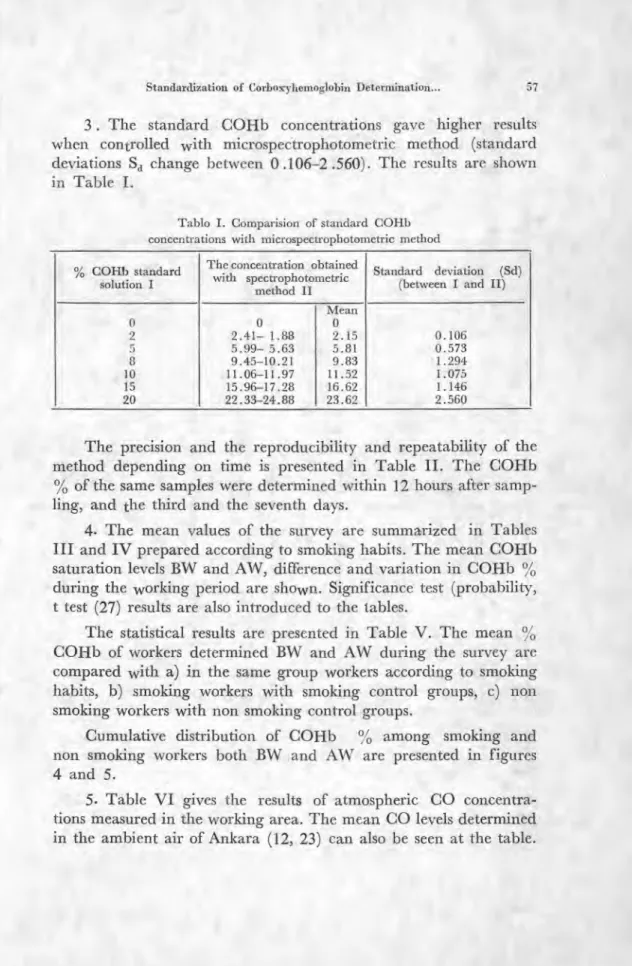
3. The standard COHb concentrations gaye higher results when controlled with microspectrophotometric method (standard deviations Sd change between O .106-2 .560). The results are shown in Table I.
Tablo I. Comparision of standard COHb concentrations with microspectrophotometric method
ox„ COHb standard solution I
The concentration obtained with spectrophotometric
method II
Standard deviation (Sd) (between I and II)
Mean 0 0 0 2 2.41— 1.88 2.15 0.106 5 5.99— 5.63 5.81 0.573 8 9.45-10.21 9.83 '1.294 10 11.06-11.97 11.52 1.075 15 15.96-17.28 16.62 1.146 20 22.33-24.88 23.62 2.560
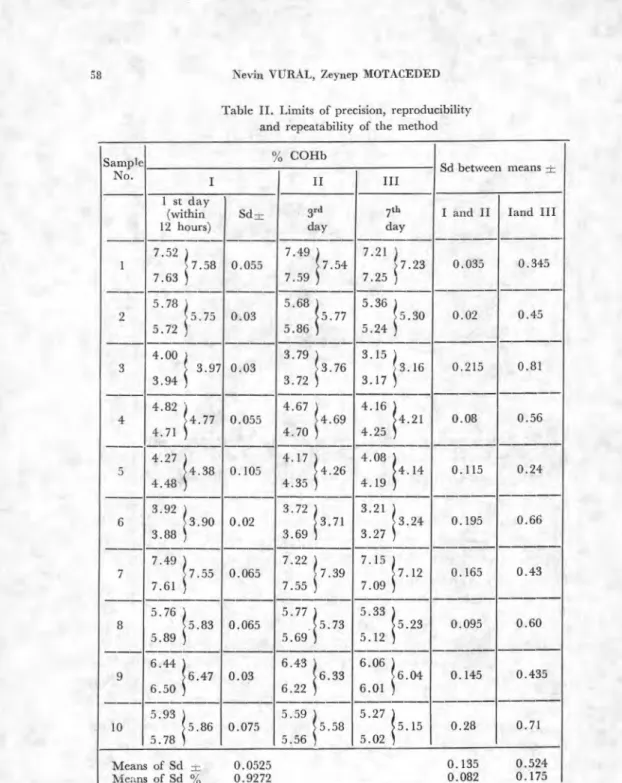
The precision and the reproducibility and repeatability of the method depending on time is presented in Table II. The COHb % of the same samples were determined within 12 hours after samp-ling, and the third and the seventh days.
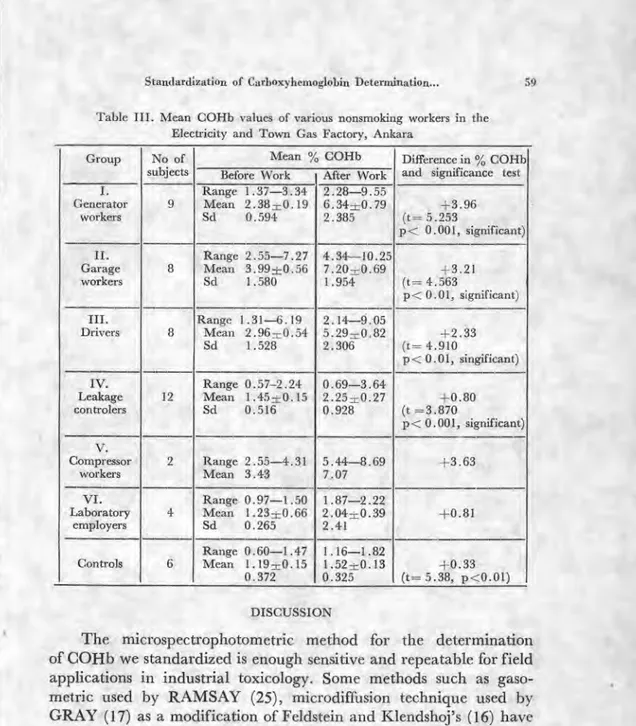
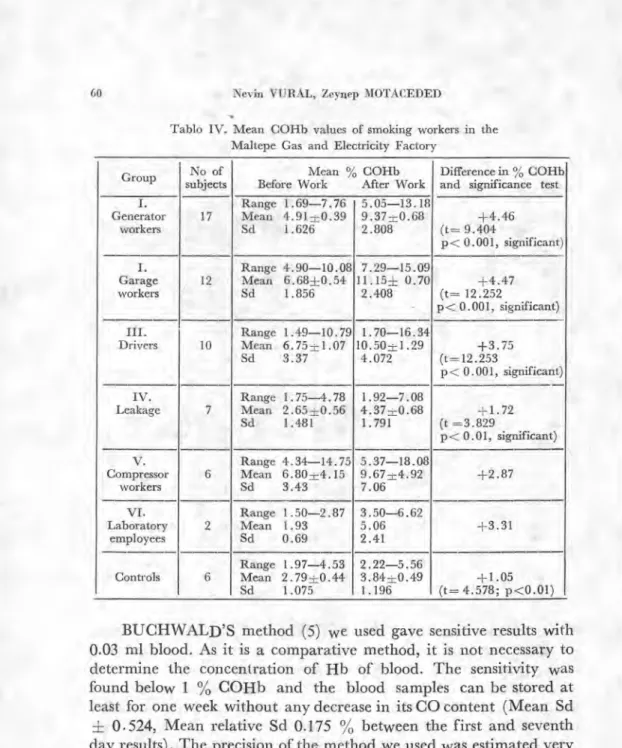
4. The mean values of the survey are summarized in Tables III and IV prepared according to smoking habits. The mean COHb saturation levels BW and AW, difference and variation in COHb % during the working period are shown. Significance test (probability, t test (27) results are also introduced to the tables.
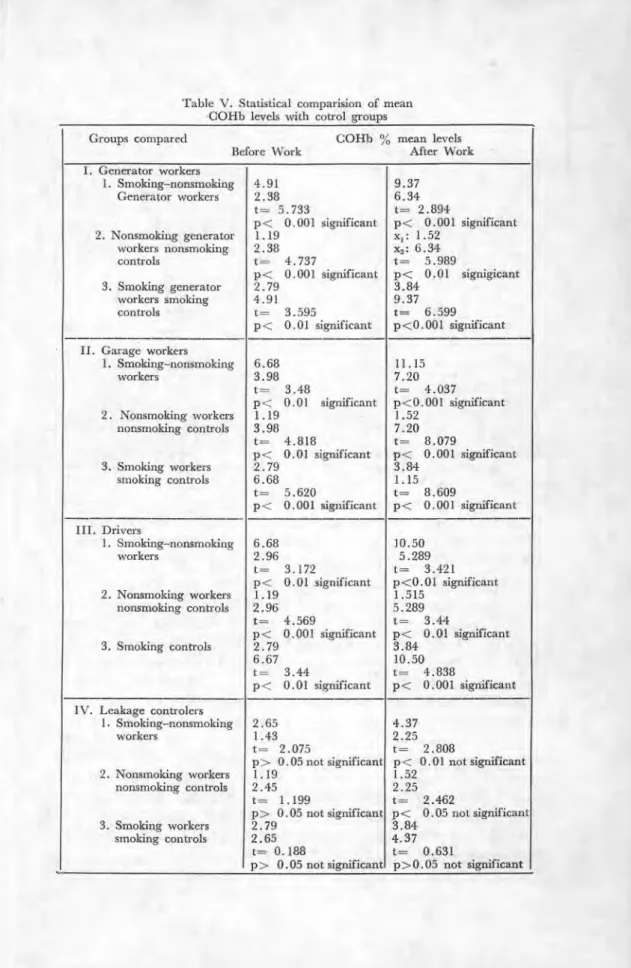
The statistical results are presented in Table V. The mean % COHb of workers determined BW and AW during the survey are compared with a) in the same group workers according to smoking habits, b) smoking workers with smoking control groups, c) non smoking workers with non smoking control groups.
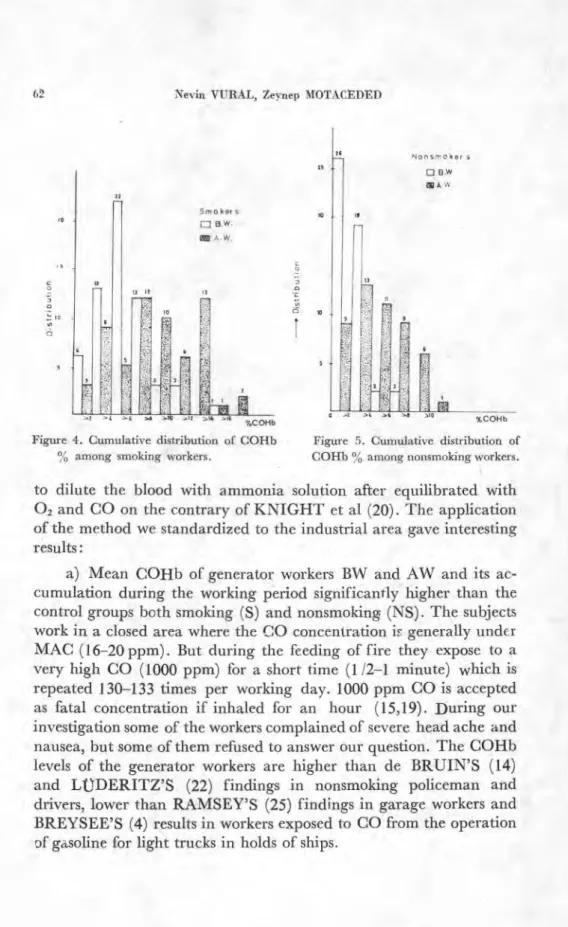
Cumulative distribution of COHb % among smoking and non smoking workers both BW and AW are presented in figures 4 and 5.
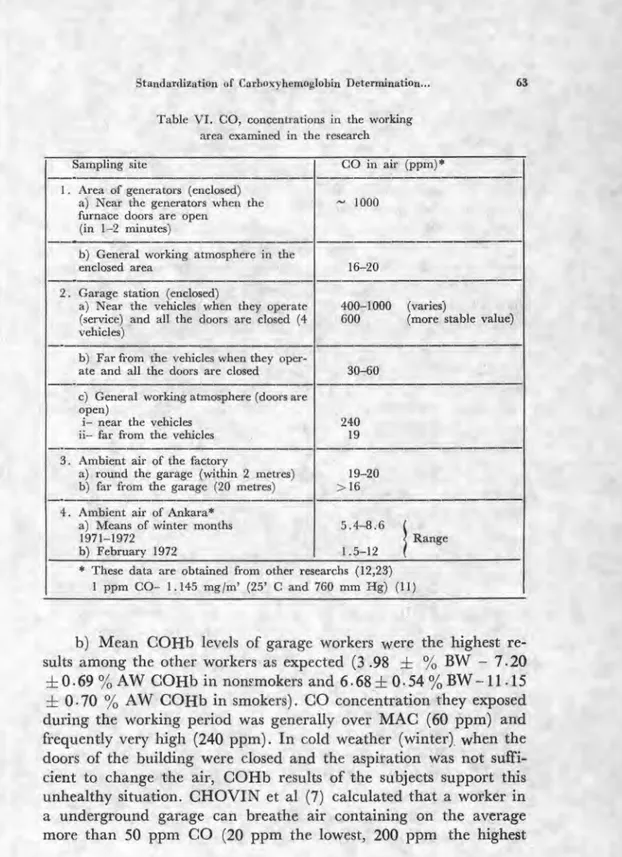
5. Table VI gives the results of atmospheric CO concentra-tions measured in the working area. The mean CO levels determined in the ambient air of Ankara (12, 23) can also be seen at the table.
58 Nevin VURAL, Zeynep MOTACEDED
Table II. Limits of precision, reproducibility and repeatability of the method
Sample No. % COHb Sd between nneans = I II III 1 st day
(within Sd= 3rd 7th 1 and II land III
12 hours) day day
7.52 7.49 7.21 7.58 0.055 7.54 ?7.23 0.035 0.345 7.63 7.59 7.25 5.78 5.68 5.36 5.75 0.03 5.77 5.30 0.02 0.45 5.72 5.86 5.24 ) 4.00 ) 3.79 3.15 ? 3.97 0.03 3.76 3.16 0.215 0.81 3.94 ) 3.72 3.17 1
1
,
ı
4.82 4.67 4.16 4.77 0.055 4.69 4.21 0.08 0.56 4.71 4.70 4.25 4.27 4.17 ) 4.08 4.38 0.105 ,,I..26 4.14 0.115 0.24 4.48 4.35 ) 4.19 3.92 3.72 3.21 3.90 0.02 3.71 3.24 0.195 0.66 3.88 3.69 3.27 7.49 7.22 ) 7.15 ) 7.55 0.065 )7.39 7.12 0.165 0.43 7.61 7.55 ) 7.09 ) 5.76 5.77 5.33 8 5.83 0.065 5.73 5.23 0.095 0.60 5.89 5.69 j 5.12 6.44 6.43 6.06 9 6.47 0.03 6.33 6.04 0.145 0.435 6.50 6.22 6.01 5.93 5.59 5.27 10 5.86 0.075 5.58 5.15 0.28 0.71 5.78 5.56 5.02 Means of Sd = 0.0525 0.135 0.524 Means of Sd % 0.9272 0.082 0.175Standardization of Carboxyhemoglobin Determination...
Table III. Mean COHb values of various nonsmoking workers in the Electricity and Town Gas Factory, Ankara
Group No of subjects
Mean % COHb Difference in % COHb and significance test Before Work After Work
I. Range 1.37-3.34 2.28-9.55 Generator 9 Mean 2.38 = 0.19 6.34 = 0.79 +3.96 workers Sd 0.594 2.385 (t= 5.253 p< 0.001, significant) II. Range 2.55-7.27 4.34-10.25 Garage 8 Mean 3.99=0.56 7.20 = 0.69 + 3 .2 1 workers Sd 1.580 1.954 (t= 4.563 p< 0.01, significant) III. Range 1.31-6.19 2.14-9.05 Drivers 8 Mean 2.96 = 0.54 5.29=0.82 +2.33 Sd 1.528 2.306 (t= 4.910 p< 0.01, singificant) IV. Range 0.57-2.24 0.69-3.64 Leakage 12 Mean 1.45 = 0.15 2.25 = 0.27 +0.80 controlers Sd 0.516 0.928 (t =3.870 p< 0.001, significant) V. Compressor 2 Range 2.55-4.31 5.44-8.69 +3.63 workers Mean 3.43 7.07 VI. Range 0.97-1.50 1.87-2.22 Laboratory 4 Mean 1.23 = 0.66 2.04 = 0.39 +0.81 employers Sd 0.265 2.41 Range 0.60-1.47 1.16-1.82 Controls 6 Mean 1.19 = 0.15 1.52 = 0.13 +0.33 0.372 0.325 (t-= 5.38, p<0.01) DISCUSSION
The microspectrophotometric method for the determination of COHb we standardized is enough sensitive and repeatable for field applications in industrial toxicology. Some methods such as gaso-metric used by RAMSAY (25), microdiffusion technique used by GRAY (17) as a modification of Feldstein and Klendshoj's (16) have a disadvantage of determination hemoglobin (Hb) as to calculate COHb % saturation. BLACKMORE (3), COLLISON et al (10), PURVES (24) got satisfactory results with finger prick blood by gas chromatographic methods, but most of them need a special device for the instrument (3, 18) as w ell as having the disadvantage of calcula-tion Hb.
GO Nevin VURAL, Zeynep MOTACEDED
Tablo IV. Mean COHb values of smoking workers in the Maltepe Gas and Electricity Factory
Group No of subjects
Mean % COHb Before Work After Work
Difference in % COHb and significance test I. Generator workers 17 Range 1.69-7.76 Mean 4.91 = 0.39 Sd 1.626 5.05-13.18 9.37 = 0.68 2.808 +4.46 (t= 9.404 p< 0.001, significant) I. Range 4.90-10.08 7.29-15.09 Garage 12 Mean 6.68±0.54 11.15± 0.70 +4.47 workers Sd 1.856 2.408 (t= 12.252 p< 0.001, significant) III. Range 1.49-10.79 1.70-16.34 Drivers 10 Mean 6.75 = 1.07 10.50 = 1.29 +3.75 Sd 3.37 4.072 (t=12.253 p< 0.001, significant) IV. Range 1.75-4.78 1.92-7.08 Leakage 7 Mean 2.65 = 0.56 4.37 = 0.68 +1.72 Sd 1.481 1.791 (t =3.829 p< 0.01, significant) V. Range 4.34-14.75 5.37-18.08 Compressor 6 Mean 6.80 = 4.15 9.67 = 4.92 +2.87 workers Sd 3.43 7.06 VI. Range 1.50-2.87 3.50-6.62 Laboratory 2 Mean 1.93 5.06 +3.31 employees Sd 0.69 2.41 Range 1.97-4.53 2.22-5.56 Controls 6 Mean 2.79 = 0.44 3.84 = 0.49 +1.05 Sd 1.075 1.196 (t= 4.578; p<0.01)
BUCHWALD'S method (5) we used gaye sensitive results with 0.03 ml blood. As it is a comparative method, it is not necessary to determine the concentration of Hb of blood. The sensitivity was found below 1 % COHb and the blood samples can be stored at least for one week without any decrease in its CO content (Mean Sd ± 0.524, Mean relative Sd 0.175 % between the first and seventh day results). The precision of the method we used was estimated very high (Mean Sd 0.0525). The accuracy and sensitivity of our met-hod is well enough as compared with gas chromatographic metmet-hod of RODKEY (26) and biochemical method of WHITEHEAD and WORTHİNGTON (33). The method can be standardized with standard COHb solutions up to 20 %. We obtained better results
Table V. Statistical comparision of mean COHb levels with cotrol groups Groups compared
Before Work
COHb % mean levels After Work I. Generator workers 1. Smoking-nonsmoking Generator workers 2. Nonsmoking generator workers nonsmoking controls 3. Smoking generator workers smoking controls 4.91 2.38 t =- 5.733 p< 0.001 significant 1.19 2.38 t= 4.737 p< 0.001 significant 2.79 4.91 t= 3.595 p< 0.01 significant 9.37 6.34 t= 2.894 p< 0.001 significant x,: 1.52 x2 : 6.34 t= 5.989 p< 0.01 signigicant 3.84 9.37 t= 6.599 p <0 .001 significant 6.68 3.98 t= 3.48 p< 0.01 significant 1.19 3.98 t= 4.818 p< 0.01 significant 2.79 6.68 t= 5.620 p< 0.001 significant 11.15 7.20 t= 4.037 p<0. 001 significant 1.52 7.20 t= 8.079 p< 0.001 significant 3.84 1.15 t= 8.609 p < O . 001 significant II. Garage workers
1. Smoking-nonsmoking workers 2. Nonsmoking workers nonsmoking controls 3. Smoking workers smoking controls III. Drivers 1. Smoking-nonsmoking workers 2. Nonsmoking workers nonsmoking controls 3. Smoking controls 6.68 2.96 t= 3.172 p< 0.01 significant 1.19 2.96 t-= 4.569 p< 0.001 significant 2.79 6.67 t= 3.44 p< 0.01 significant 10.50 5.289 t= 3.421 p <O. 01 significant 1.515 5.289 t= 3.44 p< 0.01 significant 3.84 10.50 t= 4.838 p< 0.001 significant
IV. Leakage controlers 1. Smoking-nonsmoking workers 2. Nonsmoking workers nonsmoking controls 3. Smoking workers smoking controls 2.65 1.43 t= 2.075 p> 0.05 not significant 1.19 2.45 t= 1.199 p> 0.05 not significant 2.79 2.65 t= 0.188 p> 0.05 not significant 4.37 2.25 t= 2.808 p< 0.01 not significant 1.52 2.25 t= 2.462 p< 0.05 not significant 3.84 4.37 t= 0.631 p> 0.05 not significant
Ili
Smokers C: I B.W. A.W. O 12 12 12 lo62 Nevin VURAL, Zeynep MOTACRDRD
Dis
tr
ibu
tion
ıl .4 -ı6 v >te >ıt >♦ ı• %coHb
Figure 4. Cumulative distribution of COHb % among smoking workers.
Figure 5. Cumulative distribution of COHb among nonsmoking workers.
to dilute the blood with ammonia solution after equilibrated with
02 and CO on the contrary of KNIGHT et al (20). The application of the method we standardized to the industrial area gaye interesting results:
a) Mean COHb of generator workers BW and AW and its ac-cumulation during the working period significantly higher than the control groups both smoking (S) and nonsmoking (NS). The subjects work in a closed area where the CO concentration is generally under MAC (16-20 ppm). But during the feeding of fire they expose to a very high CO (1000 ppm) for a short time (1 /2-1 minute) which is repeated 130-133 times per working day. 1000 ppm CO is accepted as fatal concentration if inhaled for an hour (15,19). During our investigation some of the workers complained of severe head ache and nausea, but some of them refused to answer our question. The COHb levels of the generator workers are higher than de BRUIN'S (14) and LÜDERITZ'S (22) findings in nonsmoking policeman and drivers, lower than RAMSEY'S (25) findings in garage workers and BREYSEE'S
(4)
results in workers exposed to CO from the operation of gasoline for light trucks in holds of ships.Standardization of Carboxy-hemoglobin Determination... 63
Table VI. CO, concentrations in the working arca examined in the research
Sampling site CO in air (ppm)*
1. Area of generators (enclosed) a) Near the generators when the furnace doors are open
(in 1-2 minutes)
- 1000
b) General working atmosphere in the
enclosed area 16-20
2. Garage station (enclosed)
a) Near the vehicles when they operate (service) and all the doors are closed (4 vehicles)
400-1000 (varies)
600 (more stable value)
b) Far from the vehicles when they
oper-ate and all the doors are closed 30-60
c) General working atmosphere (doors are open)
i- near the vehicles ii- far from the vehicles
240 19
3. Ambient air of the factory
a) round the garage (within 2 metres) b) far from the garage (20 metres)
19-20 >16
4. Ambient air of Ankara* a) Means of winter months 1971-1972
b) February 1972
5 .4-8.6
Range 1.5-12
* These data are obtained from other researchs (12,23) 1 ppm CO- 1.145 mg /m' (25' C and 760 mm Hg) (11)
b) Mean COHb levels of garage workers were the highest re-sults among the other workers as expected (3 .98 ± %
BW — 7.20
±0.69%AW COHb in
nonsmokers and6.68+ 0.54 %BW-11.15
± 0.70 AW COHb
in smokers). CO concentration they exposedduring the working period was generally over
MAC (60
ppm) and frequently very high(240
ppm). In cold weather (winter), when thedoors of the building were closed and the aspiration was not suffi-cient to change the air, COHb results of the subjects support this unhealthy situation. CHOVIN et al (7) calculated that a worker in a underground garage can breathe air containing on the average more than 50 ppm CO (20 ppm the lowest, 200 ppm the highest
64 Nevin VURAL Zeynep MOTACEDED
concentration). 50 ppm of CO would result in COHb saturation of about 8 % after 5 hours as reported in literature (6).
c) Mean COHb levels of drivers showed a significant difference from other works published (2.96 ± 0.54 % BW — 5.29 ± 0.82
AW in nonsmokers and 6.75 ± 0.54 % BW and 10.50 ± 1.29 % COHb AW in smokers). CLAYTON et al (9) reported that 50 % of the drivers in his research have COHb % less than 3 %. Accor-ding to de BRUIN'S (14) results the COHb increase during working hours is 1.9 % to 2.15 %. In our results, only 20 % of the nonsmoking drivers had less than 3.0 % COHb saturation. This difference can only be explained that the drivers usually spend their free time resting in the enclosed garage mentioned above.
The workers employed as compressor workers, controlers and laboratory technicians also had significantly higher COHb levels than controls. Only the COHb levels of leakage controlers who work outdoors and where the atmospheric CO concentration was generally
16 ppm, were not significantly higher than the control groups. Our COHb results of smoking and nonsmoking control groups can be comparable with microdiffusion and biochemical methods previously done by us (31).
CONCLUSION
1 . The direct microspectrophotometric method for the deter-mination of COHb % we adapted to our laboratory is reliable for its sensitivity, accuracy and repeatability. It can be standardized with standard COHb solutions and is applicable to field research in industrial toxicology.
2. Mean % COHb levels of subjects employed by the various area of the factory of Electricity and Towngas, Ankara, showed sig-nificantly higher results as compared with control groups. The inc-rease in COHb level after a day's exposure also presented a signifi-cant difference from the COHb of controls both in smokers and non-smokers (p <O .001).
3. Atmospheric CO measurements in the working areas sup-port the high COHb levels of the employees. It is generally known
Standardization of Corboxyhemoglobin Determination... 65
that a COHb level of 5 % comprise a poten ial risk or early CO in-toxication (neuropsychologicai signs).
Our findings show that some measurements such as controling the atmospheric CO and determination COHb lcvels of the workers at certain periods have to be taken by the associated organizations for the health safety of workers.
SUMMARY
1. The microspectrophotometric method of COMMINS and LAWTHER adapted by BUCHWALD was standardized in our laboratory for the determination of % COHb. The sensitivity of the method was found far below 1 % COHb and the precision (Sd O .525 and relative Sd O .9272 %) very satisfactory. It has also been slıown that the accuracy of the method can be controlled with the calibration curve prepared with standard COHb- solutions. As it is possible to estimate CO in small samples of blood (0 .03 ml), it can be easly applicable to problem areas.
2 . The COHb levels of different groups of male employees who occupationally exposed to CO in the factory of Electricity and Town Gas, Ankara measured with the method we standardized. Blood samples have been taken before and after exposure. Totally 97 workers have been examined. The results have been compared with smoking and nonsmoking control groups.
The mean COHb levels of the generator workers was on the average 2.38 + 0.19 % (9 nonsmokers), 4.91 ± 0.39 % (17 smokers) before work and increased to respectively 6 .34 ± 0 .79 % and 9 .37 ± 0 .68 %; of the enclosed garage workers 3 .99 ± 0.56 % (8 nonsmokers), 6 .68 + 0.54 % (12 smokers) before work and increased to respectively 7.20 + 0.69 % and 11 .15 + 0.70 %; of the drivers 2 .96 ± 0.54 % (8 nonsmokers), 6 .75 ± 1 .07 % (12 smokers) before work and increased to 5 .29 ± 0 .82 % and 10.50 ± 1 .29 %; of the gas leakage controlers 1 .45 ± 0.15 % (12 nonsmokers), 2.65 ± 0.56 % (7 smokers) before work and increased to 2 .25 :E 0 .27 % and 4 .37 ± 0 .68; of the compresor workers 3 .43 % (2 nonsmokers), 6 .80 ± 4 .15 (6 smokers) before work and increased to respectively 7 .07 % and 9 .67 + 4 .92
66 Nevin VURAL,Zeynep MOTACEDED
%; of the laboratory technicians 1 .23 ± 0.66 % (4 nonsmokers), 1 .93 % (2 smokers) before work and increased to 2 .04 ± 0.39 %; 5 .06 respectively as a consequence of exposure during 8 hours wor-king. The meanCOHb levels BW and AW, and increase in a working day generally presented a significant high difference in workers.
3. Atmospheric CO levels in the working areas measured by using a portable infrared CO analyser. The findings of CO in air around the workers agree with the high COHb levels.
It is concluded that some measurements must be taken by the assciated organizations to prevent the workers from high CO in-halation.
ÖZET
1 . Bu çalışmada, kanda CO tayini için laboratuvar koşulları -mıza uygun bir yöntem standardize edilmiştir. Bu amaçla COMMİNS ve LAWTHER'in direkt spektrofotometrik yönteminin BUCHWALD tarafından saha için adapte ettiği yöntemden yararlanılmıştır. Yöntem duyarlık (% 1 altında), kesinlik (Sd ± 0 .0525 ve relatif Sd O . 9272) ve tekrarlanabilirlik bakımından endüstri toksikoloji alanında kullanılabilecek yeterlikte bulunmuştur. Ayrıca yöntemin optik yük-sekliğe göre hazırlanan COHb standard çözeltisi ile de (% 20 COHb e kadar) standardize edilebileceği gösterilmiştir.
2 . Bu yöntem Ankara Elektrik ve Havagazı Fabrikasında CO e maruz kaldıkları düşünülen iş yerlerindeki işçilere uygulanmıştır. Toplam 97 erkek işçide sabah işe başlamadan ve iş bitimi sonun-da COHb tayin edilerek bu değerler 12 kontrol grubu ile karşılaş -tırılmıştır.
Sonuç olarak jeneratör işçilerinde bir iş gününde COHb değ i-şimi (9 sigara içmeyende % 2 .38 ± O .19 - % 6 .34 ± O .79; 17 sigara içende % 4 .91 ± 0.39 - % 9 .37 ± 0 .68); garaj işçilerinde
(8 sigara içmeyende : % 3 .99 ± 0 .56 - % 7 .20 ± 0 .69 ve 12 sigara içende: % 6 .68 ± 0 .54 - % 11 .15 ± O .69) ; şöförlerde ( 8 sigara içmeyende: % 2 .96 ± O .54 - % 5 .29 ± O .82 ve 10 .50 ± 1 .29); havagazı ateşçilerinde (12 sigara içende % 1 .45 ± O .15 ± -% 2 .25 + 0 .27); 7 sigara içmeyende: -% 2 .65 + 0 .56 - -% 4.37
Standardization of Carboxyhemoglobin Determination... 67
+ O .68); kompresör işçilerinde (2 sigara içmeyende % 3 .43 - 7 .07; 6 sigara içende: % 6 .80 + 4 .15 - % 9 .67 + 4 .92); laboratuvar teknisyenlerinde (4 sigara içmeyende: % 1 .23 ± 0 .66 - 0 .66 - 2 .04 -I- O .39; 2 sigara içmeyende: % 1 .93 - % 5 .06) saptanm ıştır. Kontrol gruplarına göre gerek sigara içenlerde ve gerekse sigara iç-meyenlerde bir iş günü sonunda COHb yükselmesi, iş öncesi ve iş sonrası COHb değerleri kontrol gruplarına göre yüksek bulunmuştur (p <O .001).
3 . Bu iş yerleri havasında CO infrared CO analyzer ile saptan-mıştır. Jeneratörlerin bulunduğu yerde ve garajda özellikle iş sı -rasında zaman zaman CO miktarının MAC çok üstüne çıktığı ve teli-likelikeli düzeyde olduğu saptanmıştır.
Bu nedenle, ilgili kuruluşlarca bu iş yerlerinde çalışan kimselerin CO inhalasyonuna maruziyetlerini önleyici önlemlerin alınması gerektiği kanısındayız.
REFERENCES
1. Barham, E.G., Wilton, J.W., Science., 144, 860-862 (1964).
2. Barham, E.G., Ibid, 140, 826-828 (1969).
3. Blackmore, D.J., The Analyst, 95, 439-458 (1970)
4. Breysse, P.A., M.S., M.P.H. and Bovee, H.H., Ph. D., Am. Ind. Hyg. Ass. J. 30,
477-483 (1969)
5. Buchwald, H., Ibid 30, 564-569 (1969).
6. Buchwald, H., Ibid. 30, 570-575 (1969).
7. Chovin, P., Carbon Monoxide., Environ. Research. 1, 198-216 (1967).
8. Christman, A.A., Randall, E.L., J. Biol. Chem., 102, 595-609 (1933).
9 . Clayton, G.D., Cook, A and Fredrick, W.G., Am. Ind. Hyhg. Ass.j., 21, 46-54 (1960),
10. Collison, H.A., Rodkey, F.L., O'Neal, J.D., Clin. Chem., 14, 162 (1968).
11. Comite Sur Les Defis de la Societe Moderne., Pollution Atmospherique Criteres
de Qalite de l'air Pour l'oxyde de Carbone, Autres Publications de L' OTAN/CDSM,
No 10, Juin (1972).
12. Comite Sur Les Defis de la Societe Moderne., Pollution Atmospheric, Rapport
du Comit OTAN/CSSM, Octobre (1972).
13. Commins, B.T., Lawther, D.J., Brit. J. Industr. Med., 22, 139-143 (1965).
14. de Bruin, A., Arch Environ Health. 15, 384-389 (1967).
15. Dubois, P.K., Geiling, E.M.K., Textbook of Toxicology, Oxford University Press,
68 Nevin VURAL, Zeynep MOTACEDED
16. Feldstein, M., Klendshoj, N.C., Journal of Forensic Sciences, 2, 39-58 (1957).
17. Gray, C.H. Sandiford, M., Analyst, 71, 107 (1946).
18. Heyndrickx, A., Scheiris Ch., Vercruysse, A., Okkerse, E., Journal de Pharmacie
de Belgique. 247-258 (1966).
19. Jacobs, M.B., The Analtical Chemistry of Industrial Poisons Hazards and Solvents,
S: 402-410, 2. edition, revised and Enlarged, Interscience Publishers, NewYork (1949)
20. Knight, R.A., Ephraim, D.C., Payne, F.E., SG'AN, 3, 15-19 (1973).
21. Lundquist, F., Methods of Forencis Science Volume I, Interscience Publisher, 539-
592 (1962).
22. Lüderitz, P., Z. Ges. Hyg., 17, 645-646 (1971).
23. Müezzinoğlu, A., Carbon Monoxide Pollution Problem in Ankara, A Master Thesis,
METU (November 1976).
24. Purves, M. J., "Measurement of The Gas Content of Blood Samples Using Gas
Ch-romatography", Ciba Foundation of Gas Chromatography in Biology and Medicine, Ed. R. Porter, J. and A. Churchill Ltd., London, 113-120 (1969).
25. Ramsey, J.M., Dayton, M.S., Arch. Enciron. Health. 15, 580-583 (1967).
26. Rodkey, F.L., Annals of The NewYork Academy of Sciences, 174, 261-267 (1970).
27. Snedecor, W.G., Cochron, W.G., Statistical Methods VI. Editioıı. The Iowa State
