Ankara Üniv Vet Fak Derg, 60, 209-212, 2013
Investigations on pleiotropy and genome wide association analyses by
random effects using QTL-MAS 2010 dataset
Burak KARACAÖREN
Akdeniz Üniversitesi, Ziraat Fakültesi, Zootekni Bölümü, Antalya, Türkiye.
Summary: Recent advances in molecular genetics have provided hundreds of thousands of single nucleotide polymorphisms to detect mutations at the vicinity of genes related with quantitative traits. Breeding values could be used as response variable in mixed model framework to detect possible associations with genomic relationship matrix. It is known that most of quantitative traits are correlated which leads to construct of networks and pathways of genes due to pleiotropy. Hence the main aim of this paper is to a) detecting pleiotropy by principal component analyses methods b) prediction of genomic breeding values by ridge regression c) detecting associations based on predicted genomic breeding values obtained from b) using QTLMAS 2010 simulated dataset. Most of the Quantitative Trait Locus (QTLs) were located at chromosome 1 and 3. Highest correlation between true breeding value and predicted breeding value were obtained by Gaussian Kernel function as 0.557. To detect pleiotropy we used first and second principal components as response variable and success rates found to be 0.2727 and 0.1714 and error rates found to be 0.5952 to 0.6400 for first two principal component loadings respectively. Using genomic breeding values as response variable gave better success rate and lower error rate compared with when using raw phenotypes. We found that using the most heritable and variable component (first component) had higher change to detect pleiotropic genes using QTLMAS-2010 dataset.
Keywords: Breeding values, genome wide association analyses, genomic selection, pleiotropic genes.
Rassal etkiler kullanılarak yapılan genom tabanlı ilişki ve pleiotropi analizi için QTL-MAS 2010 veri seti üzerine incelemeler
Özet: Moleküler genetikteki son gelişmeler fenotipler ile ilişkili olabilen başkalaşımların: yüz binlerce tekil nükleotit polimorfizmi ile saptanmasına olanak tanımıştır. Damızlık değerlerin karışık modellerde cevap değişkeni olarak kullanılması ile genom tabanlı ilişkiler tespit edilebilir. Pleiotropi nedeni ile farklı fenotipler birbirleri ile bağıntılı olabilmekte ve böylece gen ağları oluşturulabilmektedir. Dolayısı ile bu çalışmanın amaçları a) pleiotropinin temel bileşenler analizi ile tespiti b) Ridge regresyonu kullanarak genomik damızlık değerlerin tahmini ve c) b)’den elde edilen damızlık değerler ile ilişki analizini benzeşim yolu ile elde edilmiş QTLMAS 2010 veri seti ile yapmaktır. Verimden sorumlu bölge (QTL)’lerin büyük çoğunluğu 1 ve 3. kromozomlarda bulundu. Gerçek ve tahmin edilen damızlık değerler arasındaki en yüksek korelasyon Gausçu çekirdek ile bulundu (0.557). Birinci ve ikinci temel bileşenler ile pleiotropi tespitinde başarı oranları 0.2717 ve 0.1714; hata oranları ise 0.5952 ve 0.6400 olarak bulundu. Genomik damızlık değerlerinin cevap değişkeni olarak kullanılması fenotiplerin kullanımına oranla daha yüksek başarı oranı ve daha düşük hata oranları verdi. Pleiotropik genlerin tespitinde kalıtım derecesi ve çeşitliliği en yüksek olan ilk temel bileşenin kullanılması QTLMAS 2010 veri seti için daha iyi sonuç vermiştir.
Anahtar sözcükler: Damızlık değerler, genom tabanlı ilişki incelemesi, genomik seçilim, pleiotropik genler.
Introduction
A mixed model is a mathematical model including both fixed and random effects and used in many applications including prediction of genomic breeding values (12) and prediction of longitudinal breeding values (9). After taken into account the random and fixed effects from observations remaining random effects could give useful information regarding underlying phenomena.
Recent advances in molecular genetics have provided hundreds of thousands of Single Nucleotide Polymorphisms (SNPs) to detect mutations at the vicinity
of genes related with quantitative traits. Undetected shared ancestry within samples of animals could lead to detect false genomic signals in association mapping (8). Although pedigree based relationship matrix could be used to introduce ancestral correlations into the mixed model equations; genomic relationship matrix could also be used to accomplish the aim. Remaining solutions: breeding values could be used as response variable in mixed model framework to detect possible associations.
It is known that most of quantitative traits are correlated which leads to construct of networks and pathways of genes (6). Such phenotypic correlations can
210 arise from component a loadings tha pleiotropy am Hence t pleiotropy by prediction of (3) c) detecti breeding val simulated da Data: T 2326 anima generation phenotypes breeding val population). (5 males and and gave bir were forced investigate to were simulat Nucleotide P chromosome simulated on QTL position Set of oth chromosome QTL located dataset could 2011). Genome Genomic Br perform geno where y cont is the additi incidence ma
Va
For the coefficient o animals; I is variance and were used to sampling sch QTL to the to rate (ratio o positions) as QTLs by if t true QTL pos pleiotropic analyses (4, at combines u mong differenthe main aim y principal co f genomic bree ing associatio ues obtained ataset(16). Material The pedigree als for quan (n=900) we but with ge lues condition The number d 15 females). rth approxim to be nearly d o pleiotropy t ted. The geno Polymorphism es. The two
chromosome ns were simu her QTL po e 1 with tiny d at chromoso d be found a e Wide Assoc reeding Value
ome wide asso
y = Xb + Z
tains the obser ive genetic e atrices, and e i
⎟⎟
⎠
⎞
⎜⎜
⎝
⎛
e
a
Var
~⎢
⎢
⎣
⎡
N 0
e randomeffec of coancestry an identity m d 2e is the r o compare the hemes; the s otal number o f false positiv s was defined they were loc sition. effect of 7) could be underlying re nt quantitative of this paper omponent ana eding values b ons based on p from b) using and Method included four ntitative trait. ere also sim enotypes to nal to their a of population . Each female ately 30 prog discrete hence two geneticall ome consisted ms (SNPs) d major QTL 3 and a set of ulated on chro ositions wer effects and la ome 5. More at (Szydlowsk ciation Analys es: We used ociation analy Za + e rvations, b is t effect, matric is a vector con⎜⎜
⎝
⎛
2;
σ
aI
0
A
0
cts, it is assum y obtained fr atrix, 2a is th residual varia association r success rate of simulated Q ves to the nu d by (13). W ated within 1 B genes. Prin used to disc elationships h traits. r is to a) detec alyses method by ridge regres predicted geno g QTLMAS 2 ds r generations . Additional mulated wit predict geno ancestors (trai n founders wa e mated only geny. Generat e over-lapping ly correlated t d of 10031 Si distributed ov L positions w f other interme omosome 1 an re simulated astly there wa details about ki and Paczynses and Predic
mixed mode yses (3);
(1) the fixed effec ces X and Z ntainingresidu
⎥
⎥
⎦
⎤
⎟⎟
⎠
⎞
2 eσ
0
, med that A is rom genotyp he additive gen ance. Two criesults by diffe (ratio of map QTL) and the umber of repo We judged map Mb distance f Burak Karacaöre cipal cover hence cting ds b) ssion omic 2010 with last thout omic ining as 20 once tions g. To traits ingle ver 5 were ediate nd 2. on as no t the nska, cting el to cts, a Z are uals. s the e of netic iteria ferent pped error orted pped from pred valu Exp to h mod be s met with anal with
y ,
1 prop,
1x
mul plei heri min anal Iden in t 0.40 load coan eige (0.7 resp anal met valu vari 1 an whi false rate geno plei as re and for f RRB and en We used r diction (RRB ues with diffe ponential mod has same vari del assumes t scaled in [0 ric. Exponen h Gaussian mo Principal co lyses used to o py
y
y
=
=
=
2 1 h the coeff py
y
,
,
,
2K
portions of the,
,
,
2x
px K
ltivariate ph otropy (17). itabilites and t Quality Connor allele freq lyses. We ex ntity By State he dataset. W 017 using fi dings based ncestry matr envalues (in br 7516) for fir pectively. Association lyses were c hod using mo ues and princ iables. Most o nd 3. We did ch is indicativ e positives. Su found to b omic breeding otropy we use esponse variab 0.1714 and e first two princ
Predicted G BLUP to pred correlation ridge regress BLUP) to p erent kernel fu dels. In RRBL iance on the that distances 1] interval an tial model ha odel but not in
omponent anal orthoganize th p p
x
a
a
x
a
x
a
x
a
x
a
+
+
+
M
2 1 1 22 1 21 12 1 11 ficients (a) account for e total varianc (4). We use henotypes (l Loadings to detect assoc Resul ntrol: We ex quency <1%, xcluded 8 in (IBS) (>95% We estimated irst and secoon mixed m rix (1). Exp rackets) were rst and seco Analyses: A onducted by odel (1) and w cipal compon of the QTLs w not detect an ve of the mod uccess rate fo be 0.1714 ba g values as re ed first and se ble and succe error rates fou cipal compone
Genomic Bre
dict genomic b between true
sion best lin predict genom unctions (3): LUP each ma trait concern between gen nd measured as also same n quadratic for lyses: Principa he phenotypic p p p
a
x
a
x
a
x
+
+
+
+
+
+
K
K
K
2 2 2 1 2 being chos most of the ce of the origi ed linear com loadings) fo were used ciations. lts xcluded 263 leaving 9768 ndividuals w %) leaving 231 heritability a ond principa model (1) us lanatory prop 0.6240 (1.24 ond principal A genome wid generalized we used geno nent loadings were located at ny QTL on ch el perform we ound to be 0.3 ased on mod esponse variab cond principa ess rates found und to be 0.59 ent loadings re eeding Value breeding valu e and predic near unbiased mic breeding Gaussian and arker assumed ned. Gaussian notypes could by Euclidean e assumptions rm. al components space; p pp p p p px
x
x
sen so that e explanatory inal variables, mbinations of or detecting to estimate SNPs due to SNPs in the with too high 18 individuals as 0.4239 and al component sing genomic portions and 84) and 0.376 components de association least squares omic breeding as response t chromosome hromosome 5 ell in terms of 240 and error del (1) using ble. To detect al components d to be 0.2727 952 to 0.6400 espectively. es: We used ues of animals cted genomic d g d d n d n s s t y , f g e o e h s d t c d 6 s n s g e e 5 f r g t s 7 0 d s cAnkara Üniv Vet Fak Derg, 60, 2013 211
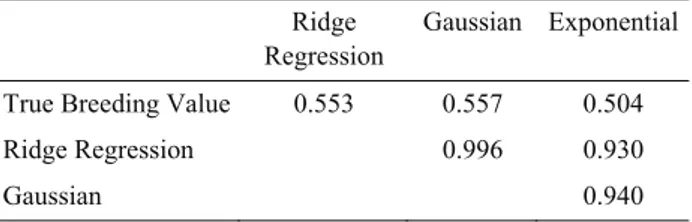
breeding values were found to be 0.703. To predict genomic breeding values of individuals of last generation we used Gauss and Exponential kernel functions (Table 1). Highest correlation between true breeding value and predicted breeding value were obtained by Gaussian Kernel function as 0.557.
Table 1: Correlations between true and predicted breeding values with different kernel functions: ridge regression, Gaussian and exponential models for last generation.
Tablo 1: Son kuşak için değişik çekirdek işleçleri ile( ridge regresyon, Gausçu, ve üssel modeller) elde edilen gerçek ve tahmin edilmiş damızlık değerler arasındaki korelasyonlar.
Ridge Regression
Gaussian Exponential True Breeding Value 0.553 0.557 0.504
Ridge Regression 0.996 0.930
Gaussian 0.940
Discussion
We combined quantitative and qualitative (binary) traits using a multivariate data reduction method to obtain linear combinations of them. We assumed that underlying hidden structure could be correlated with common genes hence pleiotropy. (14) found that principal component of the quantitative phenotypes and the residual of a logistic regression of the binary phenotypes may be an optimal method to combine quantitative and binary trait to reduce the dimension from multivariate to univariate dataset.
Quantitative trait was simulated with 0.39 heritability and binary trait was simulated with 0.52 heritability whereas we estimated the heritability to be 0.4239 and 0.4017 by first and second principal component loadings using genomic coefficient matrix. Estimates of heritability of first component were found to have slightly higher compared with the estimates of heritability of second components. Again first principal component had higher explanatory proportion (0.6240) compared with the second one (0.3760). Success rate were found higher (0.2727) using first principal component compared with second one (0.1714) and again error rate were found smaller using first principal component (0.5952) compared with when second principal component used as response variable (0.6400). (2) did not able to detect pleiotropic genes using principal component analyses. However they noted that failure of principal component analyses to detect pleiotropic genes might related with sampling from population and/or trait-specific genes. Although we found that using the most heritable and variable component (first component) had higher change to detect pleiotropic genes; (11) suggested to use multivariate regression to include number of principal components.
(17) found that detecting probability of pleiotropy would be much higher when residuals from principal component analyses used when environmental covariates exist.
We used RRBLUP to predict breeding values of animals and correlation between true and predicted breeding values were found to be 0.703. RRBLUP assumes that all markers have effect on trait with equal variances. However Bayes type methods (15) assume different priors hence different marker effects over genome. Since, in reality, most of traits affected by limited number of loci with various effect sizes Bayes type model could give better results compared with RRBLUP.
Using genomic breeding values as response variable gave better success rate (0.3240) and lower error rate (0.1714) compared with when using raw phenotypes (10) (success rate 0.3000; error rate 0.2900) in association model. Generalized least square method with estimated breeding values gave better success rate (0.3240) and lower error rate (0.1714) compared with our previous model; GRAMMAR(Genome-wide rapid association using mixed model and regression) using pedigree information(8) with phenotypes (success rate 0.1400; error rate 0.4400). (5) suggested using predicted breeding values as response variable for genomic prediction.
We used 3 different models to predict breeding values of last generation without phenotypes (Table 1). All 3 models had higher correlations within each other (ranged from 0.9300-0.9960). Highest correlation with true breeding values was obtained by Gaussian kernel (0.5570) although Ridge Regression with realized relation matrix had similar correlations (0.5530). (3) also obtained similar results for predicted breeding values using RRBLUP and Gaussian kernel in maize dataset.
References
1. Aulchenko YS, Ripke S, Isaacs A, van Dujin, CM (2007): GenABEL: An R library for genome-wide association analysis. Bioinformatics, 23, 1294-1296. 2. Bensen JT, Lange LA, Langefeld CD, Chang BL,
Bleecker ER, Meyers DA, Xu J (2003): Exploring
pleiotropy using principal components. BMC Genet,
4,S53.
3. Endelman JB (2011): Ridge regression and other kernels for genomic selection with R package rrBLUP. Plant Gen,
4,250–255.
4. Everitt BS, Landau S, Leese M (2001): Cluster Analysis. National Academy Press, Washington, DC.
5. Guo G, Lund MS, Zhang Y, Su G (2010): Comparison between genomic predictions using daughter yield deviation and conventional estimated breeding value as response variables. J Anim Breed Genet, 127,423–432. 6. Hill GW, Zhang SX (2012): On the pleiotropic structure
of the genotype-phenotype map and the evolvability of complex organisms. Genetics, 3 Jan 2012(doi: 10.1534/genetics.111.135681).
Burak Karacaören 212
7. Karacaören B, Kadarmideen H (2008): Principal component and clustering analyses of functional traits in swiss dairy cattle. Turk. J. Vet. Anim. Sci, 32, 163-167. 8. Karacaören B, Silander T, Alvarez-Castro MJ, Haley
CS, de Koning DJ (2011): Association analyses of the
MAS-QTL dataset using GRAMMAR, principal components and Bayesian network methodologies. BMC Proc, 5 (Suppl 3), S8
9. Karacaören B, Janss L LG, Kadarmideen HN (2012): Predicting breeding values in animals by kalman filter: application to body condition scores in dairy cattle. Kafkas Univ Vet Fak Derg, 18, 627-632.
10. Karacaören B (2012): Some observations for discordant sib pair design using QTL-MAS 2010 dataset. Kafkas Univ Vet Fak Derg, 18:857-860.
11. Mei H, Chen W, Dellinger A, He J, Wang M, Yau C, Srinivasan SR, Berenson GS (2010):
Principal-component-based multivariate regression for genetic association studies of metabolic syndrome components. BMC Genetics, 11:100.
12. Meuwissen THE, Hayes BJ, Goddard ME (2001): Prediction of total genetic value using genome wide dense marker maps. Genetics,157,1819–1829.
13. Mucha S, Pszczola M, Strabel T, Wolc A, Pacynska P, Szydlowski M (2011): Comparison of analyses of the
QTLMAS XIV common dataset. II: QTL analysis. BMC Proc, 5 (Suppl 3), S2.
14. Mukhopadhyay I, Saha S, Ghosh S (2011): Integrating binary traits with quantitative phenotypes for association mapping of multivariate phenotypes. BMC Proc, 5,S73. 15. Pszczola M, Strabel T, Wolc A, Mucha S, Szydlowski
M (2011): Comparison of analyses of the QTLMAS XIV
common dataset. I: genomic selection. BMC Proc, 5(Suppl 3),S1.
16. Szydlowski M, Paczynska P (2011) QTLMAS 2010: Simulated dataset. BMC Proc, 5 (Suppl 3), S3.
17. Wang X, Kammerer CM, Anderson S, Lu J, Feingold E (2009): A comparison of principal component analysis and factor analysis strategies for uncovering pleiotropic factors. Genet Epidemiolgy, 33, 325-331.
Geliş tarihi: 19.07.2012 / Kabul tarihi: 15.02.2013
Address for correspondence:
Burak Karacaören
Akdeniz Üniversitesi, Ziraat Fakültesi, Zootekni Bölümü, 07059, Antalya, Türkiye. e-mail: [email protected]