EPIGENETIC REGULATION OF SLIT-ROBO PATHWAY IN
HEPATOCELLULAR CARCINOMA
A THESIS SUBMITTED TO
THE DEPARTMENT OF MOLECULAR BIOLOGY AND GENETICS AND THE INSTITUTE OF ENGINEERING AND SCIENCE OF
BILKENT UNIVERSITY
IN PARTIAL FULFILLMENT OF THE REQUIREMENTS FOR THE DEGREE OF MASTER OF SCIENCE
BY FATĠH SEMERCĠ JULY 2009
ii
TO MY PARENTS & MY BROTHER, GÜNER – AHMET&ORHAN SEMERCİ FOR THEIR LOVE AND SUPPORT
iii
I certify that I have read this thesis and that in my opinion it is fully adequate, in scope, and in quality, as a thesis for the degree of Master of Science.
____________________
Assist.Prof. Dr.Tamer Yağcı
I certify that I have read this thesis and that in my opinion it is fully adequate, in scope, and in quality, as a thesis for the degree of Master of Science.
____________________
Assoc.Prof. Dr.Hilal Özdağ
I certify that I have read this thesis and that in my opinion it is fully adequate, in scope, and in quality, as a thesis for the degree of Master of Science.
_____________________
Assist.Prof. Dr.Özlen Konu
Approved for the Institute of Engineering and Science
____________________ Prof. Dr. Mehmet Baray
iv
ABSTRACT
EPIGENETIC REGULATION OF SLIT-ROBO PATHWAY IN
HEPATOCELLULAR CARCINOMA
Fatih Semerci
MSc, in Molecular Biology and Genetics Supervisor: Assist. Prof Tamer Yağcı
July, 2009 52 pages
Hepatocellular carcinoma is an aggressive, chemotherapy-resistant cancer and the prognosis of affected patients is very poor. Therefore, unraveling molecular components of hepatocarcinogenesis not only leads to the improvement of diagnostic and prognostic tools but also may reveal novel therapeutic targets. We previously defined the differential expression of SLIT-ROBO genes in HCC. To explore the mechanisms of the inactivation of these genes, we analyzed the hypermetylation of SLIT1, SLIT2, ROBO2 and ROBO3 genes in a group of HCC cell lines consisting of four high-AFP expressing well-differentiated (HUH7, Hep3B, PLC/PRF5 and HepG2) and low-AFP expressing poorly-differentiated cell lines (Focus, SKHep1, Snu387 and Snu423). We first demonstrated that the transcription of all studied genes can be rescued upon treatment of cell lines with 5-Aza-2‟-deoxycytidine (5-Aza-dC). Next, we analyzed the methylation of SLIT-ROBO genes by methylation specific PCR. All genes were found to be at least partially methylated, except ROBO3, which displayed a heavily methylated pattern. in silico analyses of the 5‟ upstream sequence of ROBO2 gene revealed a putative promoter region, an enhancer in the first intron and a CpG island. Methylation –specific PCR amplification of ROBO2 by using primers selected from this CpG island supports the potential of this region as a gene regulatory site. Therefore, it is worthy to extend the methylation analyses of SLIT-ROBO pathway in HCC patients. Furthermore, mechanistic studies on ROBO3, which was shown to counteract the overexpressed ROBO1 effects may shed light into the role of ROBO3/ROBO1 axis and the potential of ROBO3 as a tumor suppressor gene in HCC.
v
ÖZET
SLIT-ROBO YOLAĞININ HEPATOSELLÜLER KARSĠNOMADA EPĠGENETĠK DÜZENLENMESĠ
Fatih Semerci
Moleküler Biyoloji ve Genetik Yüksek Lisansı Tez Yöneticisi: Yrd.Doç. Dr. Tamer Yağcı
Temmuz 2009, 52 Sayfa
Hepatoselüler karsinoma kemoterapiye dayanıklı, saldırgan ve kötü prognozla seyreden bir kanser türüdür. Bu yüzden HCC‟nin ilerlemesinde etkisi olan moleküler bileşenlerinin ortaya çıkarılması sadece teşhis ve takip araçlarının iyileşmesine katkıda bulunmakla kalmayıp, yeni tedavi hedefi olabilecek moleküllerin bulunmasına da olanak sağlayabilir. Daha önce grubumuz tarafından SLIT-ROBO genlerinin hepatoselüler karsinomada farklı ifade örüntülerine sahip oldukları gösterildi. Bu genlerin etkisizleştirilmesinde rol alan mekanizmalarına ait detayları öğrenebilmek için SLIT1, SLIT3, ROBO2 ve ROBO3 genlerinin aşırı metillenme durumlarını 4 adet AFP ifadesi yüksek- iyi farklılaşmış (Huh7, Hep3B, PLC/PRF5 ve HepG2) ve 4 adet AFP ifadesi düşük- az farklılaşmış (SKHep1, FOCUS, Snu387 ve Snu423) karaciğer kanseri hücre hattında araştırdık. İlk olarak, araştırılan bütün genlerin ifadelerini 5-Aza-dC kullanılarak arttırılabileceğini gösterdik. Daha sonra, SLIT- ROBO genlerinin metillenme durumlarını metilasyona özel PCR reaksiyonu ile araştırdık. Araştırılan bütün genlerin en azından kısmi olarak metillenmiş oldukları, buna ek olarak da ROBO3 geninin aşırı metillendiğini gösterdik. in-silico araştıma sonuçları ROBO2 geninin 5‟ ucunun yukarısında yer alan bölgelerin potansiyel bir CpG adacığı, birinci intron içerisinde bir yükseltici, ve bir promotör bölge içerdiğini ortaya çıkardı. Bu CpG adacığına ait primerler kullanılarak yapılan PCR reaksiyonları bu bölgenin bir gen düzenleyici alan olduğunu destekledi. Dolayısıyla, SLIT- ROBO yolağının metilasyon analizlerinin HCC hastalarında da araştırmak yerinde olacaktır. Bunun yanında aşırı ifade edilen ROBO1‟e zıt bir etki gösteren ROBO3 geniyle yapılacak mekanistik çalışmalar ROBO3/ROBO1 ekseninin rolünü aydınlatabilecek ve ROBO3‟ün HCC‟de bir tümör baskılayıcı gen olma potansiyeline ışık tutabilecektir.
vi
ACKNOWLEDGEMENTS
It is a pleasure for me to thank the many people who made this thesis possible…
First and foremost, I would like to thank my thesis advisor Assist. Prof Tamer Yağcı for his supervision and guidance throughout this study. I am grateful for his patience, motivation, enthusiasm, and immense knowledge in molecular biology that, taken together, make him a great mentor.
I am really very lucky for meeting M. Ender Avcı who was my second advisor. He was very good teacher and I learned him a lot about the laboratory techniques. He has provided assistance in numerous ways during my experiments. Not to mention that he has been a great friend outside the laboratory.
I want to thank also to Dr. Hani Alotaibi, for sharing his experience in cloning and providing the vectors for this study.
I have been very happy to be a member of Bilkent MBG family. It would be very difficult to find such a lovely people in such a peaceful environment. I am very grateful to all my friends for whom I need a chapter to mention all. Nevertheless, my special “big thanks” go to Muammer Üçal, Ahmet Raşit Öztürk, Erdem Erikçi, Kutay Karatepe, Tamer Kahraman, Onur Kaya, Ceyhan Ceran, Ceren Sucularlı, Şerif Şentürk, Tolga Acun and Sinan Gültekin for their sincere friendship.
Also I want to thank all MBG supervisors Doç. Dr. Ali Güre ,Dr. Özlen Konu, Dr. Uygar Tazebay, Doç. Dr. Işık Yuluğ, Prof. Dr. Tayfun Özçelik, Dr. İhsan Gürsel, Dr. Cengiz Yakıcıer , Dr. Can Akçalı, Dr. Rengül Çetin-Atalay, Dr. Mehmet Öztürk for knowledge and experience they shared through my undergraduate and graduate years.
Last but not least, I wish to thank my parents and my brother. It is impossible to express my endless love and thanks to my family. I will forever grateful to them. I dedicate this thesis to them…
vii TABLE OF Contents
DEDICATION PAGE ... ii
SIGNATURE PAGE ... iii
ABSTRACT ... iv
ÖZET ... v
ACKNOWLEDGEMENTS ... vi
TABLE OF CONTENT ... vii
LIST OF FIGURES ... ix LIST OF TABLES ... x ABBREVIATIONS ... xi CHAPTER 1 INTRODUCTION: ...1 1.1 Hepatocellular Carcinoma: ...1 1.2 CpG Methylation: ...1
1.2.1 Cancer and DNA Methylation:...3
1.3 SLIT-ROBO Family:...5
1.3.1 Role of SLIT ROBO in the Guidance of Commissural Axons: ...5
1.3.2 ROBOs and SLITs Role in Other Developmental Steps: ... 10
1.3.2 ROBO-SLIT Family and Cancer ... 11
2. AIM OF THE STUDY ... 13
CHAPTER 3 MATERIALS AND METHODS ... 14
3.1 MATERIALS ... 14 3.1.1 Reagents ... 14 3.1.2 Bacterial Strains ... 14 3.1.3 Enzymes ... 14 3.1.4 DNA Markers ... 14 3.1.5 Oligonucleotides... 14 3.1.6 Plasmids ... 14
3.1.7 Electrophoresis, photography and spectrophotometer ... 14
3.1.8 Tissue culture reagents and cell lines ... 15
3.1.9 Transfection reagents ... 15
3.1.10 Kits ... 15
3.2 SOLUTIONS AND MEDIA ... 15
3.2.1 General solutions ... 15
3.2.2 RNA solutions ... 16
3.2.3 Microbiological media, reagents and antibiotics ... 16
3.2.4 Tissue culture solutions ... 16
viii
3.3.1 General methods ... 17
3.3.2 Tissue culture techniques ... 19
3.3.3 cDNA synthesis ... 21
3.3.4 Primer design for Cloning and MS-PCR ... 21
3.3.5 Fidelity and DNA contamination control in first strand cDNAs ... 24
3.3.6 Methylation Specific PCR ... 24
3.3.7 Cloning Strategies for ROBO2 Putative Promoter and Enhancer: ... 24
3.4 Quantitative real time RT-PCR ... 25
3.5 Computer Analysis: ... 26
3.6 Sequencing of Constructs: ... 27
CHAPTER 4 RESULTS ... 28
4.1 Identification of ROBO-SLIT Family Genes Methylation Status and Expression Patterns: ... 28
4.1.1 Mutation Database Scanning of ROBO-SLIT Family: ... 28
4.1.2 Identification of ROBO2 Gene Regulatory Sequences: ... 28
4.1.3 Putative Promoter Site is Evolutionary Conserved ... 31
4.1.4 Identification of Putative CpG Islands of Other ROBO and SLIT Family Genes: ... 31
4.1.4 5-Aza-dC Treatment of HCC Cell Lines and Real Time PCR Analysis of ROBO- SLIT Family Genes in HCC Cell Lines: ... 32
4.1.5 Bisulfite Treatment of HCC Cell Lines and MS-PCR ... 33
4.2 Cloning of ROBO2 Gene Regulatory Sequences (Promoter &Enhancer): ... 34
4.2.1 Cloning of Different Fragments of Putative Promoter into pGL3 Luciferase Reporter Vector ... 34
4.2.2 Luciferase Assay for F1, F2, F3, F4 vectors ... 36
5. DISCUSSION AND FUTURE PERSPECTIVES: ... 40
Future Perspectives: ... 43
References: ... 44
ix
LIST OF FIGURES
Figure 1.1: Mechansims of CpG Methylation and types of DNMTs………..2
Figure 1.2: Outgrowth of commissural axons...………5
Figure 1.3: General structure of SLIT-ROBO proteins and phylogenetic trees………...6
Figure 1.4: A model for sorting of Robo by Comm………..………..…8
Figure 1.5: Proposed model for ROBO3 antagonizing ROBO1………9
Figure 1.6: Uteric bud formation……….10
Figure 4.1: CpG island prediction results of ROBO2 gene………..28
Figure 4.2: Predicted TF binding sites and weight points in ROBO2 putative promoter…….28
Figure 4.3: Localization of ROBO2 primers in putative promoter region…………...………29
Figure 4.4: CLUSTALW output of Robo2 putative promoter sequence comparison………..32
Figure 4.5: Real-Time PCR results of expression patterns of ROBO-SLIT family genes in 5-Aza-dC treated cells ……….... 30
Figure 4.6: Methylation Specific PCR of ROBO2, ROBO3, SLIT1 and SLIT3 genes………..31
Figure 4.7: pGL3-basic Luciferase Reporter vector circular map………33
Figure 4.8: Map of multiple cloning site of pGL3-basic vector………34
Figure 4.9: Gel photo of F1, F2, F3, and F4 inserts………..34
Figure 4.10: Diagnostic restriction of F1, F2, F3, and F4 vectors………..35
Figure 4.11: Luciferase assay results of transfection of F1, F2, F3, and F4 vectors……….. 36
Figure 4.12: Map of putative enhancer region of ROBO2 gene………..37
Figure 4.13: Gel photos of enhancer and F1, F2, F3, F4 for e1b-pGL3 inserts………..38
x
LIST OF TABLES
Table 1.1: Tumor suppressor genes that are hypermethylated in tumors……….4 Table 3.1: List of Primers……….22, 23, 24 Table 3.2 Primer Efficiencies & Product Sizes for Real Time PCR Primers……….…..25
xi
ABBREVIATIONS
Amp ampicillin
bp Base Pairs
BSA Bovine serum albumin
cDNA Complementary DNA
Ct Cycle Threshold
ddH2O Double distilled water
DEPC Diethylpyrocarbonate
DMEM Dulbecco‟s Modified Eagle‟s Medium
DMSO Dimethyl Sulfoxide
DNA Deoxyribonucleic Acid
dNTP Deoxyribonucleotide triphosphate
ds Double strand
dsDNA double-stranded DNA
EDTA ethylenediaminetetraacetic acid
EtBr Ethidium Bromide
FBS Fetal Bovine Serum
GAPDH glyceraldehyde-3-phosphate dehydrogenase
HBV Hepatitis B Virus
HCC Hepatocellular Carcinoma
HCV Hepatitis C Virus
HDAC histone deacetylase
LB Luria-Bertani media μg Microgram mg Miligram min Minute μl Microliter ml Mililiter μM Micromolar mM Milimolar
mRNA Messenger RNA
NaCl Sodium Chloride
Oligo(dT) Oligodeoxythymidylic acid
xii
PCR Polymerase Chain Reaction
pmol Picomole
PTEN Phosphatase and Tensin homolog qRT-PCR Quantitative real time RT-PCR
RNA Ribonucleic acid
Rpm Revolutions Per Minute RT PCR Reverse Transcription PCR
Sec Second
TAE Tris-Acetate-EDTA buffer
Tm Melting Temperature
Tris Tris (Hydroxymethyl)- Methylamine
UV Ultraviolet
1
CHAPTER 1 INTRODUCTION
:1.1 Hepatocellular Carcinoma:
The liver is the largest internal organ of the body. The physiological functions of liver can be summarized as follows: 1) Bile production and excretion 2) Excretion of bilirubin, cholesterol, hormones and drugs 3) Metabolism of proteins, fats and carbohydrates 4) Storage of glycogen, vitamins and minerals 5) Enzyme activation 6) Plasma protein (albumin and globulin) synthesis. 7) Blood detoxification and purification.
Hepatocellular Carcinoma (HCC) is the most frequent primary liver cancer. It is the fifth most common cancer world-wide and causes approximately 600,000 deaths per year (Llovet JM. et al., 2003). Hepatocarcinogenesis nearly always develops in the setting of chronic hepatitis or cirrhosis; conditions in which many hepatocytes are killed and inflammatory cells invade the liver and the connective tissue (Thorgeirsson SS and Grisham GW. et al., 2002). Chronic exposure to aflatoxin B1 and infection with hepatitis B virus, hepatitis C virus are responsible about 80% of all HCC in humans (Bosch FX. Et al., 1999). TGF-alpha and IGF-2 are the growth factors that are activated in response to hepatitis, infection with hepatitis B or C. This situation leads to increased proliferation of the cells with impaired G1/S checkpoint. Although this increased rate of proliferation is balanced by the loss of hepatocytes through apoptosis, it also results in the production of monoclonal populations of dysplastic hepatocytes (Thorgeirsson SS and Grisham GW. et al., 2002). During the preneoplastic stage, that may take 10 to 30 years to develop, additional changes occur like increased chromosomal abnormalities, loss of tumor suppressors, decreased expression of EGR1 and C/EBPα, and increased expression of FOXM1b. At later stages, increased expression of TGF-β is thought to be one of the main reasons of increased angiogenesis and metastasis (Greenbaum LE.et al., 2004).
1.2 CpG Methylation:
DNA methylation and other histone modifications are the key processes of the epigenetic regulation of the genome and they have crucial roles in the control of gene activity and nuclear architecture. Most widely studied epigenetic modification in humans is the CpG methylation. Presence of methylated cytosines in the genomic DNA is related to the chromosomal condensation, X inactivation, chromosome stabilization, genomic imprinting, and tissue specific silencing of the gene expression. This modification has a major role in the cell differentiation process of mammalian embryogenesis (Reik W., et al.,2001; Bacola. et
2
al.,1999) Potentially methylable CpG dinucleotides are not randomly distributed in the genome. They are condensed in the regions called CpG islands, which are mainly located in the gene regulatory sequences at 5‟ end region of the most genes (Esteller M., et al., 2007). In normal cells these regions are generally unmethylated and allow the transcription of genes in the presence of transcription factors. Contrary to this, repetitive genomic sequences are heavily methylated. The latter process has an important role in the protection of the chromosomal integrity by preventing chromosomal instability, translocations and gene disruption through the reactivation of endoparasitic sequences. (Esteller M., 2005; Walsh C.P., et al., 1998)
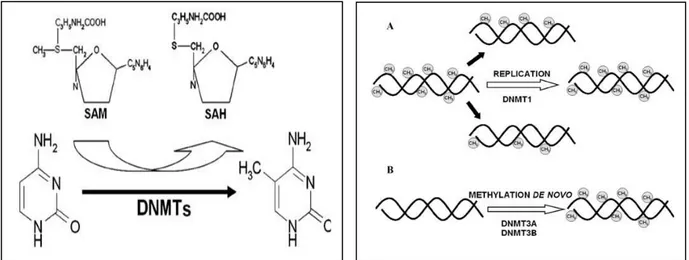
The methylation of mammalian genomic DNA is catalyzed by DNA methyltransferases (DNMTs) (Figure 1.1). DNMTs can be divided into two groups: Maintenance and de novo DNMTs. While maintenance DNMT1 binds methyl groups to the hemimethylated DNA during replication, de novo DNMT3A and DNMT3B add methyl groups to CpG dinucleotides of unmethylated DNA (Das P.M. et al., 2004).
Presence of m5CpG dinucleotides in DNA sequence directly inhibits transcription or recruits proteins that specifically recognize methylated DNA and initiate remodeling of euchromatin into heterochromatin structure. This euchromatin to heterochromatin transition contains the formation of the nuclease-resistant chromatin, methyl-CpG- binding proteins.
Figure 1.1 Methylation of cytosine within CpG dinucleotides is catalyzed by DNMTs. S-adenosylmethionine (SAM) donates methyl groups and is converted to S- adenosylhomocysteine (SAH).
Maintenance (A) and de novo DNMTs (B) methylate DNA. DNMT1 binds methyl groups to the hemimethylated DNA during replication, whereas DNMT3A and DNMT3B can add methyl groups to CpG dinucleotides of unmethylated DNA. (Luczak, M. W et al., 2006)
3
Methylated DNA recruits m5CpG- binding domain (MBD) proteins MeCP1 and MeCP2 that bind specifically to methylated DNA in whole genome and form barriers against the binding of the transcription factors to the promoters. MeCP1 represses heavily methylated regions (promoters containing more than 10 m5CpG dinucleotides), whereas MeCP2 can control the transcription of genes by binding to the single CpG dinucleotides that are symmetrically located in opposite DNA strands (Hendrich B, et al., 1998). Also, DNMTs are associated with histone deacetlyases (HDACs), histone methyltransferases (HMTs), HP1 which are key regulators of histone modification.(Wade, P. A. et al., 2001; Wang. Y. et al., 2004). Moreover DNMT3B additionally recruits the ATP dependent chromatin remodeling enzyme hSHF2H, which is involved in the heterochromatin formation. (Geiman TM, et al., 2004)
Methylation of CpG islands and then recruitment of the HDACS and other histone modifying enzymes is not the unique mechanism for epigenetic regulation of gene expression. Sometimes, histone modifications may favor or block the DNA methylation. In the fungus Neurospora, it has been shown that the ability to methylate histone Lys9 is required for DNA methylation (Jackson J. P., et al., 2002). This evidence suggests that local methylation of Lys9 may provide a signal for the methylation of the CpG islands in the close proximity. Also in different pathways, histone acetylation at promoters can lead to inhibition of DNA methylation (Mutskov V. J., et al., 2002).
1.2.1 Cancer and DNA Methylation:
Development of cancer may arise from either inherited mutations in the germ line cells or from changes in the DNA sequences of somatic cells during life. In turn, these sequence based changes either cause the activation of the protooncogenes or decrease the activity of the tumor suppressor genes. Additional to the sequence based mutations; epigenetic changes may also favor the development of cancer. Hyper/hypo-methylation of the promoter or the first exon of the cancer related genes is one of the common changes in the tumor cell genome. These epigenetic changes mimic the effect of the sequence based mutations in the tumor suppressor genes and protooncogenes.
1.2.1.1 Role of Hypomethylation of in Cancer Development:
Global hypomethylation of genomic DNA is a common feature of tumor cells and results in the overexpression of the protooncogenes, growth factors and genes related to invasion and metastasis (Szyf M, et al., 2004). For example, the expression of urokinase plasminogen activator (PLAU), heparanase, calcium binding protein (S100A4) and insulin-like growth factor 2 (IGF2), all known for their important role in the invasion and metastasis
4
of the tumors, is induced by hypomethylation (Senolt L. et al., 2006; Pakneshan P. et al.,2005 ).
Besides the protooncogenes, hypomethylation of retrotransposons also contribute to the progression of cancer by destabilization of the genome. This destabilization occurs via the insertional mutagenesis and recombination between non-allelic repeats (Jagodzinski P. P., et al., 2006). Heavy methylation of CpG islands in LINEs (Long interspersed nuclear elements) is a host defense against retrotransposon activation (Bestor. T. H., et al. 2000). Hypomethylation of LINEs was observed in colon cancer and chronic lymphatic leukemia(J. I. Goodman., et al, 2003).
Reasons of this global hypomethylation in malignant cell transformation are not clear. One hypothesis to explain this situation states that there is a complete or partial deficiency of numerous enzymes involved in methyl transport at the cellular level (Steele, W., C. Allegrucci, et al. 2005). But this hypothesis is not enough to explain the simultaneous hypermethylation of tumor suppressor genes promoter. Some findings suggest that overexpression of catalytic inactive variants of DNMT3B may shield CpG dinucleotides from active DNMTs (Weisenberger DJ et al., 2004).
1.2.1.2 Role of Hypermethylation of Tumor Suppressor Genes in Cancer Development: In many cancer types there has been a significant correlation between the protein biosynthesis of DNMT1, DNMT3B and hypermethylation of CpG islands that are located in the promoter regions of CDKN2A (cyclin dependent kinase inhibitor 2A), CDKN2B, CDH1 (E-cadherin), MLH1(mismatch repair gene), RB1 (retinoblastoma 1), TIMP3 (TIMP metallopeptidase inhibitor 3), BRCA1, PTEN, TP53. (Table 1.1)
Tumor Suppressor Gene Related Cancer Reference
CDKN2A Lymphoma Herman J. G. et al., 1995.
CDKN2B Leukemia Melki JR. et al., 1999.
CDH1 Breast, Prostate,Colorectal Darwanto A., et al., 2003. Graff JR., et al., 1995. BRCA1 Breast, ovarian Esteller M., et al., 2000
PTEN Colorectal Goel A., et al., 2004
MLH1 Colon Veigl ML., et al., 1998
RB1 Retinoblastoma Stirzaker C., et al., 1997
TIMP3 Colon, renal, brain Bachman KE., et al., 1999
5
1.3 SLIT-ROBO Family:
It has always been a big challenge to understand how so many neurons are connected to each other to form functional circuits in a precise manner. This problem has been divided into several distinct but interdependent developmental processes: neuronal identity specification, polarization of neurons, initialization of axonal and dendritic outgrowth, navigation of axons and dendrites towards their targets, and formation of the synaptic contacts (Dickson and Gilestro et al., 2004). These complex series of events constitute a major obstacle in understanding axonal outgrowth. However, guidance of commissural axons in both vertebrates and Drosophila by Slit(s) and their Robo family receptors offers us a good model to understand the basic steps in the axon patterning.
1.3.1 Role of SLIT ROBO in the Guidance of Commissural Axons:
Commissural neurons are born in the dorsal spinal cord and their axons are drawn to the midline by chemoattractant proteins netrin and sonic hedgehog, which emanate from the ventral midline. (Charron et al. 2003, Kennedy et al. 1994, Serafini et al. 1994) After crossing the midline, axons turn to contralateral side and continue to grow right alongside of the floor plate. (Figure 1.2) SLIT and ROBO family members act as repulsive cues in this process and prevent axons from recrossing the ventral midline.
Figure 1.2: (a) Spinal cord section from E 12.5 mouse embryo (b) “Open book” preparation, obtained by dissecting the spinal cord along the dashed line indicated in A. (c) Dorsal view of two segments of the ventral nerve cord, showing examples of intersegmental commissural (white) and ipsilateral (black) neurons. A, anterior; P, posterior; D, dorsal; V, ventral; L, lateral
(Dickson and Gilestro et al., 2004)
6
1.3.1.1 SLITs:
The Slit gene encodes a 190 kDa protein in the secreted form and is produced by the midline cells (Rothberg JM et al. 1988, 1990). Its mutant form was identified in the classic genetic screen for embryonic patterning (Nüsslein- Volhard et al., 1984) and commissural axon path finding defects (Hummel et al., 1999) in Drosophila. Further genetic (Battye R. et al. 1999; Kidd T. et al., 1999) and biochemical (Brose K. et al., 1999; Li HS. et al., 1999) studies revealed the role of Slit as the ligand of Robo. Mammals have three slit genes (Slit-1 Slit-2, and Slit-3) which are expressed by the midline cells as their homologue in Drosophila (Brose K. et al., 1999; Holmes GP. et al., 1998; Itoh A. et al., 1998; Li HS. et al.,1999; Yuan W. et al., 1999b). Disruption of all three Slit genes in mice leads to abnormalities in the axon crossing through the midline or completely stalls the crossing (Long H.et al., 2004). Also the studies in C. Elegans showed that SLT-1 (Slit homologue in C. Elegans) is expressed at high levels in anterior epidermis and embryonic expression of that gene provides anterior-posterior guidance information to migrating neurons (Hao JC. et al., 2001). All of these works indicate that Slit proteins has a conserved role as a repellent guidance cues for commissural axons. (Figure 1.3) a d c b e
7
Slit proteins share a common domain structure which consists of a series of four leucine rich repeats, seven to nine epidermal growth factors (EGF) like domains, a laminin G domain and a C terminal cysteine-rich domain (Figure 1.3). Most of the Slits are cleaved within the EGF-like region by unknown proteases (Brose K. et al., 1999; Wang KH. et al., 1999). It was proved that these proteolytic fragments of Slit protein have distinct activities in vitro like repelling of the olfactory bulb axons in collagen gel. This repelling also leads to olfactory bulb growth cones to collapse (Nguyen Ba-Charvet et al., 2001).
1.3.1.2 ROBOs:
Identification of Robo was based on the same type of works in the commissural axon guidance defected Drosophila embryos (Seeger M. et al., 1993). Too many axons have crossed the midline in the Robo mutant embryos (Kidd T et al. 1998a ; Seeger M. et al., 1993) Product of Robo gene is a cell surface protein that is expressed on the central nervous system axons (Kidd T. et al., 1998a). In Drosophila there are three robo genes (robo1 robo2 robo3) and in mammals there are four: Robo1 Robo2 Robo3 (also known as Rig-1) and Robo4 (Known as magic roundabout). All the vertebrate Robo genes, except Robo4, seem to be expressed in central nervous system.
Robo proteins have an extracellular domain comprising five immunoglobulin like and three fibronectin-III repeats with a single transmembrane segment and a cytoplasmic domain, which has no obvious catalytic activity (Kidd T. et al., 1998a). Exception to the general structure of Robo family is the magic roundabout that consists of two Ig domains and two FN3 domains. Slit binding site on the Robo proteins has been identified in the first two Ig domains (Liu Z. et al., 2004) that correspond to most conserved region in the Robo receptors (Figure 1.3).
The cytoplasmic domains of Robo receptors are not well conserved but they share four short conserved motifs. These motifs are named as CC0-3 and are thought to be sites of
Figure 1.3: Species abbreviations used: Ag, Anopheles gambiae; Ce, Caenorhabditis
elegans; Dm, Drosophila melanogaster; Dr, Danio rerio; Hs, Homo sapiens; Mm, Mus musculus. (a) Slit domain organization. Abbreviations used: aa, amino acids; LRR, leucine-rich repeat; EGF, epidermal growth factor–like repeat; lamG, laminin G domain; Cys, cysteine-rich domain. arrow head indicates cleavage site in vertebrates. (b) Robo domain organization Ig, immunoglobulin-like domain; FN3, fibronectin type 3 domain; TM, transmembrane region; CC0-3, conserved cytoplasmic motifs. (c) Phylogenetic analysis of Slit family proteins. (d) Phylogenetic analysis of Robo family, prepared by only using the extracellular sequences only. (e) Alignment of selected CC motifs with consensus sequences and binding partners. (Dickson and Gilestro et al., 2004)
8
interaction for various cytoplasmic signaling proteins. Ena/VASP proteins are one of these proteins and they bind to CC1 and CC2. Also SRC Homology Domain 2 and 3 (SH2 and SH3), adaptor Dock/Nck proteins bind to CC2 and CC3 motifs (Fan X et al. 2003). Rho family GTPase activating proteins Vilse/crGAP and srGAPS also bind to CC2 and CC3, respectively (Hu H. et al., 2005; Lundstorm A. et al., 2004; Wong K. et al., 2001). It is not clear how these signals interact with each other and repel the growth cone. Not all Robos have four CC domains. This in turn indicates that different Robos have different sets of cytoplasmic partners (Figure 1.3-e) and these different partners lead them to give different responses.
Three mammalian Robos (Robo1 Robo2 and Robo3) show a complex expression pattern in the neuronal populations. For example Robo1 and Robo2 levels are very low as the axons cross the midline and increase in crossed axons (Long H. et al.,2004). However Robo3 shows the opposite pattern which is high before crossing and low afterwards (Sabatier C. et al., 2004). This expression pattern brought about the following question: What is the mechanism that keeps Robo1 and Robo2 levels low in commissural axons during the midline crossing? The answer was found in the comm. (commissureless) gene (Tear G et al., 1996) that has been revealed in the same mutants that had allowed the identification of robo gene. In the comm mutants no axons cross the midline. This data suggested that normal function of Comm is to antagonize the Slit-Robo function and allow the midline crossing. Comm does this job by functioning as an endosomal sorting receptor for Robo (Keleman K. et al., 2002). Comm is localized in the Golgi and in late endosomes (Figure 1.4).
Figure 1.4: A model for sorting of Robo by Comm. (Dickson and Gilestro et al., 2004)
9
It can bind to Robo and recruit it to the endosomes. Without Comm Robo is normally transported down the axons but this transportation is blocked by Comm. In vertebrates, no homologues of Comm could be found. Instead of a vertebrate Comm, researchers found a surprising negative regulator of Slit-Robo signaling. This negative regulator is Robo3 (Rig-1) protein which was expected to function positively on the Slit signaling like other Robo‟s, but it did not. Robo3-/- embryos‟ commissural axons mimic the comm mutant phenotype and all of the commissural axons avoid the midline (Sabatier C. et al., 2004). Expression pattern of Robo3 revealed its expected role. Its expression is strictly restricted along the commissural axons but in an opposite manner of Robo1 and Robo2. Robo3 levels are high before crossing and low after crossing (Sabatier C. et al., 2004) (Figure 1.5). It is obvious that Robo3 allows crossing of the commissural axons by inhibiting Slit- Robo1 signaling.
Figure 1.5: Robo3 antagonizes Robo1 to allow crossing in mice. Model adapted from Sabatier et al. (2004). In pre-crossing commissural axons,
Robo3 levels are high, and Robo1 levels low. Robo3A is thought to inhibit Robo1-mediated repulsion in these axons (Sabatier et al. 2004) so that they are instead attracted to the floor plate by netrin-1 and sonic hedgehog. After crossing, Robo3 levels are low, and Robo1 levels high. Axons are now repelled by signaling of Slit through Robo1.In addition, attraction to netrin-1 may be downregulated, possibly owing to a Slit-dependent interaction between Robo1 and the netrin receptor DCC. (Dickson and Gilestro et al., 2004)
10
1.3.2 ROBOs and SLITs Role in Other Developmental Steps: 1.3.2.1 Kidney Bud Development:
Kidney development occurs along the body axis and it begins with the emerging of a single uteric bud from the nephric duct (Saxen L. et al., 1987). This emergence is a response to GNDF secretion from the adjacent nephrogenic mesenchyme (Moore M.W. et al., 1996). Important point in the correct positioning of the uteric bud is the restriction of GNDF expression to the posterior (Pachnis V. et al 1993). Anterior expansion of GNDF expression is correlated with supernumerary uteric bud formation (Kume T. et al., 2000). Grieshammer and colleagues have shown that inactivation of either Slit2 or Robo2 in mice leads to supernumerary bud development and that this is correlated with abnormal maintenance of Gndf expression in anterior nephrogenic mesenchyme (Grieshammer U. et al., 2004). Gndf dosage reduction in Slit2 -/- animals results in the rescue of this phenotype. (Figure 1.6)
1.3.2.2 Endothelial Cell Migration and Angiogenesis:
Robo4 is the most recently discovered member of the Roundabout family. It was identified in a data mining for endothelial specific genes (Huminiecki L.et al., 2000; 2002). Genes that belong to ROBO-SLIT family and expressed in the endothelial cells is not restricted to only ROBO4. Wu et al showed that Slit2 and Slit3 mRNAs but not Slit1 were expressed in the rat endothelial cells (Wu JY. et al., 2001). In 2008 Jones AC. and colleagues recognized the similarities between the angiogenic sprout and growing axon and found that Robo4 maintains the vascular integrity by inhibiting the pathologic angiogenesis and endothelial hyperpermeability. Inhibition of pathologic angiogenesis is through the inhibition
Figure 1.6: Uteric bud formation. GNDF expression is restricted to posterior by the act of SLIT2 triggered ROBO2. Inactivation of either the SLIT2 or ROBO2 leads to supernumerary bud formation because of the increased levels of GNDF expression in anterior. (Grieshammer et al., 2004)
11
of VEGF-165 by Robo4/Slit2 axis. This inhibition also decreases the permeability levels of the vascular network (Jones C.A. et al., 2008).
1.3.2 ROBO-SLIT Family and Cancer
Deletion and epigenetic inactivation of Slit-Robo genes have been identified in different cancers. Inactivation of Robo1 results in frequent mortality. Those that survive have developed bronchial hyperplasia (Xian J. et al., 2001). This result showed that Robo1 is a tumor suppressor gene. Real time PCR analysis of seven normal prostate and 48 prostate tumors has shown that Robo1 expression is downregulated in the prostate cancer (Latil A. et al., 2003). The DUTT1/ROBO1 gene was isolated from the U2020 region (Sundaresan V. et al., 1998a) and this region overlaps with the common deletion site in (NCI-H2196) SCLC cell lines. This deletion abrogates exon 2 of the gene.
Dallol A. and colleagues analyzed the DUTT1 gene expression in lung, breast and kidney tumor lines and the presence of mutations in lung, breast, kidney tumors and tumor cell lines. They didn‟t find any inactivating mutations but loss of expression in breast tumor cell lines was due to the promoter hypermethylation. 5-aza-2‟-deoxycytidine (5-Aza-dC) treatment rescued the expression of DUTT1 gene in this cell line. It was shown that SLIT2 is also epigenetically inactivated in 40% of lung and breast tumors, 72% of the primary colorectal cancers and 71% of the glioma cell lines. Expression is restored by 5-Aza-dC treatment (Dallol A. et al., 2003a; 2003b).
Dickinson RE and colleagues checked the expression profile of Slit 1, which is mainly expressed in neural tissues, and Slit3 gene, which has more widely expression pattern than Slit1, both in cancerous and normal tissues. After this analysis Slit3 was found to be methylated in 41% of breast, 33% of colorectal and 29% of glioma tumor cell lines whereas Slit1 was found to be methylated in 83% of glioma tumors (Dickinson RE., et al., 2004).
SLIT1, SLIT2 and SLIT3 expression in hepatocellular carcinoma was found to be very low in poorly differentiated cell lines (Ito H., et al., 2006). This finding may set a connection between the tumor progression and Slit Family.
In 2003 Wang showed that Robo1-Slit2 signaling pathway is activated in the angiogenically active sites of the tumor. Recombinant Slit2 protein attracted the endothelial cells and promoted the tube formation in a Robo1 and PI kinase dependent manner. Neutralization of Robo1 dramatically reduced the microvessel density and also the tumor mass of the malignant melanoma A375 cells in vivo (Wang B. et al., 2003).
12
Slit2 treatment of the breast cancer cells was shown to inhibit the CXCL12/CXCR4 induced breast cancer cell chemotaxis, chemoinvasion and further adhesion of the cells to the new environment, which are the fundamental components of the tumor metastasis (Prasad A. et al.,2004). In 2008, the same group proved that Slit2 induces a tumor suppressive effect by coordinated regulation of B catenin and PI3K signaling pathways and by enhancing the β catenin/E cadherin mediated cell-cell adhesion. Also Slit2 over expressing MCF-7 cells showed 60-70% reduction in the tumor size compared with the mice injected with normal MCF-7 cells (Prasad A. et al., 2008).
In a recent work it was proved that SLIT2 expression is downregulated in 75% of HCC cell lines and 83.3% of HCC samples. Decrease in the expression is significantly correlated with the CpG island hypermethylation. Furthermore, expression of SLIT2 was restored after treatment of 5-Aza-dC treatment (Jin J. et al., 2009).
In 2006, Ito H. and colleagues find out that ROBO1 is overexpressed in 83 of 98 cases of HCC (84.7%). Also they detected the ectodomain of ROBO1 in both the medium of liver cancer cell lines (PLC and HepG2) and sera from HCC patients. (Ito H. et al., 2006)
13
2. AIM OF THE STUDY
Analysis of differentially expressed genes between tumor and normal tissue is one of the gold standards for a better understanding of carcinogenesis. Genes identified in such studies not only strengthen cancer research works, but also provide valuable tools for early diagnosis, effective monitoring of disease progression and reveal new therapeutic targets.
Hepatocellular carcinoma (HCC) is one of the most wide-spread carcinomas throughout the world –responsible for 600,000 deaths annually. Diagnostic, prognostic tools and effective therapies for this aggressive cancer are very limited. Therefore the understanding of molecular pathways underlying HCC is of great importance.
Recently, our group showed that transcripts of SLIT-ROBO family of genes (SLIT1-3, ROBO1-4) are differentially expressed in HCC. In the last few years, it was also shown that ROBO1 is overexpressed and SLIT2 is epigenetically inactivated in liver cancer. On the other hand, ROBO4 expression was found to be generally confined to vascular endothelium. Therefore, to complete the understanding of the regulation of expression of ROBO SLIT family genes in HCC, we decided to study whether SLIT1, SLIT3, ROBO2, and ROBO3 are epigenetically regulated by means of hypermethylation of their gene regulatory regions.
14
CHAPTER 3 MATERIALS AND METHODS
3.1 MATERIALS 3.1.1 Reagents
All laboratory chemicals were analytical grade from Sigma-Aldrich (St.Louis, MO, USA), Farmitalia Carlo Erba (Milano, Italy) and Merck (Schucdarf, Germany) with the following exceptions: ethanol and methanol were from Riedel-de Haën (Germany). Agar, tryptone and yeast extract were obtained from Gibco (Carlsbad, CA, USA), BRL Life Technology Inc. (Gaithersburgs, MD, USA).
3.1.2 Bacterial Strains
The bacterial strain used in this work was E.coli DH5α. 3.1.3 Enzymes
Restriction endonucleases used for gene cloning were purchased from Jena Bioscience (Germany). T4 DNA ligase was purchased from Fermentas GmbH (Germany). DyNAzyme II and Phusion DNA Polymerase was purchased from Finnzymes (Espoo, Finland).
3.1.4 DNA Markers
DNA molecular weight standards were purchased from Fermentas GmbH (Germany) (100 bp-SM0241, 1kb-SM0311) and Jena Bioscience (Germany) (low range DNA ladder 50-1000 bp, high range DNA ladder 0.5-10kb).
3.1.5 Oligonucleotides
The oligonucleotides used in polymerase chain reactions were synthesized and supplied from Iontek Inc. (Istanbul, Turkey) and Alpha DNA (Germany).
3.1.6 Plasmids
pGL3 Luciferase Reporter Vector was purchased from PROMEGA Corporation (USA). e1b TATA box added modified version of pGL3 was kindly provided by Hani Alotaibi.
3.1.7 Electrophoresis, photography and spectrophotometer
Electrophoresis grade agarose was obtained from Sigma Biosciences Chemical Company Ltd. (St. Louis, MO, USA). Horizontal electrophoresis apparatuses were from E-C Apparatus Corporation (Florida, USA). The power supply Power-PAC300 and Power-PAC200 was from Bio Rad Laboratories (CA, USA). The Molecular Analyst software used in agarose gel profile
15
visualizing was from Vilber Lourmat (France). Beckman Spectrophotometer Du640 was purchased from Beckman Instruments Inc. (CA. USA) and Nanodrop ND-1000 Full-spectrum UV/Vis Spectrophotometer was purchased from Thermo Fisher Scientific (Wilmington, DE, USA). The Reporter Microplate Luminometer Reader was from Turner BioSystems Inc (Sunnyvale, CA, USA).
3.1.8 Tissue culture reagents and cell lines
Dulbecco‟s modified Eagle‟s medium (DMEM), RPMI 1640, trypsin, non-essential amino acids, penicillin/streptomycin mixture and fetal calf serum were obtained from HyClone (South Logan, UT, USA). Tissue culture flasks, petri dishes and cryotubes were purchased from Costar Corp. (Cambridge, England). Geneticin-G418 sulfate was purchased from GibcoBRL (Carlsbad, CA, USA).
3.1.9 Transfection reagents
FuGene HD (Roche, Mannheim, Germany) and Licofectamine 2000 (Invitrogen, Carlsbad, CA, USA) transfection reagents were used in this study. OptiMEM I serum free medium was purchased from Invitrogen (Carlsbad, CA, USA).
3.1.10 Kits
RNeasy Mini Kit was obtained from Qiagen (Hilden, Germany). NucleoSpin RNA II Kit was obtained from Macherey-Nagel (Duren, Germany). DyNAmo cDNA Synthesis Kit and DyNAmo™ HS SYBR® Green qPCR Kit were purchased from Finnzymes (Espoo, Finland). Qiaprep spin mini-prep kit (for small scale DNA isolation), Qiafilter plasmid midi kit (for medium-scale DNA isolation), Qiaquick PCR purification and gel extraction kits (for recovery and extraction of DNA from agarose gel) were from Qiagen (Hilden, Germany). UltraClean Tissue DNA Isolation Kit was purchased from MOBIO Laboratories (Carlsbad, CA, USA). Bisulfite treatment kit was obtained from EPIGENTEK MethylAMP® DNA modification kit (NY, USA)
3.2 SOLUTIONS AND MEDIA 3.2.1 General solutions
Tris-acetic acid-EDTA (TAE): Stock solution (50XTAE) was prepared by addition of 121g Tris-base, 18.6g EDTA, and 28.55ml glacial acetic acid to 500ml ddH2O. pH of the stock solution was adjusted to 8.5. Working solution (1XTAE) was prepared by dilution of 50XTAE to 1X with ddH2O.
16
Ethidium bromide: 10mg/ml in water (stock solution), 30ng/ml (working solution).
6X Agarose gel loading dye: A mixture of 0.009g bromophenol blue (BFB), 0.009g xylene cyanol (XC), 2.8ml ddH2O, 1.2ml 0.5M EDTA was prepared. The total volume was brought to 15ml by addition of glycerol.
3.2.2 RNA solutions
DEPC-treated water: 1ml DEPC was added to 1L ddH2O and stirred under hood overnight. DEPC was inactivated by autoclaving.
3.2.3 Microbiological media, reagents and antibiotics
Luria Bertani (LB) medium: Per liter; 10g bacto-tryptone, 5g bacto-yeast extract, 10g NaCl. For LB agar plates, 15g/L bacto agar was added.
Glycerol stock solution: A final concentration of 25% glycerol in LB was added to bacterial culture.
Ampicillin: 100mg/ml solution in ddH2O, sterilized by filtration and stored at -20°C (stock solution). Working solution was 100μg/ml.
SOB medium: Per liter; 20g tryptone (2%), 5g yeast extract (0.5%), 0.584g NaCl (10mM), 0.1864g KCl (2.5mM) autoclaved to sterilize. Then, 2.46g MgSO4 and 2.03g MgCl2 (10mM) are added.
SOC medium: SOB + 20mM glucose from filter sterilized 1M glucose stock solution in ddH2O.
Transformation buffer (TB): 10mM PIPES, 55mM MnCl2, 15mM CaCl2, 250mM KCl. Filter sterilized and stored at 4oC.
3.2.4 Tissue culture solutions
DMEM/RPMI1640 growth media: 10% FBS, 1% penicillin/streptomycin, 1% non-essential amino acid were added and stored at 4oC.
Freezing solution: 10% DMSO and 90% FCS were mixed freshly.
Phosphate buffered saline (PBS): Stock solution (10XPBS) was prepared by dissolving 80g NaCl, 2g KCl, 17.8g Na2HPO4.2H2O, and 2.4g KH2PO4 in 1L ddH2O. Working solution
17
(1XPBS) was prepared by dilution of 10XPBS to 1X with ddH2O. pH of the working solution was adjusted to 7.4.
3.3 METHODS
3.3.1 General methods
3.3.1.1 Bacterial transformation
3.3.1.1.1 Super-competent E.coli preparation
Super-competent E.coli preparation was described by Inoue (Inoue H. et al., 1990). E.coli DH5α cells were grown in SOB medium at 30o
C to an O.D.600 of 0.5-0.6 with vigorous shaking at 225rpm and cooled down on ice for 10 minutes. Cells were transferred to 500ml centrifuge bottles and centrifuged at 2500g for 10 minutes (Beckman JA10 rotor, pre-cooled to 4oC). The pellet was resuspended in ice-cold transformation buffer (1/3 of initial culture volume) by gently swirling and kept on ice for 10 minutes. The suspension was then centrifuged at 2500g for 10 minutes. The pellet was gently re-suspended in ice-cold transformation buffer (1/12.5 of initial culture volume) then DMSO was added with gently swirling to a final concentration of 7% and incubated on ice for 10 minutes. Super-competent cells were aliquotted to 1.5ml eppendorf tubes, then immersed in liquid nitrogen to snap-freeze and stored at -80oC.
3.3.1.1.2 Super-competent E.coli transformation
Super-competent cells were thawed on ice for ~15minutes. From this, 150µl of cells were pipetted to pre-chilled transformation tubes and immediately mixed with the ligation products or 10ng intact plasmid. Then the complex was incubated on ice for 30 minutes, after which a heat-shock at 42oC for 30-45 seconds applied. Heat-shocked cells were immediately replaced on ice for 2 minutes and consequently 850µl LB medium was added. For antibiotic resistance gene to be expressed, the cells were rotated at 225rpm for 1hour in a 37oC shaker. If ligation product was used then the cells were pelleted and re-suspended in 100µl LB; otherwise when intact plasmid was used, 100µl from 1ml total culture was taken and spread on agar plates with suitable selection antibiotic. Under aseptic conditions, plates were left to drain for ~10minutes and then placed in an inverted position into 37oC incubators for overnight (12-16 hours). Next day the emerging colonies were collected for mini-prep.
18
3.3.1.2 Long term storage of bacterial strains
To keep bacterial cells including plasmid in it or as empty for future experiments and to have a stock of strain in a laboratory is necessary. The most frequently used method is “Glycerol-Stock” method. A single colony picked from either an agar plate or a loop-full of bacterial stock was inoculated into 5ml LB (with a selective agent if necessary) in 15ml screw capped tubes. Tubes were incubated overnight at 37oC and at 225rpm. For glycerol stock, 500μl of saturated culture was added into 700ul of 50% glycerol v/v. This mix was frozen/stored at -80oC.
3.3.1.3 Plasmid DNA preparation
Small scale isolation of plasmid DNA was performed with Qiaquick spin mini-prep kit according to the manufacturer‟s instructions. This procedure yields approximately 200ng/μl of plasmid DNA for 1ml of LB culture. For large-scale preparation of pure plasmid DNA, the Qiafilter plasmid midi kit was used by following the manufacturer‟s instructions. This procedure yields approximately 1μg/μl of plasmid DNA for 100 ml of LB culture.
3.3.1.4 Preparation of genomic DNA from cultured cells
Cultured cells were grown in 100mm tissue culture dishes to 70-80% confluency, trypsinized, and washed with 1XPBS. Genomic DNA was isolated by using UltraClean Tissue DNA Isolation Kit (MOBIO Laboratories, Carlsbad, CA, USA) following manufacturer‟s instructions.
3.3.1.5 Extraction of total RNA from tissue culture cells
Exponentially growing monolayer cultures were washed twice with ice-cold PBS, scraped with a scraper, pelleted at +4oC and stored at -80oC until needed for RNA preparation. The total RNA isolation from cell line pellets was performed directly by use of NucleoSpin RNA II kit according to the manufacturer‟s instructions. The RNAs were eluted in a total volume of 40μl. The concentration of the isolated RNA and O.D.260/280 ratio were measured with the NanoDrop ND-1000 spectrophotometer (NanoDrop Technologies, Montchanin, DE, USA). Isolated RNAs were snap-frozen with liquid nitrogen and stored at -80oC.
3.3.1.6 Quantification and qualification of nucleic acids and proteins
Concentration and purity of the double stranded nucleic acids (plasmid and genomic DNAs) and total RNAs were determined by using the RNA and double-stranded(ds) DNA methods on Nanodrop ND-1000 Full-spectrum UV/Vis Spectrophotometer (Thermo Fisher Scientific, Wilmington, DE, USA). Concentration and purity of proteins were determined by using the
19
Beckman Instruments Du Series 600 Spectrophotometer software programs on the Beckman Spectrophotometer Du640 (Beckman Instruments Inc. CA. USA).
3.3.1.7 Restriction enzyme digestion of DNA
Restriction enzyme digestions were routinely performed in 20μl or 50μl reaction volumes and typically 5-10μg DNA was used. Reactions were carried out with the appropriate reaction buffer and conditions according to the manufacturer‟s recommendations. Digestion of DNA with two different restriction enzymes was also performed in the appropriate common reaction buffer and conditions recommended by the manufacturer.
3.3.1.8 Agarose gel electrophoresis of DNA
DNA fragments were fractionated by horizontal gel electrophoresis in 1-2% (w/v) agarose gel by using 1XTAE buffer. DNA fragments less than 1 kb were generally separated on 1.0% or 2.0 % agarose gel, those greater than 1 kb (up to 11 kb) were separated on 1 % agarose gels. Agarose was completely dissolved in 1XTAE electrophoresis buffer in the desired percentages and ethidium bromide solution was added to final concentration of 30ng/ml. 6XDNA loading dye was added to 10μl of quantitative real time RT-PCR (QRT-PCR) products and 20μl of normal PCR products such that the final dye concentration will be 1X, and total volume was loaded to each well. Nucleic acids were visualized under ultraviolet light (long wave, 340nm) and GeneRuler (Fermentas) DNA size markers was used to estimate the fragment sizes.1 kb DNA ladder was loaded for products sizes of over 1kb and 100 bp ladder for product sizes of below 1kb.
3.3.2 Tissue culture techniques 3.3.2.1 Cell lines
13 hepatoma (Huh7, FOCUS, Mahlavu, Hep40, Hep3B, PLC/PRF/5, SK-Hep1, Snu182, Snu387, Snu398, Snu423, Snu449 and Snu475) and 1 hepatoblastoma (HepG2) cell lines were used in this study and cultured as previously described (Cagatay T. and Ozturk M., 2002)
3.3.2.2 Thawing cryopreserved cells
One vial of the frozen cells from the liquid nitrogen tank was taken and immediately put into ice. The vial was left 1 minute on the bench to allow excess nitrogen to evaporate and then placed into 37oC water bath until the external part of the cell solution was thawed (takes approximately 1-2 minutes). The cells were directly poured into a 15ml sterile tube containing
20
10ml cold fresh medium. The cells were centrifuged at 1500rpm at 4oC for 5 minutes. Supernatant was discarded and the pellet was resuspended in 10ml 37oC culture medium to be plated into 100mm dish. After overnight incubation in a humidified incubator at 37°C supplied with 5% CO2, culture mediums were refreshed.
3.3.2.3 Growth conditions of cell lines
Focus, Hep40, Hep3B, Hep3B-TR, HepG2, HUH7, Mahlavu, PLC/PRF/5, SK Hep1 cells were cultured in low-glucose DMEM supplemented with 10% FBS, 100U/ml Penicillin-Streptomycin, and 0.1mM non-essential amino acids (HyClone, Utah, USA). SNU387, SNU398, SNU423, SNU449, SNU475 cells were cultured in RPMI1640 medium supplemented with 10% FBS, 100 U/ml Penicillin-Streptomycin, 0.1mM non-essential amino acids (HyClone, Utah, USA). The growth medium was aspirated and the cells were washed once with 1XPBS. Trypsin was added to the flask to remove the monolayer cells from the surface. The fresh medium was added and the suspension was pipetted gently to disperse the cells. The cells were transferred to either fresh petri dishes or fresh flasks using different dilutions (from 1:2 to 1:10) depending on requirements. All media and solutions used for culture were kept at 4°C (except stock solutions) and warmed to 37°C before use.
3.3.2.4 Cryopreservation of cell lines
Exponentially growing cells were harvested by trypsinization and neutralized with growth medium. The cells were counted and precipitated at 1500rpm for 5min. The pellet was suspended in a freezing solution (10%DMSO, 20%FCS and 70%DMEM for adherent cells) at a concentration of ~4x10⁶cells/ml. 1ml of this solution was placed into 1ml screw capped cryotubes. The tubes were first frozen at -20oC for 0.5-1hours and then left at -80°C overnight. The next day, the tubes were transferred into the liquid nitrogen storage tank. 3.3.2.5 Transient Transfection of Cell Lines:
3.3.2.5.1 Transient Transfection of Eukaryotic Cells Using with “Lipofectamine Reagent” Transfection was performed with Lipofectamin 2000 reagent (Invitrogen) following manufacturer‟s instructions.
3.3.2.5.2 Transient Transfection of Eukaryotic Cells Using with FuGene HD:
Transfection was performed with FuGene HD reagent (Invitrogen) following manufacturer‟s instructions.
21
3.3.2.6 5-Aza-dC Treatment of the Cells
5-Aza-dC stock solutions was prepared with the concentration of 100uM in DMEM. Cells were treated with 2.5 uM of 5-Aza-dC for 4 days.
3.3.3 cDNA synthesis
cDNA was synthesized by using DyNAmoTM cDNA Synthesis Kit (Finnzymes, Espoo, Finland) according to manufacturer‟s instructions. Briefly; for 1X reaction 1μg of total RNA, 1μl oligo(dT) primers or 1 μl random hexamers and required amount of ddH2O were mixed in a total 8μl volume, then incubated at 65°C for 5min and chilled on ice. Then, 4 μl of 5X First Strand Buffer, 1 μl of RNase inhibitor and 2 μl of deoxynucleotide triphosphate mix (10 mM) were added and the reaction was incubated at 37°C for 5 min. Finally, the mixture was incubated at 42oC for 1 hr with 1 μl of reverse transciptase enzyme. The reaction was stopped by heating the mixture for 10 min at 70oC. Each cDNA sample was diluted at a ratio of 1:5 with ddH2O and stored at -20oC to be used as a PCR template for further experiments. The oligo(dT) primed cDNA samples were used for the analysis of all the target and reference genes included in this study.
3.3.4 Primer design for Cloning and MS-PCR
The primer pairs that have been used in cloning were as follows: Forward primers F1, F2, F3, F4 for putative promoter region were selected from the beginning part of the CpG island, beginning of the promoter, end of the promoter and end of the CpG island respectively. Primers used for amplifying the ROBO2 CpG island by MS-PCR was designed by MethPrimer website. Other MS-PCR primers were previously described (Nguyen et al., 2006). All Primers were listed in Table 3.1.
TABLE 3.1 LIST OF PRIMERS
# Primer Name: Sequence:
1 F1 e1b TGCACACGCGTCCTTCCTCCTACTCGGCTTC
2 F2 e1b TGCACACGCGTGCAGACGGAGGGATGAATAA
3 F3 e1b TGCACACGCGTCGCCTTCCCTCCTAGAAGTC
22
5 Reverse (-F4) e1b TGCACCTCGAGCTCCTTTGCAGCGGTGTT
6 Reverse (full length) e1b TGCACCTCGAGTTTGACATATTAAAAAGGATCCAG 7 Enhancer Wide Forward CCATTGGAGAAAACCTCAAAA
8 Enhancer Wide Reverse GGTGGCATTGTAGCTGTCCT
9 Enhancer true F TGCACGGATCCCATGGGAATATTGAGTCCTTATCA 10 Enhancer true R TGCACGTCGACCCTTCCTCTTGGCAAGTCTG
11 R2 PRO-R GCAGACCCATGGTGACATATTAAAAAGGATCCAG
12 R2 PRO-F1 TGCAC AAGCTT CCTTCCTCCTACTCGGCTTC
13 R2 PRO-F2 CGCAC AAGCTT GCAGACGGAGGGATGAATAA
14 R2 PRO-F3 TGCAC AAGCTT CGCCTTCCCTCCTAGAAGTC
15 R2 PRO-F4 TGCAC AAGCTT CTTTTGGAAACCGGAGAGGT
16 R2 PRO-R5 GTCCACCATGGCTCCTTTGCAGCGGTGTT 17 R2PW-F CCACACCCAGAGCCT 18 R2PW-R AGGCTCTTGCAGGAGATTGA 19 SLIT1-UR2 ttttcctcctcAcaAcaAtcaA 20 SLIT1-UF2 TgggTttgTgTgTggTgTTT 21 SLIT1-MR2 aAAcgccgtcgcttAAaAA 22 SLIT1-MF2 TtcgTtcgcgagTTagacg 23 SLIT3-MF ggtttcgtcgatggagttgt 24 SLIT3-MR aaacgcgtaaaacccgaaa 25 SLIT3-UF TGTGggTTagTGgggTTagg 26 SLIT3-UR cacaaacaaaacaaaacactcca
23 27 ROBO1-MF2 cggcggcgatagTagTTaaa 28 ROBO1-MR2 cgAAActAAAAAcgcccaAa 29 ROBO1-MF3 cggcgtgcgTTTTTaTaatg 30 ROBO1-MR3 gccAcgAAtAAcccgctAct 31 ROBO1-UF TggTggTaaagttggggtgt 32 ROBO1-UR ccAaAcccttcctccAAaAc 33 ROBO3-MF gcgggaTtTtTagTcggTTT 34 ROBO3-MR gAcctctccgcaAActAAcg 35 ROBO3-UF TggTgggaTtTtTagTTggTTT 36 ROBO3-UR ccAcaActtccccAcAAcAc 37 ROBO2-MF TATTATTTTTAGAGGCGGTATCGC 38 ROBO2-MR AATAAAAAATCCGAACTCCTACGTA 39 ROBO2-UF ATTATTTTTAGAGGTGGTATTGTGG 40 ROBO2-UR AATAAAAAATCCAAACTCCTACATA 41 SLIT1 F GACGTGGTCTGTCCCCACAA 42 SLIT1 R AATCTCATTGTTATTCAATCGCAGTT 43 SLIT3 F CCGCCTAACTACACAGGTGAGCTAT 44 SLIT3 R CGCTGTAGCCAGGGACACACT 45 ROBO2 F GGGTTACTACATCTGCCAGGCTT 46 ROBO2 R AGGTGGAGGTCTATCTGTCAAAACAT 47 ROBO3 F CAGTGTCCGATGGAAGAAGG 48 ROBO3 R GTCCATCTCCTGCACATTGG
24 49 GAPDH F GGCTGAGAACGGGAAGCTTGTCAT 50 GAPDH R CAGCCTTCTCCATGGTGGTGAAGA 51 GL2 GGAAGACGCCAAAAACATAAAG 52 RV3 CTAGCAAAATAGGCTGTCCC 53 RV4 CGCGGGGCATGACTATCGTC
TABLE 3.2 PRIMER EFFICIENCIES & PRODUCT SIZES FOR REAL TIME PCR PRIMERS:
PRIMER EFFICIENCY PRODUCT SIZE
Robo2 1.9 98
Robo3 1.9 106
Slit1 1.9 130
Slit3 2.0 136
Gapdh 2.0 143
3.3.5 Fidelity and DNA contamination control in first strand cDNAs
The fidelity and genomic DNA contamination of first strand cDNAs were checked before performing expression analyses. 2μl of diluted first strand cDNA was used for cold-PCR amplification of the glyceraldehyde-3-phosphate dehydrogenase (GAPDH) transcript. GAPDH primer pair for this analysis was designed to produce a 151 bp fragment from cDNA and 250 bp fragment from genomic DNA.
3.3.6 Methylation Specific PCR
Bisulfite treated DNA of HCC cell lines were eluted in 8µl of elution buffer. PCR volume is 50 µl. Briefly, reaction content is: 1µl of DynAzyme II, 5 µl of dNTP (2mM), 4 µl of bisulfite treated DNA, 1.5 µl of Mg2+, 5 µl of PCR Buffer (10X) and 33.5 ul of ddH2
O. Reaction conditions are as follows: 95oC 15 min, (94oC 30 sec, 58oC 30 sec, 72oC 40 sec) 45 cycles, and final extension at 72oC for 10 min.
3.3.7 Cloning Strategies for ROBO2 Putative Promoter and Enhancer:
During the cloning works Phusion® DNA Polymerase FINNZYMES were used because of its high proof reading activity, low mutation rate and increased specificity. To synthesize the fragments of putative promoter region, nested PCR primers (R2PW-F& R2PW-R) were used and extended fragments were obtained. Then, these fragments were used as DNA source of the next PCR. Reverse primer (R2-PRO-R) contains 3 mispriming bases which are not
25
complementary to the genomic DNA. Mispriming bases at the 3‟ end of the R2-PRO-R gene was designed to fit into translation start site of luc gene, NcoI restriction site, the end of the 5‟ UTR of ROBO2 gene just before the translation start site. These first constructs contain NcoI and HindIII restriction sites. Putative enhancer region was also amplified from the nested PCR product. Then enhancer region insert with SalI and BamHI restriction sites. Inserts for e1b pGL3 vector contains MluI and XhoI restriction sites and synthesized from the nested PCR product made with R2PW-F& R2PW-R. Exclusion of F4 region from these constructs were made by using the same forward primes of F1,2,3,4 synthesis both for pGL3 basic and e1b but the reverse primers were different. “Reverse (-F4) e1b” & “R2 PRO-R5” primers were used. PCR reactions were performed in 50 µl: 10 µl of Phusion GC- Buffer, 0.6 µl of Phusion DNA Polymerase, 5 µl dNTP, 2 µl of genomic DNA (or nested PCR product), and 32.4 µl ddH2O with 98o
C 3 min, (98oC for 10 sec, 60oC for 15 sec, 72oC for 45 sec)45 cycles, 72oC for 10 min for final extension. All inserts cut and isolated from the gel. Then, they exposed to restriction enzymes for 4 hours. 1µg of DNA were cut for each insert in 50µl volume which contains 5 µl of restriction enzyme buffer, 1 µl of enzymes. Restriction products were purified with Qiagen PCR Purification Kit. Ligations of the inserts to vectors were performed with T4 DNA ligase in 10 µl volume which contains 100 µg vector and required amount of DNA, 1 µl of ligation buffer, 1 µl of T4 DNA ligase and ddH2O. Required insert amount was calculated with the following formula: ng of insert = [(ng of vector X kb size of insert) / kb size of vector] X molar ratio of insert/ vector (which is 1/3). 3.4 Quantitative real time RT-PCR
Real-time qRT-PCR was performed on BioRad iCycler (Bio-Rad, California, USA) using the BioRad iQTM SYBR Green Supermix. The amplification mixtures contained 1.0 μl of 1:5-diluted cDNA template, 6.25 μl SYBR Green PCR Master Mix Buffer (2X), and 10 pmol of forward and reverse primers in a total volume of 12.5 μl. The cycling conditions were as follows: an initial incubation of 95°C for 5 min and then 45 cycles of 95°C for 30 s and 60°C for 30 s during which the fluorescence data were collected. To verify that the used primer pair produced only a single product, a dissociation protocol was added after thermocycling, determining dissociation of the PCR products from 55°C to 95°C in 80 cycles. 12.5μl mineral oil was added to cover top of the mixture to prevent evaporation. The amplification reactions were performed in 96 well-PCR plates and the plates were sealed with optical sealing tapes (Bio-Rad, California, USA). All PCR reactions were studied in duplicate. Treated and untreated samples were always analyzed in the same run to exclude between-run variations
26
and each sample was studied in duplicate. A no-template control of nuclease-free water was included in each run. Following amplification, a reaction product melt curve was obtained to provide evidence for a single reaction product. The iCycler iQ Optical System Software (version 3, BioRad Laboratories) was used to determine the melting temperatures of the products. The threshold cycle (Ct) value was calculated as the cycle where the fluorescence of the sample exceeded a threshold level.
In cell lines and tissues, the relative expression ratio (R) of SLIT-ROBO in 5-Aza dC treated and non treated cells were measured based on a modified ∆∆Ct formula (35) and normalized to GAPDH or ACTB (reference gene). In R= (Etarget) ∆Ct target (control-sample) / (Eref) ∆Ct ref (control-sample) formula Etarget and Eref reflect PCR efficiencies of the primers for target genes and reference genes, respectively. PCR efficiency values for each primer pair was obtained by constructing a standard curve using threshold cycle (Ct) values derived from 6 data points, corresponding to 2-fold decrements of an original cDNA stock (duplicates were prepared for each dilution). The slope of the resulting curve was used to calculate the E value of primer pairs according to E = 2-1/slope formula. PCR efficiencies of the genes ranged between 1.9 and 2.0. ∆Ct was the difference between the Ct values of controls and samples.
3.5 Computer Analysis:
The sequences of the cloned FAM134B isoforms and of their mouse homologues were obtained from NCBI (National Center for Biotechnology Information) and UCSC (University of California, Santa Cruz) Genome Browser. The exon-intron information of these genes was derived using Ensembl Genome Browser at http://www.ensembl.org. Restriction endonuclease maps of the plasmid DNAs were analyzed by using the Clone.exe program. Primers were designed by using Primer.exe program provided by Whitehead Institute for Biomedical Research. The results of the DNA sequencing of engineered constructs were visualized using Finch TV 1.4 available for download at http://www.geospiza.com/finchtv.html. The alignments of nucleic acids was performed by using the NCBI Blast2Sequences algorithm available at the web page http://www.ncbi.nlm.nih.gov/BLAST/ , BIOEDIT Sequence
Alignment Editor software publicly available at
http://www.mbio.ncsu.edu/BioEdit/BioEdit.html and ClustalW algorithm provided by EMBL-EBI at http://www.ebi.ac.uk/Tools/clustalw2/index.html.
Another database used in this study is OncoDB.HCC- Oncogenomic Databas of Hepatocellular Carcinoma (Jou et al., 2007) For querying name of ROBO-SLIT family
27
member genes were typed in the „Gene description‟ section of „Display queried gene and reginal data‟ query tool and „region around gene option‟ on the left side of the query tool was left as default, +/- 10 Mb (megabases). On the return page, clicking on „display region‟ gives information on the mapped human markers and LOH (loss of heterozygosity) regions around the queried gene.
For enhancer and promoter analysis GENOMATIX,CORG and PromoterScan softwares were used. The search algoritm was set to default in all parameters. Results of the putative promoter and enhancer sequences were listed according to their Z-score with the possible transcription factors.
For CpG island prediction analysis, EMBOSS CpG Plot software was used. All the parameters were set to default.
3.6 Sequencing of Constructs:
We have F1-pGL3, F2-pGL3, F3-pGL3, F4-pGL3 constructs sequenced in Iontek Inc (Istanbul, Turkey) by providing the company with PCR products and primers. Representative F1-pGL3 sequencing results were at the appendices part. To sequence F1, F2, F3 constructs F4, GL, and RV primers were used. For F4 construct GL and RV primers were used. For sequencing primers see the table 3.1