Emergency Department Overcrowding in Turkey: Reasons, Facts and
Solutions
Oya Durmus Cakir,1 Sebnem Eren Cevik,1 Mehtap Bulut,2 Ozlem Guneyses,3 Sule Akkose Aydin4
1Emergency Medicine Clinic, Umraniye Training and Research Hospital, Istanbul, 2Department of Emergency Medicine,
Medipol University School of Medicine, Istanbul, 3Emergency Medicine Clinic, Dr Lutfi Kirdar Kartal Education and Research
Hospital, Istanbul, 4Department of Emergency Medicine, Uludag University School of Medicine, Bursa, Turkey.
AbstrAct
Introduction: The purpose of this study was to determine the factors affecting the long waiting times of the patients in a university hospital.
Methods: This study included 3000 of the adults above 18 years and pediatric trauma patients under 18 years who applied to emergency department between February 2009 and April 2009. The examination period of the physician, length of stay, length of hospitalization, waiting times for hospitalization and follow up times in the emergency department were recorded. Moreover, the patients were divided into four groups according to the reasons for waiting.
results: In our study, the time period between 4 pm-12 pm was determined as the busiest time for the applications. Average length of stay in the emergency department for 3000 patients was 146.7±160.2 minutes. The length of stay for the patients consulted was longer than the length of stay for the ones who were not consulted. Because of the fact that our hospital did not have appropriate bed capacity, 41.1% of the patients waited less than two hours, 13. 4% of the patients waited more than 8 hours. It was also found that the waiting times of the Group two patients (206,7±145,2 minutes) was longer than Group one (95,5±73,9 minutes) patients and the waiting times of Group three patients (470,7±364,7 minutes) was longer than Group one patients.
conclusions: In conclusion, cooperation of the managers, relevant departments and a multidisciplinary approach are necessary to achieve the goals to reduce overcrowding in the emergency departments.
_______________________________________________________________________________________
Keywords: bed capacity; crowding; emergency department; length of stay.
_______________________________________________________________________________________
INtrODUctION
Emergency departments are places where all necessary interventions must be conducted all the time with the same dynamism and quality 365 days a year.1 In our
country, according to the Emergency Health Services Regulation, emergency departments of the private and state owned hospitals accept all patients without any discrimination. 2 In recent years, because of the increase
in population and internal migrations, excessive amounts of patients are observed in the emergency departments of training and research hospitals.3 waiting time in
Correspondence:
Oya Durmus Cakir, Umraniye Training and Research Hospital Emergency Medicine Clinic, Istanbul, Turkey. Email: [email protected].CC S
emergency department is the most important indicator of patient satisfaction in emergency medicine care and it is evaluated in many organizations as a measure of quality.4
The purpose of this study is to determine the factors that affect the long waiting times of the patients, prevent the adverse consequences caused by overcrowding with reducing the waiting times and improve the quality and patient satisfaction in our hospital.
MEtHODs
The study is conducted in the Emergency Department of Uludag University Faculty of Medicine after receiving the approval of the ethical committee. Uludag University Faculty of Medicine is the leading institution in the Southern Marmara region. In the emergency department, emergency health services are provided to all adults older than 18 years and pediatric trauma patients regardless of their health insurance.
Patients admitted to the emergency department are triaged by the triage nurse. In Uludag University Faculty of Medicine Hospital Emergency Department, three level triage system is used. Patients are classified according to the priorities as Category 1 (Very urgent: Sudden or potentially life or extremity threatening complaining or injuries that necessitate treatment to prevent from death), Category 2 (Urgent: Sudden or potentially life or extremity threatening complaining or injuries that necessitate treatment or evaluation in a few hours to prevent from death or further injuries) and Category 3 (Non Urgent: Subacute or chronic, non life or extremity threatening complaining that do not necessitate evaluation and intervention in 24 hours to prevent from further injuries). Triage nurse leads the patient to the appropriate section according to the condition of the patient.
This study includes 3000 adult patients older than 18 years and pediatric trauma patients who were admitted to Uludag University Faculty of Medicine Emergency Department between 02.13.2009 and 04.01. 2009. Prior to the beginning of the study, doctors and nurses in the emergency department were informed about the study.
Measured Variables and Definitions
Patient Evaluation time: The time period between
placing the admitted patient on a bed and evaluation of the patient by an emergency medicine doctor.
Length of stay: Elapsed time from the moment of
admission until discharging, or transferring, or laying to another clinique.
Length of Hospitalization: Elapsed time from the
moment of admission until laying to another clinique.
Waiting period for hospitalization: Elapsed time from
request for bed until being discharged from emergency department.
Follow up time in the emergency department: Elapsed
time from the moment of admission until being discharged for the patients who were followed in the emergency department because of various problems although hospitalization was required.
Classification of Patients according to the reasons for waiting
Patients are arranged in four groups according to the waiting reasons:
Group 1 (Patients who wait because of emergency
department related reasons):
Patients who wait for the emergency medicine doctor evaluation, who wait for the routine test results, who wait for evaluation of the test results.
Group 2 (Patients who wait because of emergency
department and hospital related reasons):
Patients who wait for consultation and tests that are conducted outside the emergency department such as echocardiography, computer tomography, ultrasonography, electroencephalography, culture, Gram painting, preparation of blood products and blood transfusion that can be conducted in the emergency department and other special tests.
Group 3 (Patients who wait because of hospital related
reasons):
Patients who are determined to be hospitalized but still wait in the emergency department because of the lack of beds and patients who wait for being transported to the relevant clinique.
Group 4 (Patients who wait because of non emergency
department and non hospital related reasons):
Patients who wait for discharging procedures, patients who wait for social aid and patients who wait to be transferred to another health institution.
Analysis of the study data
SPSS 13.0 (Statistical Package for Social Sciences for Windows) software was used for statistical analysis. Variables that continuously change were represented
by mean, standard deviation, minimum and maximum values. Comparison of these variables for 3 groups was done by Kruskal Wallis Test. Variables that represent meaningful difference were compared by Mann Withney U Test between two groups. Variables that get categorical values were represented by their frequencies according to the groups. Pearson Ki Square Test and Fisher’s Exact Test were used for inter group comparisons. p<0.05 was adopted as meaningful.
rEsULts
During the study period, a total of 3000 patients were included to the study. 1405 patients (46.8%) were male, 1595 patients (53.2%) were female. The mean age of the patients was 39.8+19.6. The mean age was 40+20.3 for male patients and 39.6+18.9 for female patients.
When the admissions were examined according to the time slots, it is determined that majority of the
admissions were in the time period between 8pm -12 pm (696; 23.2%). It is also determined that 2025 of the patients (67.6%) were admitted in the time period between 12am -12 pm.
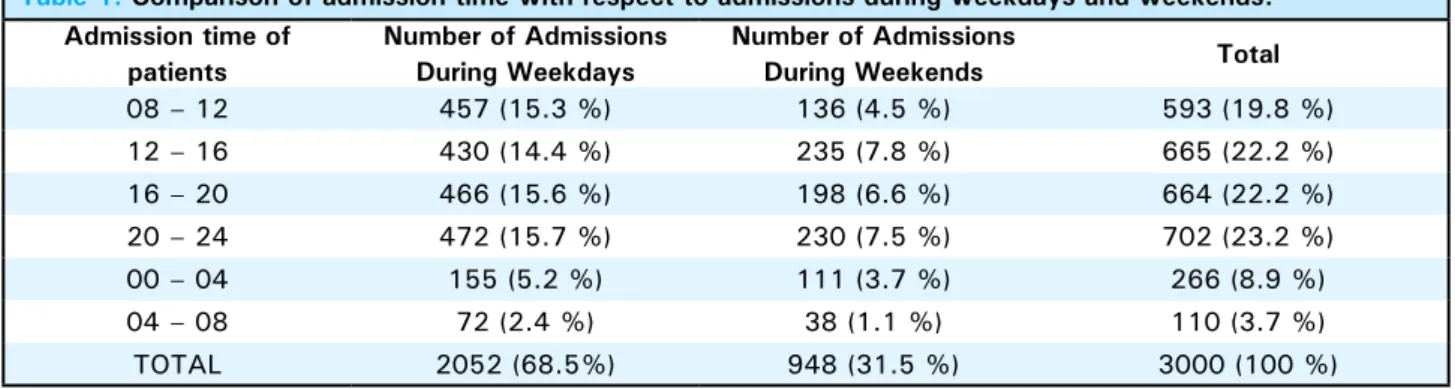
2052 patients (68.5%) were admitted in week days whereas 948 patients (31.5%) were admitted at weekends. During the week days 1165 patients (38.8%) were admitted outside working hours whereas 887 patients (29.7%) were admitted during the working hours. When the time of admissions was evaluated according to the admissions in week days and weekends, it was determined that the number of admissions between 8pm-12pm in week days is greater than the number of admissions at weekends between 8pm-12pm (p<0.001) (Table 1). When the length of stay is evaluated according to the admissions in week days and weekends, it is determined that length of stay in week days (157.35±175.22 min) is longer than length of stay at weekends (123.90±118.55 min) (p<0.001).
table 1. comparison of admission time with respect to admissions during weekdays and weekends. Admission time of
patients
Number of Admissions During Weekdays
Number of Admissions
During Weekends total
08 – 12 457 (15.3 %) 136 (4.5 %) 593 (19.8 %) 12 – 16 430 (14.4 %) 235 (7.8 %) 665 (22.2 %) 16 – 20 466 (15.6 %) 198 (6.6 %) 664 (22.2 %) 20 – 24 472 (15.7 %) 230 (7.5 %) 702 (23.2 %) 00 – 04 155 (5.2 %) 111 (3.7 %) 266 (8.9 %) 04 – 08 72 (2.4 %) 38 (1.1 %) 110 (3.7 %) TOTAL 2052 (68.5%) 948 (31.5 %) 3000 (100 %) When the triage categories of the patients were
examined, it was found that there were 325 (10.8%) very urgent (triage 1), 316 (10.5%) urgent (triage 2) and 2359 (78.6%) non urgent (triage 3) admissions. When the examination time was evaluated according to the triage categories, it was determined that 70.3% of the patients (2109) were examined within 5 minutes and 95.4% of the patients (2860) were examined within 10 minutes. When the length of stay was evaluated according to the triage categories, length of stay for triage 1 patients (288.6±241.95 min) was longer than triage 2 (226,88 min) and triage 3 (116,50 min) patients (p<0.001).
Patients were evaluated in three groups as medical, surgical and trauma. Incision, minor trauma, falling, traffic accidents, burn, electric shock, hit, firearm injury, sharp-knife injury, motorcycle and bicycle accidents were included in trauma. The number of patients in medical, trauma and surgical groups were
2245, 570 and 185, respectively. When the length of stay was evaluated according to the findings, length of stay for the patients in surgical group (179±160.7 min) was longer than length of stay in medical group (156.6±172.3 min) and length of stay in trauma group (97.6±82.2 min) (p<0.001) .
It was determined that 2148 patients (71.6%) were not consulted whereas 852 (28.4%) patients were consulted. When length of stay was evaluated according to the consultation status, it was determined that length of stay for the patients who were consulted was longer (251.54±232.59 min) than length of stay for the patients who were not consulted (p<0.001). When length of stay was evaluated statistically according to the number of consultations conducted, it was determined that length of stay was longer for the patients with three or more consultations (546.75±430.43 min) than the patients with one or two consultations (p<0.001).
When the results of the admissions were examined, of the 3000 patients, 2605 patients (86.6%) were discharged from the emergency department, 277 patients (9.2%) were hospitalized, 84 patients (2.8%) were transferred to a subsidiary health institution because of lack of beds. Length of stay for the patients who were forwarded to a subsidiary health institution was longer (320.80±256.21 min) than the other patient groups (p<0.001) (Table 1).
table 2. completion status of patients and length of stay.
completion
status Number of Patients Length of stay (min)
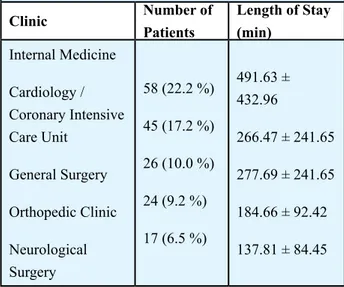
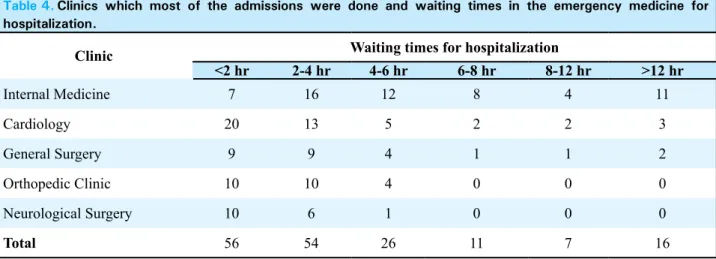
Discharged Dispatched Hospitalization Treatment rejection Exitus Prehospital Exitus 2605 (86.6 %) 84 (2.8 %) 277 (9.2 %) 30 (1.0 %) 3 (0.1 %) 1 (0.0 %) 126.44 ± 119.36 320.80 ± 256.21 281.30 ± 299.00 153.16 ± 123.57 491.66 ± 400.26 35.00 Total 3000 (100 %) 146.79 ± 160.25 When the patients who were hospitalized were examined, it was determined that majority of the patients (22.2%) were admitted to internal medicine clinic. The percentages of the admissions to other clinics were as follows: 17.2% to cardiology clinic and coroner intensive care unit, 10% to general surgery clinic, 9.2% to orthopedic clinic, 6.5% to brain surgery clinic and intensive care unit. Length of stay in the emergency department for the patients who were admitted to internal medicine clinic (N=58) was 491.63±432.96 minutes. Patient admissions to the clinics and length of stay in the emergency department are shown in Table 3. When the waiting times for admission to another clinic was evaluated, it was seen that 41.1% of the patients waited for less than two hours, 28.6% of the patients waited for 2-4 hours (Figure 1). Of the 277 patients who were hospitalized, 118 patients (42.5%) were followed up for less than two hours, 33 patients (12.1%) were followed up for more than eight hours in the emergency department. Of the patients who were determined to be hospitalized, seven patients discharged from the emergency service, two patients were transferred to another health institution and one patient was exitus. Length of stay in the emergency department and admissions to the top five clinics are
compared in Table 4.
Figure 1.Waiting times of patients for admission.
Number of Patients 120 100 80 60 40 20 0
Waiting times (minute)
<2 hours 2-4 hours 4-6 hours 6-8 hours 8-12 hours >12 hours
118 83
34
14 12 26
table 3. clinics which most of the admissions were done and total length of stay.
Clinic
Number of
Patients
Length of Stay
(min)
Internal Medicine
Cardiology /
Coronary Intensive
Care Unit
General Surgery
Orthopedic Clinic
Neurological
Surgery
58 (22.2 %)
45 (17.2 %)
26 (10.0 %)
24 (9.2 %)
17 (6.5 %)
491.63 ±
432.96
266.47 ± 241.65
277.69 ± 241.65
184.66 ± 92.42
137.81 ± 84.45
The following findings were determined from the patients who were diagnosed and observed in the emergency department:
1. 12 patients were followed in the emergency department and discharged although hospitalization was required. The mean following time in the emergency department was 576.3±262.9 minutes (approx. 9 hours). Diagnoses for 11 of patients were internal diseases whereas diagnosis for one patient was surgical.
2. Seven patients were considered as they did not require hospitalization by any of the physicians from the clinics; on the other hand the patients were followed in the emergency department and discharged because of the bad overall condition. The mean following time in the emergency department was 444.2±222.9 minutes (approx. seven hours). Diagnoses for six of the patients were internal diseases whereas diagnosis for one patient was surgical.
table 4. clinics which most of the admissions were done and waiting times in the emergency medicine for hospitalization.
Clinic
Waiting times for hospitalization
<2 hr
2-4 hr
4-6 hr
6-8 hr
8-12 hr
>12 hr
Internal Medicine
7
16
12
8
4
11
Cardiology
20
13
5
2
2
3
General Surgery
9
9
4
1
1
2
Orthopedic Clinic
10
10
4
0
0
0
Neurological Surgery
10
6
1
0
0
0
Total
56
54
26
11
7
16
examined according to the groups, group 4 was not taken into account because of the insufficient number of patients. Length of stay for group 3 (470.7±364.7 minutes) was longer than the length of stay for group 1 and group 2 (p<0.001). Groups were compared with the other groups in pairs. Length of stay for group 2 (206.7±145.2 minutes) was longer than the length of stay for group 1 (p<0.001). Length of stay for group 3 (470.7±364.7 minutes) was longer than length of stay for group 1 (p<0.001). Length of stay for group 3 (470.7±364.7 minutes) was longer than length of stay for group 2 (p<0.001). Length of stay comparison according to the groups is shown in Figure 2.
Figure 2. comparison of waiting times of patients according to the groups.
Number of Patients 2500 2000 1500 1000 500 0
Waiting times (minute) 95.5
Group 1 Group 2206.7 Group 3470.7 Group 4 522.5 2032
794
170 4
DIscUssION
Long waiting times in the emergency departments have a direct effect on emergency department crowdedness and patient satisfaction. Overcrowding is one of the most important problems in hospitals in our country as well as the other countries in the world. In a great deal of studies, the outrageous crowd in the emergency departments is reported to become more common and reached a critical point, thus the situation created a threat for public health and patient safety.
5, 6, 7, 8 Overcrowding in the emergency departments
is correlated with the increasing periods at the waiting rooms, increasing number of patients who leave 3. 33 patients were diagnosed in the emergency
department; however they had to wait for more than eight hours for hospitalization because of lack of beds. The mean following time in the emergency department was 956.1±391.8 minutes (approx. 15 hours). Diagnoses for 29 of the patients were internal diseases whereas diagnoses for four patients were surgical. 4. 30 patients were diagnosed and followed for more than eight hours in the emergency department. The mean following time in the emergency department was 655.3±248.6 minutes (approx. 10 hours). Diagnoses for 27 of the patients were internal diseases whereas diagnoses for three patients were surgical.
5. Three patients were followed in the emergency department with mechanical ventilation. The mean following time in the emergency department was 383.3±332.1 minutes (approx. six hours). Diagnoses for three of the patients were internal diseases.
6. Three patients were followed in the emergency department with bag valve mask. The mean following time in the emergency department was 244±111.3 minutes (approx. four hours). Diagnoses for 3 of the patients were internal diseases.
Total number of patients who were followed in the emergency department was 88 and the mean following time was 720.7±370.1 minutes (approx. 12 hours). The following time for patients who were diagnosed and waited for more than eight hours in the emergency department because of lack of beds (N=33) was longer (956.1+391.8 minutes) than the following time for the other patients. Diagnoses for 79 of these patients were internal diseases whereas diagnoses for 9 patients were surgical. None of them were trauma patients.
Patients were examined according to the reasons for waiting in four groups: Out of the total 3000 patients, 2032 (67.8%) were group 1, 794 (26.4%) were group 2, 170 (5.7%) were group 3, 4 (0.1%) were group 4 patients. When the length of stay was
untreated, and the decrease in patient satisfaction. 9
In a study applied to 160 emergency department managers in the USA in the year 2000, 28% of the reporters of crowded in the emergency department reported it to happen between 3 pm-11 pm. In the report in which 2002 data was published ’’The National Hospital Ambulatory Medical Care Survey’’ stated that the busiest hours in the USA are between 10 am-12 am and 4 pm-8 pm.10 In our study, it was detected that
most of the patient applications were between 8 pm-12 pm (23%), and 55.4% of patients applied between 4 pm-12 pm.
In our study, it was evaluated that the number of admissions during weekdays was greater than the number of admissions during weekends (68.5 %). Also, it was evaluated that length of stay during weekdays was longer than length of stay during weekends. The reason for this situation was considered as the number of admissions after working hours was greater than the number of admissions within working hours during weekdays.
In a study conducted by Howard and colleagues,11
the reasons for using emergency departments by non-emergency patients were evaluated such that the patients are directed to the emergency department by their primary doctors, difficulties in getting appointment and the belief of patients that examinations are concluded in a short time in emergency department. In a study conducted by Carter and colleagues, 12 it
was stated that 60-70 % of the emergency department admissions were done with non-emergency or minor medical reasons in Canada. In our study, 78.6% of the patients were triage category three.
According to the CDC 2005 data, average length of stay in the USA was determined as 210 minutes. 13 In a study
conducted by Henneman and colleagues,14 average
length of stay for the patients who were hospitalized was 328 minutes whereas average length of stay for the discharged patients was 176 minutes. In our study, average length of stay for the 3000 patients was evaluated as 146.7±160.2 minutes. Length of stay for the discharged patients was 126.44±119.36 minutes and average length of stay for the hospitalized patients was 281.30±299.0. It was determined that average length of stay in our study was shorter than the average length of stays in other studies. The reasons for this situation were the sample size, differences in patient population and evaluation of the patients in a very short time by a doctor in the emergency department.
In the study conducted by Fefermen and Cornell, 15 “How
we solved the overcrowding problem in our emergency department”, it is reported that the number of beds was
increased for the internal medicine departments and the number of hospitalized patients was increased with 4.4 % which results in that crowd in the emergency department was reduced with 2.9 %. In our study, 74.8 % of the patients were internal medicine patients. Length of stay for the patients was 491.63 + 432.96. Moreover, diagnosis for the 79 patients was changed to internal medicine. To reduce the length of stay in our hospital, we believe that some more precautions should be taken for the bed capacity of the internal services. Lack of consultant specialist and difficulties in reaching them are among the reasons of emergency department crowdedness. 16 In the study conducted
by Curry and Wang 17 in Canada, consultation rates
are reported as 28.1% during the hours when the number of admissions is high and 21.4 % when the number of admissions is low. In our study, 28.4 % of the patients were consulted. It was found that the length of stay for the patients who were consulted (251.54 ± 232.59 min) was longer than the length of stay for the patients who were not consulted. Delays in consultant specialist arrivals, pending test results from other departments while the patient was waiting in the emergency department, treatment and discharge of inpatients in the emergency department were considered as the reasons for long waiting times and crowdedness in our emergency department. In our study, 28.4 % of the patients were consulted. It was found that the length of stay for the patients who were consulted (251.54 ± 232.59 min) was longer than the length of stay for the patients who were not consulted. Delays in consultant specialist arrivals, pending test results from other departments while the patient was waiting in the emergency department, treatment and discharge of inpatients in the emergency department were considered as the reasons for long waiting times and crowdedness in our emergency department.
Laboratory tests, radiology and other auxiliary services in training and research hospitals are factors that cause longer waiting times.16, 18, 19 In a study
conducted by Espinosa and colleagues20 in which
factors influencing patient flow and overcrowding in the emergency department were evaluated, the number of patients waiting in the emergency department was compared according to the factors related to emergency department itself (Group 1) and factors related to emergency department-hospital interrelation (Group 2). Group 1 and Group 2 results were not found statistically significant. In our study, length of stay in Group 2 (206.7 ± 145.2 min) was longer than Group 1 (95.5 ± 73.9 min). According to these results, it was considered that factors related to emergency department-hospital interrelation caused longer waiting times than factors related to emergency department
itself.
In a study conducted by Henneman and colleagues,21
16.6% of the patients who admitted to the emergency department stayed more than 6 hours and 51% of these patients were hospitalized. In the study conducted in a university hospital in the USA, the waiting times of patients for hospitalization are found as less than 1 hour for 24%, 1-3 hours for 36%, 3-12 hours for 12%, 12-24 hours for 2% and more than 24 hours for 5%. 22
In our study, the waiting times were found as less than 2 hours for 41.1%, 8-12 hours for 4.2% and more than 12 hours for 9.2% because of the lack of appropriate bed capacity. The length of stay in the emergency department for the 33 patients who waited more than 8 hours to gain access to the appropriate beds after diagnosis was approximately 15 hours. It was evaluated that patients wait longer in the emergency department because of the factors related to the hospital, and this causes overcrowding in the emergency department.
In the study conducted by Epinosa and colleagues,20 the number of patients waiting in the
emergency department is compared according to the factors related to emergency department itself (Group 1) and factors related to hospital itself (Group 3). Group 1 and Group 3 results were found statistically significant. In our study, length of stay in Group 3 (470.7 ± 364.7 min) was longer than Group 1 (95.5 ± 73.9 min). According to these results, it was considered that number of beds for hospitalization of the patients in the clinics and intensive care units was insufficient in our hospital.
Treatment of the patients who need hospitalization or conducting the process for elimination of the other serious injuries in the emergency department causes overcrowding. 19 In our study, the number of patients
who were given treatment and discharged despite the need of hospitalization was 88. The average waiting time of these patients was 720.7 ± 370.1 minutes. 3 patients were followed with mechanical ventilation and
3 patients were followed with air bag in the emergency department. Mean following time for the patients with mechanical ventilation was 6 hours and 4 hours for the patients with air bags.
Limitations of our study are considered as no evaluation of patient and doctor satisfaction, effects of long waiting times in the emergency department on costs and quality of patient care.
cONcLUsIONs
In our study that was conducted in Uludag University Faculty of Medicine Emergency Department, on the factors that cause long waiting times, the conclusion and suggestions can be stated as follows:
•
The most important reason of long waiting times in emergency departments is lack of beds for hospitalization in the clinics and intensive care units.•
A certain amount of beds in the hospital should be kept available at all times for the prospective hospitalization needs from the emergency department. In case there are patients in the emergency department waiting for hospitalization, re-scheduling of surgery and elective hospitalization programs should be considered.•
Another reason for the long waiting times is problems in the consultation mechanisms. The consultant resident doctor should have completed at least half of the residency period and the consultation items that are listed in the university's consultation directives should be responded in 30 minutes.•
Cooperation of the managers, relevant departments and a multi-disciplinary approach are necessary to achieve the goals to reduce overcrowding in the emergency departments.1. Cander B, İkizceli İ, Yıldırım C ve ark (2008) Acil servis hizmetlerinin iyileştirilmesi ve yeniden yapılanması. Akademik Acil Tıp Dergisi. 7: 9–16
2. Acil Sağlık Hizmetleri Yönetmeliği. Resmi gazete. Tarih: 11.05.2000 Sayı: 24046. Değişiklik: 24.03.2004 Sayı:25412. Değişiklik: 15.03.2007 Sayı:26463
3. Gardner RL, Sarkar U, Maselli JH, Gonzales R (2007) Factors associated with longer ED lengths of stay. Am J Emerg Med 25:643–650
4. Kılıçaslan İ, Bozan H, Oktay C, Göksu E (2005) Türkiye’de acil servise başvuran hastaların demografik özellikleri.
Türkiye Acil Tıp Dergisi 5:5–13
5. Moskop JC, Sklar DP, Geiderman JM, Schears RM, Bookman KJ (2009) Emergency department crowding, part 1–concept, causes, and moral consequences. Ann Emerg Med 53: 605–611
6. Liu S, Hobgood C, Brice JH (2003) Impact of critical bed status on emergency department patient flow and overcrowding. Acad Emerg Med 10:382–385
7. Cowan RM, Trzeciak S (2005) Clinical review: Emergency departmen overcrowding and the potential impact on the critically ill. Critical Care 9:291–295
8. Lee–Lewandroski E, Corboy D, Lewandroski K, et al. Implementation of a pointof–care satellite in the emergency department of an academic medical center. Impact on test turnaround time and patient emergency department length of stay. Arch Pathol Lab Med 2003;127:456–460
9. Han JH, France DJ, Levin SR, Jones ID, et al (2010) The effect of physıcıan triage on emergency department lenght of stay. J Emerg Med 39(2): 227-233
10. McCaig LF, Burt CW (2004) National hospital ambulatory medical care survey: 2002 emergency department summary. Adv Data 18:1–34
11. Howard MS, Davis BA, Anderson C, et al (2005) Patients’ perspective on choosing the emergency department for nonurgent medical care: a qualitative study exploring one reason for overcrowding. J Emerg Nurs 31:429–435
12. Carter AJE, Chochinov AH (2007) A systematic review of the impact of nurse practitioners on cost, quality of care, satisfaction and wait times in the emergency department. Can J Emerg Med 9:286–295
13. Nawar EW, Niska RW, Xu J (2007) National hospital ambulatory medical care survey: 2005 emergency department summary. Adv Data;29:1–32
14. Henneman PL, Nathanson BH, Li H, et al (2010) Emergency department patients who stay more than 6 hours contribute to crowding. J Emerg Med 3 9(1):105-112
15. Feferman I, Cornell C (1989) How we solved the overcrowding proplem in our emergency department. CMAJ 140:273–276
16. Derlet RW, Richards JR (2000) Overcrowding in the nation’s emergency departments: complex causes and disturbing effects. Ann Emerg Med 35:63–67
17. Cury DG, Wang DM (2006) Varition of consultations practice in urban emergency medicine physicians. Can J Emerg Med 8:182–183
18. Richards JR, Navarro ML, Derlet RW (2000) Survey of directors of emergency departments in California on overcrowding. West J Med 172:385–388
19. Derlet RW (2002) Overcrowding in emergency departments: increased demand and decreased capacity. Ann Emerg Med 39(4):430-432
20. Espinosa G, Miro O, Sanchez M, Coll–Vinent B, Milla J (2002) Effect of external and internal factors on emergency department overcrowding. Ann Emerg Med 39:693–695 21. Bernstein SL, Aronsky D, Duseja R, et al (2009) The effect
of emergency department crowding on clinically oriented outcomes. Acad Emerg Med 16:1–10
22. Garson C, Hollander JE, Rhodes KV (2008) Emergency department patient preferences for boarding locations when hospitals are at full capacity. Ann Emerg Med 51:9–12