Arterioscler Thromb Vasc Biol is available at www.ahajournals.org/journal/atvb
Correspondence to: Thorsten R. Doeppner, MD, MSc, Department of Neurology, University Medical Center Goettingen, Robert-Koch-Str. 40, 37075 Goettingen, Germany. Email [email protected]
The Data Supplement is available with this article at https://www.ahajournals.org/doi/suppl/10.1161/ATVBAHA.120.315031. For Sources of Funding and Disclosures, see page 1143.
© 2020 The Authors. Arteriosclerosis, Thrombosis, and Vascular Biology is published on behalf of the American Heart Association, Inc., by Wolters Kluwer Health, Inc. This is an open access article under the terms of the Creative Commons Attribution Non-Commercial-NoDerivs License, which permits use, distribution, and reproduction in any medium, provided that the original work is properly cited, the use is noncommercial, and no modifications or adaptations are made.
BASIC SCIENCES
Neural Progenitor Cell-Derived Extracellular
Vesicles Enhance Blood-Brain Barrier Integrity
by NF-κB (Nuclear Factor-κB)-Dependent
Regulation of ABCB1 (ATP-Binding Cassette
Transporter B1) in Stroke Mice
Lin Zhang, Irina Graf, Yaoyun Kuang, Xuan Zheng, Matteo Haupt, Arshad Majid, Ertugrul Kilic, Dirk M. Hermann, Marios-Nikos Psychogios , Martin S. Weber, Jasmin Ochs, Mathias Bähr, Thorsten R. Doeppner
OBJECTIVE: Extracellular vesicles (EVs) derived from neural progenitor cells enhance poststroke neurological recovery, albeit
the underlying mechanisms remain elusive. Since previous research described an enhanced poststroke integrity of the blood-brain barrier (BBB) upon systemic transplantation of neural progenitor cells, we examined if neural progenitor cell-derived EVs affect BBB integrity and which cellular mechanisms are involved in the process.
APPROACH AND RESULTS: Using in vitro models of primary brain endothelial cell (EC) cultures as well as co-cultures of brain ECs
(ECs) and astrocytes exposed to oxygen glucose deprivation, we examined the effects of EVs or vehicle on microvascular integrity. In vitro data were confirmed using a mouse transient middle cerebral artery occlusion model. Cultured ECs displayed increased ABCB1 (ATP-binding cassette transporter B1) levels when exposed to oxygen glucose deprivation, which was reversed by treatment with EVs. The latter was due to an EV-induced inhibition of the NF-κB (nuclear factor-κB) pathway. Using a BBB co-culture model of ECs and astrocytes exposed to oxygen glucose deprivation, EVs stabilized the BBB and ABCB1 levels without affecting the transcellular electrical resistance of ECs. Likewise, EVs yielded reduced Evans blue extravasation, decreased ABCB1 expression as well as an inhibition of the NF-κB pathway, and downstream matrix metalloproteinase 9 (MMP-9) activity in stroke mice. The EV-induced inhibition of the NF-κB pathway resulted in a poststroke modulation of immune responses.
CONCLUSIONS: Our findings suggest that EVs enhance poststroke BBB integrity via ABCB1 and MMP-9 regulation, attenuating
inflammatory cell recruitment by inhibition of the NF-κB pathway.
GRAPHIC ABSTRACT: A graphic abstract is available for this article.
Key Words: astrocytes ◼ blood-brain barrier ◼ endothelial cells ◼ extracellular vesicles ◼ matrix metalloproteinase 9
C
erebral ischemia induces blood-brain barrier (BBB) disruption, which allows intravascular molecules and immune cells to penetrate into the extracellu-lar compartment and into the brain parenchyma, result-ing in inflammatory responses and brain lesions.1 The BBB comprises endothelial cells (ECs) connected bytight junctions, astrocytic end-feet, pericytes, perivascular microglia, and an extracellular matrix.2 Many compounds are extruded through the barrier via ABC (ATP-binding
See accompanying editorial on page 1146
BA SIC SCI ENCES - V B
cassette) transporters such as ABCB1, also named P-gp (P-glycoprotein).
ABCB1 binds to a variety of structurally diverse mol-ecules and is mostly located on the luminal side of brain capillary ECs to transport substances towards the blood compartment.3 Not only is ABCB1 regulated under vari-ous pathological conditions like inflammation, oxidative stress, radiation, and heat shock,4–6 but it is also regulated under stroke conditions. As a matter of fact, ABCB1 is upregulated in cerebral ECs within 3 hours upon stroke induction.7 Although upregulation of ABCB1 in the ischemic brain lesion is likely a physiological response to export toxic metabolites, both neuroprotective mole-cules and inflammatory chemokines are also transported towards the luminal side of the endothelium.8–12 Hence, knockdown of ABCB1 decreases infarct size under experimental stroke conditions in mice.13
The stroke-induced regulation of ABCB1 expres-sion patterns is but one element of BBB breakdown, albeit an important one. Other factors such as the deg-radation of the extracellular matrix by the MMP (matrix metalloproteinases)-2 and MMP-9 play in concert as well.14 Interestingly, accumulating evidence from cancer research indicates that both ABCB1 and MMP-9 sig-naling are regulated by the NF-κB (nuclear factor-κB) signaling pathway.15–18 The role of the latter under stroke conditions has been extensively studied in previous reports.19–22 A therapeutically feasible tool that interferes with the aforementioned mutual signaling events under stroke conditions, however, does not exist.
Extracellular vesicles (EVs) form a heterogeneous group of vesicles ranging in size from 30 to 1000 nm, which con-tain noncoding RNAs, DNA, and proteins such as heat shock proteins and tetraspanins.23–25 Previous studies reported that stem cell-derived EVs are not inferior to stem cell transplan-tation itself. Although EVs derived from mesenchymal stem cells or neural progenitor cells (NPCs) and others partly induce neuroprotection by regulating poststroke immune responses,26–31 their precise way of action remains uncer-tain. Interestingly, EVs have recently been described to affect EC function under both physiological and pathological con-ditions.32 Studies involving the therapeutic potential of NPC-EVs with regard to poststroke BBB protection, however, do not exist. Using an in vitro BBB co-culture model of ECs and astrocytes as well as an in vivo murine stroke model, the present work analyzes such a potential effect of NPC-EVs and its underlying mechanisms. After demonstration of an EV-dependent impact on the integrity of the hypoxic/ ischemic BBB, further analyses will focus on the regula-tion of ABCB1 protein expression as well as on NF-κB and MMP-9 signaling under these conditions.
MATERIALS AND METHODS
The data that support the findings of this study are available from the corresponding author upon reasonable request.
Cell Cultures
Mouse brain ECs (bEnd.3, CRL-2299, American Type Culture Collection, Manassas, VA) were seeded in tissue culture-plates (Sarstedt, Nuembrecht, Germany) and cultured under confluent conditions at a density of 6×10⁴ cells/cm2. Cells were cultured
with 10% fetal bovine serum-containing medium (DMEM/ Ham’s F-12, Biochrom GmbH, Berlin, Germany).
Nonstandard Abbreviations and Acronyms
ABCB1 ATP-binding cassette subfamily B mem-ber 1 transporter
BBB blood-brain barrier
CM conditioned medium
EBA Evans blue-albumin
ECs endothelial cells
EVs extracellular vesicles
LY Lucifer Yellow
MCAO middle cerebral artery occlusion
MMP-9 matrix metalloproteinase-9
NF-κB nuclear factor-kappa B
NPCs neural progenitor cells
NTA nanoparticle tracking analysis
OGD oxygen glucose deprivation
PEG polyethylene glycol 6000
P-gp P-glycoprotein R123 rhodamine 123
TER transcellular electrical resistance
ZO-1 zonula occludens-1
Highlights
• Oxygen glucose deprivation induces blood-brain barrier disruption including increased ABCB1 (ATP-binding cassette subfamily B member 1 transporter) and reduced tight junction protein ZO-1 (zonula occludens 1) in endothelial cells.
• Extracellular vesicles derived from neural progenitor cells attenuate oxygen glucose deprivation-induced upregulation of ABCB1 via inhibiting the NF-κB (nuclear factor-κB) pathway in endothelial cells. • Neural progenitor cells-extracellular vesicles
regu-late blood-brain barrier properties by diminishing barrier permeability and ABCB1 activity in vitro using a co-culture model.
• Extracellular vesicle administration mitigates upregula-tion of ABCB1 and MMP-9 (matrix metalloproteinase 9) and activation of the NF-κB pathway after stroke. Additionally, it decreases postischemic infiltration of leukocyte invasion into the ischemic hemisphere.
BA SIC SCI ENCES - V B
Primary mouse brain EC were isolated according to a modi-fied version of the method of Assmann et al.33 Briefly, 4 male
C57BL/6J mice were euthanized and whole brains removed and stored in HBSS buffer on ice. Under aseptic conditions, the brain stem, cerebellum, and meninges were removed in turn. The corti-cal tissue homogenate was pelleted by centrifugation at 1350g for 5 minutes at 4 °C. The pellet was resuspended in 10 mL dex-tran solution and vortexed extensively (2 minutes). The mixture was pelleted by centrifugation at 3900g for 10 minutes at 4 °C. The pellet was resuspended in prewarmed digestion medium and incubated at 37 °C for 1 hour with gentle shaking. After diges-tion, the microvessel fragments were pelleted by centrifugation at 1350g for 5 minutes at room temperature and washed once in PBS. The resulting microvessel fragments were resuspended in full medium (DMEM/F12 with 20% plasma-derived serum, L-glutamine, heparin, puromycin, antibiotic/antimycotic, and EC growth supplement). ECs were cultivated on 10 µg/cm2 collagen
IV-coated flasks, plates, or Transwell systems at 37 °C.
Primary mouse brain astrocytes were prepared using a pro-tocol based on the method of Schildge et al.34 Four C57BL/6J
mouse pups at postnatal day 0 to 2 were decapitated and whole brains removed and placed in HBSS on ice. From each brain, both the cerebellum and the olfactory bulbs were removed with a sterile blade. The meninges were dissected from the cortex hemispheres by pulling with forceps. Pooled cortical tissue was digested with 0.25% trypsin at 37 °C for 30 minutes. Then the cell suspension was centrifuged at 300g for 5 minutes. The resulting pellet was suspended in 20 mL of astrocyte full medium (DMEM supplemented with 10% FBS and 1% penicillin/streptomycin) and cultivated on Poly-D-lysine-coated T75 flask. The astrocytes were cultured for 1 week (37 °C, 5% CO2) before a full medium
change to remove nonadherent cell debris. The astrocytes were passaged with 0.25% trypsin and resuspended in full medium at a density of 6×10⁴ cells/cm2 for the upcoming experiments.
EV Enrichment From Cultured NPCs
The NPC preparation and EV enrichment were based on the method of Zheng et al.31 Briefly, C57BL/6J mouse pups at
post-natal day 0 to 2 were decapitated and whole brains removed and placed in HBSS on ice. Thereafter, the subventricular zone was dissected in cold PBS under microscopic control, followed by spin-ning down tissue chunks at 200g for 1 minute at 4 °C. The pellet was suspended and incubated with 0.05% trypsin for 15 min-utes. Each cell pellet was resuspended with NPC culture medium (DMEM/F12 with B27, L-glutamine, 1% penicillin/streptomycin, 20 ng/mL of FGF-2 [fibroblast growth factor-2], and 20 ng/mL EGF [epidermal growth factor]). The mixture was pelleted by cen-trifugation at 400g for 15 minutes at room temperature followed by washing steps 3× with NPC medium. The resulting pellet was resuspended with NPC medium, and the cells were plated onto the cell culture dish. The neurospheres were observed within 72 hours. The cell passage period of NPCs was 5 to 6 days.
After passage 3, NPCs were transferred to T75 flasks with 30 mL NPCs culture medium without growth factors. NPC-conditioned medium (NPC-CM) was collected after 24 hours of incubation under standard cell culture conditions. Large vesicles and debris were removed by filtration through 220 nm pore fil-ters (TPP Techno Plastic Products AG, Trasadingen, Switzerland). EVs were enriched from the NPC-CM using the polyethylene glycol (PEG) precipitation method as previously described.24,35
In brief, PEG precipitation was performed at a final concentra-tion of 10% PEG 6000 (50% wt/vol; Merck Group, Darmstadt, Germany) and 75 mmol/L NaCl. After incubation for 12 hours at 4 °C, the EVs were concentrated by centrifugation for 45 minutes at 4500g. EVs pellets were dissolved in PBS and pre-cipitated by ultracentrifugation for 2 hours at 110 000g (Optima XPN-80 Ultracentrifuge, Beckman Coulter, Brea). The EV pellets were resuspended in PBS to a concentration of 500 µL contain-ing EVs obtained from CM of 432×106 NPCs. Aliquots of 500
µL each were stored at −80 °C until usage. For the ultracentri-fugation method, the NPC-CM was centrifuged for 2 hours at 110 000g to pellet EVs and washed with PBS by a centrifugation at 110 000g subsequently (Figure IIIA in the Data Supplement).
EV Characterization and Purification of
NPC-EVs
Details about transmission electron microscopy, nanoparticle tracking analysis (NTA), Western blotting of EV markers, pro-teomic analysis, and iodixanol gradient centrifugation can be found in Materials and Methods I in the Data Supplement.
Importantly, the amount of NPC-EVs applied to cells was calcu-lated by the following process. The EVs from 432×106 NPCs were
diluted in 500 µL of PBS, each microliter contained 8.64×10⁵ cell
equivalent EVs (8.64×10⁵ cell equivalent/µL, 43.2 µg/µL). In our
previous experiments, several different NPC-EV concentrations (0.1, 1, and 10 µg/mL of the culture medium or BSS0 [glucose-free balanced salt solution] solution) were chosen to investigate the optimal EV dosage of the experiment. For the optimal EV con-centration in vitro, we suggested EVs to be diluted to 2×10⁴ cell
equivalents per milliliter (1 µg/mL) in cell culture medium or BSS0 solution (Figure IC and ID in the Data Supplement).
When fluorescent EVs were needed, the supernatant was incubated with 10 µmol/L DiI, a lipophilic membrane dye, for 1 hour at 37 °C in the dark. DiI-labeled EVs were separated from extra DiI dye in the light fraction and protein aggregates in the dense fractions by the aforementioned iodixanol gradient cen-trifugation. Different fractions were washed with PBS and recen-trifuged. Pellets with DiI-labeled EVs were applied for EV tracking, and the pellets from F9-10 fractions lacking EVs were used as negative controls for the following in vitro and in vivo experiments.
Oxygen Glucose Deprivation
The cells were exposed to oxygen glucose deprivation (OGD) when they reached 90% confluence. For OGD, the cells were incubated in BSS0 solution (116 mmol/L NaCl, 5.4 mmol/L KCl, 0.8 mmol/L MgSO4, 1 mmol/L NaH2PO4H2O, 26.2 mmol/L NaHCO3, 10 mmol/L HEPES, 0.01 mmol/L glycine, and 1.8 mmol/L CaCl2, pH 7.2–7.4) and transferred to a hypoxia incu-bator chamber containing 0.2% O2, 5% CO2, and 70% humidity (Toepffer Lab Systems, Göppingen, Germany). For reoxygenation after removing the BSS0 solution, the cells were incubated in the cell culture medium for 24 hours in the 5% CO2 incubator at 37 °C. Thereafter, the cells were treated for the next experi-ments. bEnd.3 cells were exposed to 16 hours of OGD, whereas the co-culture systems were treated with 24 hours of OGD as primary cells possessed robust tolerance. For in vitro experiments, EV treatment was performed during OGD and during reoxygen-ation periods.
BA
SIC
SCI
ENCES
- V
B
Cell Survival Assay
Cell viability was measured by a colorimetric assay by using the MTT (methylthiazolyldiphenyl-tetrazolium bromide; Thiazolyl Blue Tetrazolium Bromide, Sigma-Aldrich, St. Louis, MO) viabil-ity assay according to the protocol.36 Cell viability data are
pre-sented as relative changes in percent compared with untreated controls. Furthermore, the cell death rate was also determined via fluorescence microscopy by using a LIVE/DEAD Viability kit (Lonza, Basel, Switzerland) as directed by the manufactur-er’s instructions. Living cells were identified with calcein AM (acetoxymethyl; 4 µmol/L, green fluorescence), and dead cells were identified with ethidium homodimer 1 (2 µmol/L, red fluo-rescence). Three independent experiments were conducted and ≥200 cells were evaluated for each condition.
In Vitro Co-Culture BBB Model and TER
Measurement
To establish a valid in vitro co-culture BBB model, the system consisted of primary ECs and astrocytes as described before. ECs were seeded on a microporous membrane in the upper compartment, whereas astrocytes were put in the bottom com-partment, representing luminal and abluminal sides of the BBB, respectively. According to the timeline in Figure 4B, the isolation and purification of astrocytes was done first. When astrocytes were grown to 90% confluence, astrocytes were passaged with 0.25% trypsin, and seeded into Poly-D-lysine-coated 24-well metal plates of the cellZscopeE instrument (nano-Analytics, Münster, Germany). These were prepared at least 3 days before the inserts with ECs were placed to the 24-well plate. ECs grown on collagen IV-coated inserts (0.4 µm pore diameter, translucent, Greiner Bio-One GmbH, Frickenhausen, Germany) were transferred to the cellZscopeE instrument to establish a co-culture system 2 days after isolation of ECs. Puromycin was added to the full medium during these 2 days to remove non-ECs. After the start of the experiment, transcellular electrical resistance (TER) values of the barrier were measured automatically every single hour under different treatment para-digms by means of impedance measurement.37–40 The latter
was paused during the OGD treatment period itself.
BBB Permeability Studies With EBA and LY
The flux of different sized molecules such as Lucifer Yellow (LY) and Evans blue-albumin (EBA) across the EC layers of the in vitro BBB model was determined as previously described.41Cell culture inserts were transferred to 24-well tissue culture plates containing a 0.8 mL permeability assay buffer (141 mmol/L NaCl, 2.8 mmol/L CaCl2, 1 mmol/L MgSO4, 4 mmol/L KCl, 1 mmol/L NaH2PO4, 10 mmol/L glucose, and 10 mmol/L
HEPES, pH 7.4) in the bottom or abluminal compartment. In the inserts (luminal compartment), the culture medium was replaced by 0.2 mL buffer containing 50 µmol/L LY (molecular weight: 457.25 Da) or 4% BSA mixed with 0.67 mg/mL Evans blue dye (EBA; molecular weight: 67 000 Da). Samples (200 µL) were collected from each bottom well at 15, 30, 45, 60, and 120 minutes to a 96-well plate for next detection. After removing the samples, we immediately replaced with fresh permeability assay buffer of each well. The concentrations of LY at different time points were determined with a POLARstar Omega Multimode Plate Reader (BMG LABTECH GmbH, Ortenberg, Germany)
using a fluorescein filter pair (Ex[λ] 485±10 nm; Em[λ] 530±10 nm). The EBA concentration of the abluminal chamber at differ-ent time points were measured by determining the absorbance of samples at 630 nm photometrically.37,38,41–43 The
transendo-thelial permeability coefficient Pcells was calculated as described
in analysis of in vitro permeability data.
Analysis of In Vitro Permeability Data
The permeability coefficient was calculated according to the method described by Dehouck et al.44 The transferred volume
(µL) of the tracer diffusing from the abluminal to the luminal chamber was calculated for each tracer using the following equation: transferred volume (µL)=[C]Abluminal×VAbluminal/[C]Luminal,
where [C]Luminal is the tracer concentration on the side of the chamber, [C]Abluminal is the tracer concentration on the opposite
side of the chamber, and VAbluminal is the volume of the opposite side of the chamber loaded with the tracer. During the experi-ment, the transferred volume increased linearly with time, and the slope was estimated by linear regression analysis. The clearance slopes of the transferred volume curves for the barri-ers were denoted by PScells+membrane where PS is the permeability-surface area product (in µL/min). The slope of the transferred volume curve with the control membrane was denoted by PSmembrane. The control membrane was the cell free transwell insert membrane. The permeability clearance for the in vitro BBB models (PScells) was calculated from 1/PScells+membrane=1/ PSmembrane+1/PScells. The PScells values were divided by the
sur-face area of the transwell inserts to generate the permeability coefficient (Pcells, in cm/min).38,41,43
Rhodamine 123 Accumulation Assay
ABCB1 activity was determined by measuring intracellular accu-mulation of rhodamine 123 (R123) in bEND.3 cells or primary ECs in different groups as previously reported.41–43 Briefly, the ECs
were incubated at 37 °C for 60 minutes with R123 (5 µmol/L) after different treatment paradigms. After washing with PBS, the cells were lysed at 37 °C for 15 minutes with 0.8% Triton X-100 in PBS. The protein concentrations of cell lysates were determined by the BCA assay. The concentration of R123 was measured using a POLARstar Omega Multimode Plate Reader (Ex[λ] 485±10 nm; Em[λ] 530±10 nm; BMG LABTECH GmbH, Ortenberg, Germany). The R123 accumulation level was normal-ized to the protein concentration within the ECs.
MCAO and EV Administration
All animal studies were performed with governmental approval according to the National Institutes of Health guidelines for the care and use of laboratory animals. The induction of tran-sient focal cerebral ischemia in male C57BL/6J mice aged 10 weeks (Janvier Labs, Le Genest-Saint-Isle, France) was obtained using the middle cerebral artery occlusion (MCAO) model as previously described. Only male mice were stud-ied to avoid the interference of the hormonal disturbances of female mice after MCAO surgery. In short, under anesthesia with 2% isoflurane and 0.8 L/min O2, the right common carotid artery was isolated and a 6-0 nylon silicon-coated monofila-ment (Doccol Corporation, MA) inserted. The filamonofila-ment was gen-tly pushed forward towards the MCA where it was placed for 60 minutes. After filament removal, the wounds were carefully
BA SIC SCI ENCES - V B
sutured. The occlusion and reperfusion were monitored under constant laser doppler flow. The mice were exposed to MCAO followed by administration of normal saline and EVs (from equivalent 2×10⁵ NPCs, 10 µg/200 µL) via femoral vein
injec-tions at the onset of reperfusion and at 6 hours post-MCAO. This optimal EV concentration in vivo was chosen according to previous studies from our group.31 For the sham group,
ani-mals underwent the very same procedure except for insertion of the nylon filament and were given the saline administration at the same time points. All mice were euthanized at 24 hours post-MCAO, and brain samples were prepared for the Western blotting and immunofluorescence staining.
Preparation of Brain Microvessel Fractions
Enriched microvessel fractions were obtained from brain samples of C57BL/6J mice submitted to sham surgery, MCAO and MCAO treated with EV injection. According to the method of Spudich et al,7 brain samples from animals belonging to the same groupwere pooled, weighed, and homogenized in cold Ringer solution containing 1% BSA, 10 mmol/L N-2-hydroxyethylpiperazine-N-2-ethanesulfonic acid, and 5% protease inhibitor (pH 7.4). The homogenate was centrifuged at 1500g for 15 minutes. Thereafter, the pellet was resuspended and again centrifuged (10 minutes, 1500g). The pellet was suspended in 0.25 mol/L sucrose at pH 7.0, layered over a 1.0 to 1.5 mol/L sucrose gradient, and centrifuged for 30 minutes at 58 000g using a Beckmann ultra-centrifuge. This ultracentrifugation produced 3 distinct fractions of which the pellet represents the enriched cerebral microvessel fraction. The latter was prepared for Western blotting.
Evans Blue Extravasation
BBB integrity was evaluated by Evans blue extravasation, which was performed as previously described.45,46 Briefly, 100
µL of 2% Evans Blue dye (Sigma-Aldrich, Darmstadt, Germany) was administered via the femoral vein 2 hours before eutha-nize. Subsequently, the mice were euthanized and transcardially perfused with PBS. The ischemic hemispheres were weighed, homogenized in 2 mL of 50% trichloroacetic acid, and centri-fuged at 10 000 rpm for 20 minutes. The extracted Evans Blue dye was further diluted with ethanol, and the absorbance at 620 nm wavelength was measured photometrically. The Evans Blue concentration was based on a standard curve (2.5 to 500 ng/mL) calculated. Evans blue extravasation of each group was evaluated, which is given as (µg) Evans Blue per (g) tissue.
Gelatin Zymography
The gelatin zymography measurement was performed with affinity-support purification as previously described.47,48 In short,
hemispheres were lysed in a nonreducing lysis puffer contain-ing 50 mmol/L Tris-HCl (pH 7.6), 150 mmol/L NaCl, 5 mmol/L CaCl2, 0.05% BRIJ-35, 0.02% NaN3, and 1% Triton X-100 and
afterwards centrifuged at 12 000 rpm for 5 minutes. After col-lecting the supernatant, the protein concentration was measured (Pierce BCA Protein Assay Kit, Thermo Fisher Scientific), and the samples were incubated with 1:10 volume of sepharose 4B (Sigma-Aldrich, Darmstadt, Germany) for 60 minutes at 4 °C. After incubation and centrifugation, the purified pellet was resuspended in lysis buffer containing 10% DMSO. Equal amounts of volume were then incubated with nonreducing sample buffer (Carl Roth,
Karlsruhe, Germany) and loaded on 8% polyacrylamide contain-ing 0.1% gelatin. After electrophoresis, the gel was incubated in renaturing buffer containing 2.5% Triton X-100 under gentle agitation for 30 minutes. Then, the gel was washed twice and incubated for 48 hours at 37 °C with developing buffer (Novex). After incubation, the gel was stained with 0.1% Coomassie Blue for 30 minutes and then distained in washing solution contain-ing 40% methanol and 10% acetic acid. After distaincontain-ing, a white band remained behind a dark blue background. Thereafter, the gels were scanned and densitometrically analyzed.
Western Blot and NF-κB p65 Activation Assay
The brain microvessel fractions and the cell samples were lysed in a buffer containing 50 mmol/L Tris, 1% Triton X 100, 131 mmol/L sodium chloride, 1 mmol/L sodium diphosphate, 1 mmol/L sodium fluoride, 1 mmol/L EDTA, 1% protease inhibitor, and 1% phosphatase inhibitor with a homogenisa-tor for 10 minutes and subsequently centrifuged at 4 °C with 16 000 rpm for 10 minutes. The supernatant was collected, and quantification of the protein concentration was photometrically accomplished (Pierce BCA Protein Assay Kit, Thermo Fisher Scientific). Reducing sample buffer (Carl Roth, Karlsruhe, Germany) was added, and the samples were heated for 5 minutes at 95 °C. The samples were not recommended to be heated for ABCB1 blots according to the antibody datasheet provided by Abcam. Equal amounts of protein were separated on 8% to 12% SDS-PAGE and transferred onto nitrocellulose membranes (Bio-Rad, CA). Following transfer, the membranes were blocked for 1 hour and incubated with the primary anti-bodies ZO-1, ABCB1, NF-κB p65, IκBα (inhibitor of nuclear factor-κB), Histone H3, β-actin, α-tubulin, and GAPDH over-night. After washing with tris-buffered saline supplemented with 0.1% Tween 20 detergent 3×, the blots were incubated with horseradish peroxidase coupled secondary anti-mouse-antibody and anti-rabbit-anti-mouse-antibody (1:10 000) for 1 hour. The specific antibody working dilutions are given in the resource table I in the Data Supplement. The membranes were bathed in ECL (enhanced chemiluminescence) reagent and devel-oped with the imaging system ChemiDoc XRS+ (Bio-Rad). For assessment of NF-κB translocation, an NF-κB activation kit (FIVEphoton Biochemicals, CA) was used, thus discriminating between both cytoplasm and nuclear fractions of NF-κB p65.Immunohistochemistry and
Immunocytochemistry Staining
Brain samples from C57BL/6J mice after perfusion were fixed in 4% paraformaldehyde overnight, dehydrated with 30% sucrose, and prepared in 16 µmol/L cryostat sections. The brain sections were blocked with buffer containing 2% BSA, 10% donkey serum, 0.25% Triton X-100 in PBST (phosphate-buff-ered saline solution with Tween detergent). Then, the sections were incubated overnight with the following primary antibod-ies: ZO-1, CD31, GFAP (glial fibrillary acidic protein), S100B, NF-κB p65, and MMP-9. Thereafter, the sections were incu-bated for 1 hour with the following appropriate Cy-3-labeled or Alexa Fluor 488-labeled secondary antibodies (1:10 000, Jackson ImmunoResearch, Ely, United Kingdom) followed by 4′,6-Diamidin-2-phenylindol (DAPI, 1:10 000; AppliChem, Darmstadt, Germany) staining. For cells, the slides or wells
BA
SIC
SCI
ENCES
- V
B were fixed with 4% paraformaldehyde and blocked using 10% DS, 1% BSA in PBST before incubation with the primary
anti-body. Five pictures per hemisphere were taken in the striatum as our region of interest, and 5 pictures per well of cells were taken with the Axioplan 2 fluorescence microscope (Carl Zeiss, Jena, Germany). The software ImageJ (National Institutes of Health) was used for cell counting and intensity quantification.
Flow Cytometry Analysis
Infiltrating leukocytes and the subset of T cells, B cells, neu-trophils, macrophages, and monocytes were determined by flow cytometry with a fluorescence-activated cell sorter as described previously.49 Briefly, the ischemic hemispheres were
mechanically homogenized in lysis buffer (0.5% BSA, 5% glu-cose, DNase [10 mg/mL], PBS) and centrifuged at 1600 rpm for 10 minutes. Thereafter, the pellet was solved in 30% Percoll solution (GE Healthcare) and loaded on the Percoll gradient containing 45% and 70% Percoll phases. Following centrifuga-tion, the leukocytes between the phases were aspirated and solved in working solution (3% fetal bovine serum in PBS). After washing, the cells were incubated with anti-CD3 (Becton Dickinson), anti-CD45, anti-Ly6G, anti-Ly6C, anti-CD19, and anti-CD11b antibodies (BioLegend, San Diego, CA) overnight. Gating and quantification were obtained with the software FlowJo v. 10.5.3 (BD FACSDiva).
Statistical Analysis
Results are shown as means±SD. All data were normally distrib-uted as indicated by the Kolmogorov-Smirnov test. Accordingly, parametric tests were applied. Statistical analysis was performed using the Student t test to compare 2 groups. The statistical sig-nificance of differences between several groups were assessed by a 1-way ANOVA and a 2-way ANOVA for factorial comparisons and by Bonferroni or Tukey-Kramer test for multiple comparisons. Differences were considered significant when P values were <0.05, using GraphPad Prism 6.0 (GraphPad, San Diego, CA).
RESULTS
OGD-Induced Regulation of ABCB1 and ZO-1
in ECs
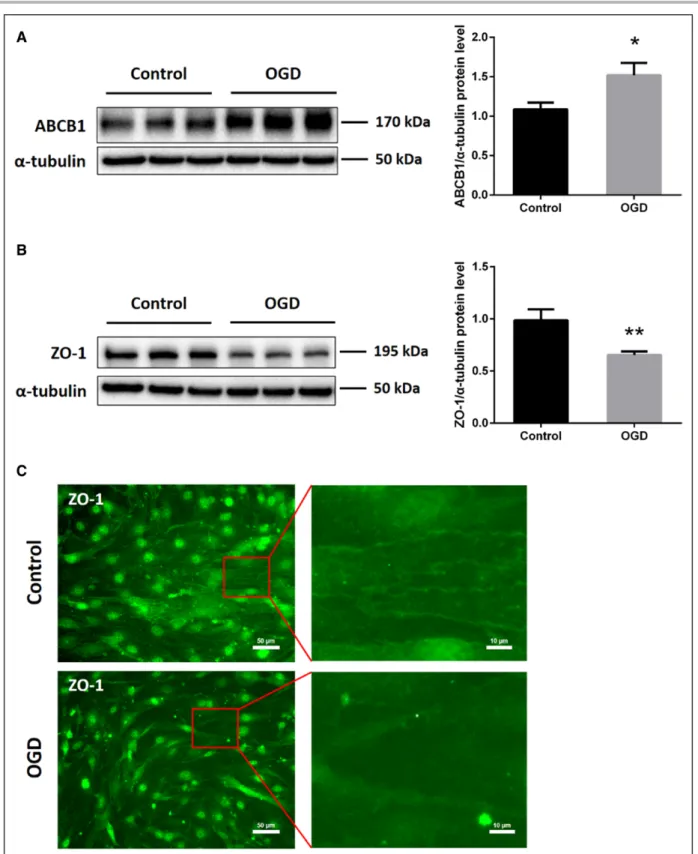
Protein levels of the efflux transporter ABCB1, one of the most important transporters of the BBB, were increased in ECs exposed to 16 hours of OGD (Figure 1A). On the contrary, both immunofluorescence staining and Western blotting revealed reduced expression of the tight junction protein ZO-1 in the OGD in vitro model (Figure 1B and 1C). These results suggest that the endothelium OGD model chosen is associated with an upregulation of ABCB1 and the loss of tight junction proteins, mimicking the BBB breakdown in vitro.
Purification, Isolation, and Characterization of
NPC-EVs
Primary NPCs were isolated from the mouse subventric-ular zone, and NPC-EVs were enriched by using 2 well
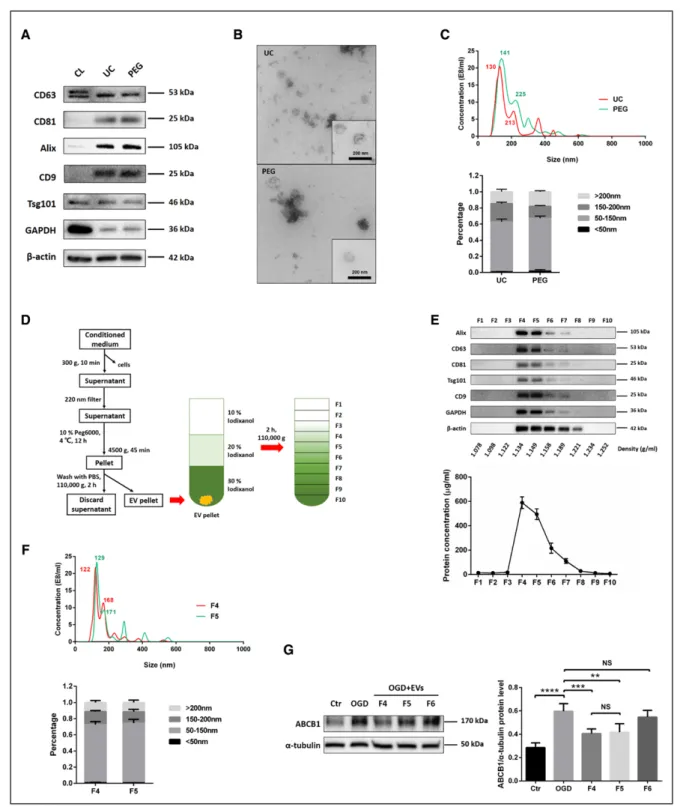
established methods, that is, ultracentrifugation and PEG. The subsequent characterization of such enriched NPC-EVs included Western blot of EV biomarkers, transmission electron microscopy, and NTA. EV enrichment using either ultracentrifugation or PEG revealed the presence of com-monly reported EV biomarkers such as Alix, Tsg101, CD63, CD9, and CD81 compared with NPC cell lysate groups (Figure 2A). Transmission electron microscopy analysis showed no significant morphological differences between ultracentrifugation-EVs and PEG-EVs, as both preparations contained smaller and larger vesicles (Figure 2B). NPC-EVs were further quantified and evaluated for size using NTA, which displayed an EV-like spectrum in both groups. The distribution patterns from the NTA results revealed the majority of NPC-EVs to be at about 50 to 150 nm in size in both groups (Figure 2C). According to the above results, we found that there is no significant difference between these 2 enriched methods from CM of NPCs. Given that the PEG method can greatly reduce the amount of work and improve the enriched efficiency, we applied the PEG method to enrich NPC-EVs for the remainder of the study. In parallel, we performed a proteomic analysis on PEG enriched EVs, confirming the presence of the aforementioned EV mark-ers (Data Supplement II). To further discriminate EVs from non-EV nanoparticles and protein, we applied an iodixanol gradient centrifugation to subfractionate EVs (Figure 2D). Ten fractions (F1-F10) were recovered and analyzed for the presence of protein markers like Alix, CD63, CD81, Tsg101, and CD9. As shown in the representative West-ern blots, the samples floated mostly in fractions F4 and F5 (1.134–1.149 g/mL). Consistently, protein concentrations revealed a vast majority of protein to be in fractions F4 and F5 (Figure 2E). These 2 fractions were further quantified and evaluated for size by NTA, which reflects a similar size distribution pattern in these vesicles (Figure 2F). Thereafter, the effect of fractions F4 to F6 were studied with regard to the expression of ABCB1 after OGD treatment. As shown in Figure 2G, EVs from F4 and F5 reversed the OGD-induced increase of ABCB1, whereas the samples from F6 had no effect in that respect. Given the aforementioned similar characterization between F4 and F5 fractions, we collected and pooled fractions F4 and F5 as purified EVs for further experiments.
NPC-EVs Reverse the OGD-Induced
Upregulation of ABCB1 and Inhibit the
Activation of the NF-κB Without Affecting Cell
Survival Directly
As shown in Figure 1, ABCB1 protein abundance is increased upon induction of OGD. The application of NPC-EVs, however, reversed the OGD-induced increase of ABCB1. Of note, expression patterns of ZO-1 were not affected by EV treatment (Figure 3A and 3B). Analysis of the NF-κB pathway, which is known to be activated in cerebral ischemia contributing to pronounced brain injury,22
BA SIC SCI ENCES - V B
demonstrated that induction of OGD resulted in an activa-tion of that pathway. In detail, NF-κB p65 protein abun-dance was increased whereas IκBα protein expression was
decreased. This OGD-induced activation was abolished by EV treatment (Figure 3C and 3D). Since OGD triggers cyto-toxicity and cell death, we next asked the question whether
Figure 1. In vitro oxygen glucose deprivation (OGD) induces upregulation of ABCB1 (ATP-binding cassette subfamily B member 1 transporter) and reduces tight junction protein ZO-1 (zonula occludens 1) expression in endothelial cells (ECs; bEnd.3). bEnd.3 were exposed to 16 h of OGD followed by 24 h of reoxygenation with normal cell culture medium. A and B, Quantitative measurement of ABCB1 and ZO-1 protein expression using Western blot analysis normalized with the housekeeping protein α-tubulin (n=5 per group). Data are expressed as mean±SD; *P<0.05, **P<0.01. C, Nonquantitative immunofluorescence staining of ZO-1 in adjacent ECs, depicting representative staining areas. Scale bars: 50 µm. Red squares show magnifications of indicated areas. Scale bars: 10 µm.
BA SIC SCI ENCES - V B
Figure 2. Purification, isolation, and characterization of extracellular vesicles (EVs) derived from NPCs (NPC-EVs).
EVs were enriched from conditioned medium of NPCs by ultracentrifugation (UC) and by polyethylene glycol (PEG) precipitation. A, Western blot analysis of EVs against exosomal markers such as CD9, CD63, CD81, Tsg101, and Alix, with β-actin serving as a loading control. Western blots were performed on total cell lysates (CL) and EV lysates obtained using either UC or PEG. B, Representative transmission electron microscopy (TEM) analysis from EVs enriched by either UC or PEG. Scale bar: 200 nm. C, Nanoparticle tracking analysis (NTA) from enriched EVs (UC and PEG) depicting size distribution patterns. D, Resuspended EVs enriched by PEG were allowed to float into an overlayed iodixanol gradient to purify and separate different EV populations. E, The iodixanol gradient fractions for PEG were analyzed by Western blotting (fraction F1–10) using exosomal markers. Equivalent volumes of each fraction were loaded per lane. Representative images are shown for CD9, CD63, CD81, Tsg101, and alix which were enriched in fraction F4 and F5. The protein concentration of each fraction was calculated by the BCA assay, indicating a vast majority of protein to be in fraction F4 and F5 (n=3 per group). F, NTA was used to analyze enriched EVs in fraction F4 and F5 depicting size distribution patterns. G, Quantitative analysis of ABCB1 (ATP-binding cassette subfamily B member 1 transporter) expression in ECs under normoxic conditions (Ctr) as well as under OGD conditions and under conditions of OGD-exposed ECs treated with EV fractions F4–F6 using Western blot analysis (n=3 per group). Data are expressed as mean±SD. NS: no significance, **P<0.01, ***P<0.001, and ****P<0.0001.
BA SIC SCI ENCES - V B
or not the regulation of ABCB1 in ECs is merely an indirect consequence of different cell survival rates due to EV treat-ment. We, therefore, performed survival assays (MTT and LIVE/DEAD) as shown in Figure 3E and 3F. Exposure of
ECs to OGD resulted in a significant cell death rate. How-ever, incubation of ECs with EVs did not affect cell sur-vival directly; there was no significant difference between controls and EV-treated cells in this respect. This finding
Figure 3. Neural progenitor cell (NPC)-extracellular vesicles (EVs) reverse upregulation of ABCB1 (ATP-binding cassette subfamily B member 1 transporter) and activation of NF-κB (nuclear factor-κB) in endothelial cell (ECs) under both oxygen glucose deprivation (OGD) and lipopolysaccharide (LPS) conditions. A and B, Quantitative analysis of ZO-1 (zonula occludens 1) and ABCB1 expression in normoxia control, OGD and OGD treated with EVs using Western blot analysis normalized with the housekeeping protein α-tubulin (n=4 per group). C and D, Quantitative analysis of p65 and IκBα (inhibitor of nuclear factor-κB) expression associated with the NF-κB pathway in the same three groups using Western blot analysis normalized with the housekeeping protein α-tubulin (n=4 per group). E, Cell viability was analyzed in ECs exposed to 16 h of OGD followed by 24 h of reoxygenation using the MTT (methylthiazolyldiphenyl-tetrazolium bromide) assay (n=5 per group). Cells incubated under normoxic conditions were defined as 100% cell survival. F, The LIVE/DEAD assay uses the same conditions as mentioned for the MTT assay. The photos display representative immunofluorescence stainings of calcein AM (acetoxymethyl; LIVE cells, green) and ethidium homodimer-1 (DEAD cells, red). Scale bars: 200 µm (n=5 per group). G and H, Quantitative analysis of p65 and ABCB1 expression under control conditions and in ECs exposed to LPS 200, 500, or 1000 ng/mL using Western blot analysis normalized with the housekeeping protein β-actin or α-tubulin (n=4 per group). I and J, Quantitative analysis of p65 and ABCB1 expression in normoxia control, LPS (1000 ng/mL) and LPS-treated ECs in the presence of EVs using Western blot analysis normalized with the housekeeping protein β-actin or α-tubulin (n=4 per group). Data are expressed as mean±SD. *P<0.05, **P<0.01, ***P<0.001, and ****P<0.0001.
BA SIC SCI ENCES - V B
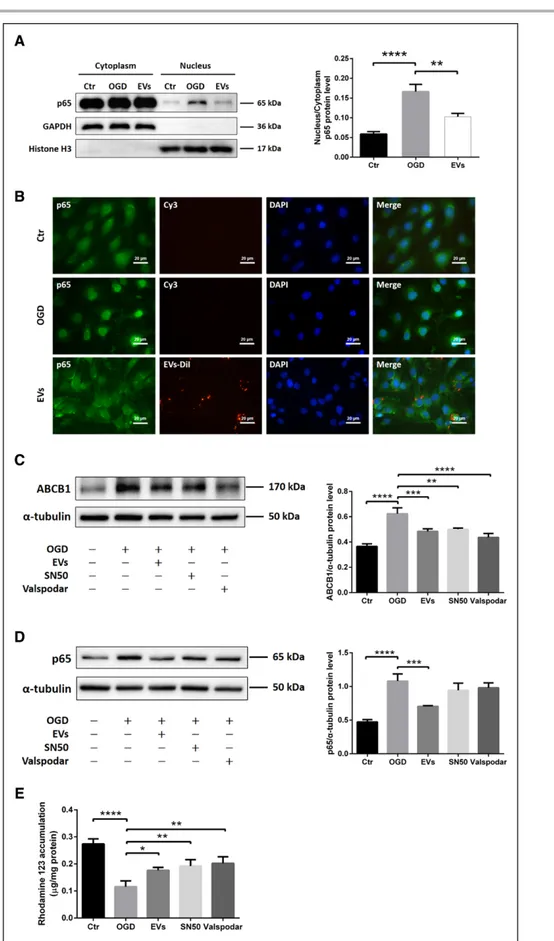
Figure 4. Extracellular vesicles (EVs) attenuate oxygen glucose deprivation (OGD)-induced upregulation of ABCB1 (ATP-binding cassette subfamily B member 1 transporter) via inhibiting the NF-κB (nuclear factor-κB) pathway.
A, Quantitative analysis of p65 expression of cytoplasm and nucleus fractions in normoxia control, OGD, and OGD treated with EVs groups using Western blot analysis normalized with the housekeeping proteins GAPDH in the cytoplasm fractions and Histone H3 in the nucleus fractions. B, Nonquantitative immunofluorescence staining of p65 (green), EVs-DiI (red), and DAPI (blue) in 3 groups (Continued )
BA SIC SCI ENCES - V B
supports the hypothesis that NPC-EVs regulate ABCB1 expression patterns under OGD conditions independent from survival rates of cultured ECs.
NPC-EVs Reverse Lipopolysaccharide-Induced
Activation of NF-κB and Increase of ABCB1
Evidence suggests that treatment with the bacterial com-ponent lipopolysaccharide can activate the NF-κB path-way in ECs.50,51 To further study an effect of EVs inhibiting the NF-κB pathway, we applied different concentrations of lipopolysaccharide (200, 500, and 1000 ng/mL) in cultured ECs. As shown in Figure 3G and 3H, both the expression of p65 and ABCB1 were increased by the dose-dependent lipopolysaccharide treatment compared with controls. Incubation of ECs with EVs significantly inhibited the lipopolysaccharide-induced (1000 ng/mL) elevation of p65 and ABCB1 (Figure 3I and 3J). Addi-tionally, EVs also reversed the lipopolysaccharide-induced p65 nuclear translocation of the NF-κB pathway, which was similar to the SN50 group (Figure IF in the Data Supplement). Thus, the impact of NPC-EVs on ABCB1 and NF-κB in ECs is not restricted to OGD conditions but can also be found in the lipopolysaccharide model.
NPC-EVs Mitigate the p65 Nuclear
Translocation and Downregulate the Expression
and Activity of a Downstream Target ABCB1
Analyzing NF-κB p65 protein abundance is not suffi-cient to properly study this signaling pathway. Hence, we next performed a translocation assay under OGD condi-tions. Western blotting and immunofluorescence stain-ing demonstrated that EC exposure to OGD resulted in a pronounced translocation of p65 from the cytoplasm towards the nucleus. Incubation of ECs with EVs inhib-ited the p65 nuclear translocation (Figure 4A and 4B). Since OGD-induced activation of the NF-κB pathway promoted p65 translocation, known to increase tran-scription of a number of genes under hypoxic/ischemic conditions,22 we next elucidated if ABCB1 is a down-stream target of the NF-κB pathway. As such, we applied SN50, an NF-κB translocation inhibitor, and Valspodar, an ABCB1 inhibitor, in the OGD system. Both SN50 and Valspodar significantly reduced ABCB1 protein abundance in OGD-exposed ECs, as is the case with EVs (Figure 4C). Neither SN50 nor Valspodar affected protein expression of NF-κB p65 in hypoxic ECs in comparison to ECs treated with EVs (Figure 4D). Since
SN50 inhibits the translocation but not the total protein abundance of NF-κB p65, the lack of effect of SN50 is in line. The latter was confirmed in a proof-of-concept experiment, showing that SN50 indeed inhibits the trans-location of NF-κB p65 in our OGD model (Figure IE in the Data Supplement). Consistently, ABCB1 transporter activity in each group was examined by R123, a known ABCB1 substrate. The cellular accumulation of R123 depends on ABCB1 activity, which can actively transport R123 towards the extracellular compartment. As shown in Figure 4E, EVs increased R123 accumulation in ECs by diminishing the ABCB1 transporter activity, which was similar to the SN50 and Valspodar groups. Hence, NPC-EVs regulate posthypoxic expression patterns of ABCB1 indirectly through the inhibition of the NF-κB pathway.
NPC-EVs Regulate Properties of the BBB in an
In Vitro OGD Co-Culture Model
To further assess the effect of EVs on the functional properties of the BBB, we employed an in vitro BBB co-culture model using primary ECs and astrocytes. The isolation, culture, and purification of ECs and astrocytes, as well as the construction of the co-culture system, is depicted in Figure 5A. As shown in Figure 5B, ECs and astrocytes were seeded on the upper and lower chamber, representing the luminal and the abluminal sides of the BBB, respectively. Immunocytochemistry staining was conducted using specific known markers to confirm the cell lineage, that is, ECs (ZO-1, CD31) and astrocytes (GFAP, S100B). Co-culturing of both ECs (CD31 posi-tive) and astrocytes (GFAP posiposi-tive) did not change their biological properties, that is, both cell types were able to take up EVs under these conditions (Figure 5C and 5D).
For the detection of the TER, the values were recorded every single hour using an automatic cellZscopeE appa-ratus. The optimal TER value was reached between 120 and 180 hours in the co-culture system, with values peak-ing to 14 to 17 Ω∙cm2 at 120 hours. Thereafter, the sys-tem was exposed to OGD for 24 hours and disconnected to the controller during this period. The recording was restarted after OGD and the value of each well reduced to around 50% of the plateau value at the onset of the reoxygenation period (Figure IIA and IIB in the Data Sup-plement). Values for each well and time point were saved and analyzed between groups. However, EV treatment did not significantly rescue TER values after induction of OGD in the BBB co-culture model (Figure 5E).
The permeability studies with different molecules of different sizes like LY (457.25 Da) and EBA (67 000 Da)
Figure 4 Continued. showed p65 nuclear translocation of the NF-κB pathway. Scale bars: 20 µm. C and D, Quantitative analysis of ABCB1 and p65 expression by Western blot analysis in normoxia control, OGD, OGD treated with EVs, OGD with SN50 (NF-κB translocation inhibitor) and OGD with valspodar (ABCB1 inhibitor) groups. Western blots were normalized with the housekeeping protein α-tubulin (n=3 per group). E, Statistical analysis of rhodamine 123 accumulation in ECs representing ABCB1 transporter activity were done in the same groups (n=6 per groups). DAPI indicates 4’,6-diamidino-2-phenylindole. Data are expressed as mean±SD, *P<0.05, **P<0.01, ***P<0.001, ****P<0.0001.
BA SIC SCI ENCES - V B
Figure 5. Extracellular vesicles (EVs) regulate blood-brain barrier (BBB) properties in vitro using a co-culture model. A, Experimental paradigm summarizing the in vitro BBB co-culture model. B, In vitro, the BBB co-culture model consisted of primary ECs on a transwell insert with a microporous membrane and astrocytes (ACs) on the other side. Phase-contrast images of endothelial cells (ECs) and astrocytes under brightfield microscopy are shown. Scale bars: 100 µm. Immunofluorescence staining of their specific markers ZO-1 (zonula occludens 1), CD31 (ECs), and GFAP (glial fibrillary acidic protein), and S100B (astrocytes) are depicted separately. Scale bars: 50 µm. C and D, EVs labeled with DiI (red) were taken up into the cytoplasm of ECs and astrocytes. CD31 and GFAP (green) represent markers of ECs and astrocytes separately. Scale bars: 10 µm. E, In the co-culture system, real-time transcellular electrical resistance (TER) values were (Continued )
BA SIC SCI ENCES - V B
were performed on inserts after 24 hours of reoxygenation. The permeability data were plotted as the total number of volume transported over time in each well. The permeability coefficient Pcells analysis for both LY and EBA suggested that EV treatment significantly reduced the BBB perme-ability in the co-culture system (Figure 5F and 5G).
Next, ABCB1 transporter activity of ECs was detected by using the aforementioned R123 accumulation assay. As shown in Figure 5H, EV treatment significantly reduced the ABCB1 transporter activity on ECs after induction of OGD. Collectively, EVs not only mitigate the OGD-induced upregulation of ABCB1, but also repress its function and activity.
NPC-EV Administration Mitigates the
MCAO-Induced Upregulation of ABCB1 and the
Activation of the NF-κB Pathway In Vivo
To analyze the role of EVs on regulation of ABCB1 and the NF-κB pathway in ischemic stroke, we studied ABCB1 and p65 expression in mice submitted to 60 minutes of MCAO. Based on the aforementioned in vitro data, sys-temic injection of NPC-EVs via cannulation of the femo-ral vein is likely to yield an uptake of DiI-labeled EVs by ECs, followed by crossing the basal membrane, enter-ing the end-feet of astrocytes, and reachenter-ing the cere-bral parenchyma outside of microvessels (Figure 6A). Immunohistochemistry staining of cerebral microvessels and astrocytes located within the infarct core revealed CD31-positive and GFAP-positive cells to be co-local-ized with DiI-labeled EVs (Figure 6B). Western blots using enriched fractions of brain microvessels of isch-emic hemispheres revealed that both ABCB1 and p65 protein levels were increased at 24 hours poststroke (Figure 6C and 6D). These stroke-induced upregulations were inhibited by EV administration. No significant differ-ences were observed in the contralateral hemispheres. Sham group mice underwent the surgery procedure without MCA occlusion. And mice were treated with PBS vehicle in MCAO control groups intravenously at the beginning of reperfusion and 6 hours later after MCAO.
NPC-EV Administration Attenuates
MCAO-Induced MMP-9 Elevation and Evans
Blue-Albumin Leakage
Additional experiments were conducted to evaluate the effect of EVs on BBB stability in vivo. As mentioned before, the induction of cerebral ischemia activates a
great deal of signaling cascades, among which is the activation of MMP-9 followed by the degradation of the basal lamina.52 Using Western blotting, zymography and immunofluorescence staining, the results indicated that EV administration significantly reduced both the protein expression and the activity of MMP-9 compared with the MCAO group. However, there was no significant differ-ence of MMP-2 activities when compared with the sham or the MCAO group (Figure 6E through 6G).
The Evans blue extravasation assay was employed to assess the integrity of the poststroke BBB after EV administration. Evans Blue-Albumin leakage in the brain tissue of the ischemic hemisphere of both stroke mice and nonischemic sham mice was analyzed 24 hours after MCAO. Spectrophotometric analysis revealed a significant increase of Evans Blue concentration in the brain parenchyma of the MCAO group compared with the sham group (Figure 6H). Noteworthy, the Evans Blue concentration in the EV group was significantly lower than in the MCAO group, suggesting an enhanced level of BBB stability due to EV administration. Taken together, EV treatment significantly suppresses MMP-9 activation resulting in reduced BBB leakage in the rodent stroke model.
NPC-EV Administration Represses Early
Inflammatory Cell Recruitment in the
Postischemic Brain
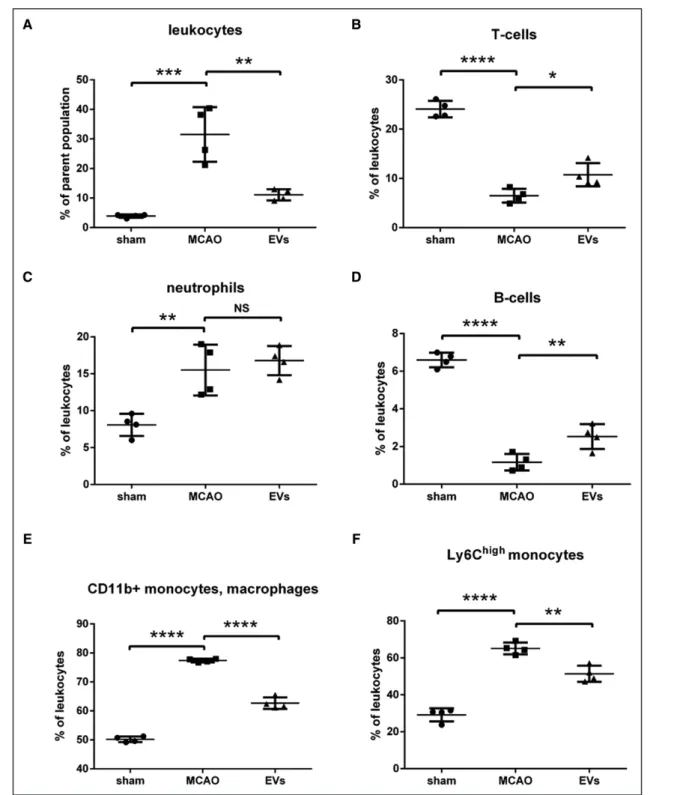
As mentioned previously, the cellular immune response is a key element in the pathophysiology of ischemic stroke which is closely linked to the opening of the BBB. Since EVs induce BBB protection in the early postischemic brain as shown before, we wondered whether or not EVs had an impact on very early inflammatory cell recruitment in the postischemic brain. Therefore, the brain tissue of the ischemic hemisphere was analyzed by flow cytom-etry 24 hours after MCAO. The subsets of leukocytes (CD45high), T cells (CD45highCD3+), neutrophils (CD45 high-Ly6G+), B cells (CD45highCD3−Ly6G−CD19+), mac-rophages, monocytes (CD45highCD3−Ly6G−CD11b+), and Ly6Chigh monocytes (CD45highCD3−Ly6G−CD11b+ Ly6Chigh) were analyzed. The analysis showed a signifi-cantly higher ratio of leukocytes and Ly6Chigh monocytes as well as a relatively lower ratio of T cells and B cells in the MCAO group in comparison to the sham group. On the contrary, EV treatment significantly reversed the aug-ment of leukocytes and the suppression of T cells and B cells in the MCAO groups. EV administration showed
Figure 5 Continued. recorded by the cellZscopeE apparatus as given in Figure SIIA and SIIB in the Data Supplement. The real-time percentage of maximum TER values after the plateau period were calculated in oxygen glucose deprivation (OGD) and OGD-treated with EVs groups. F and G, In the co-culture system, statistical analysis of Evans blue-albumin (EBA; large molecule) and Lucifer Yellow (LY; small molecule) permeability coefficients in OGD and OGD-treated with EVs groups were performed. H, Statistical analysis of rhodamine 123 accumulation in ECs representing ABCB1 transporter activity was examined in OGD and OGD-treated with EVs groups (n=5 per group). Data are expressed as mean±SD; *P<0.05 and **P<0.01.
BA SIC SCI ENCES - V B
Figure 6. Extracellular vesicle (EV) administration mitigates middle cerebral artery occlusion (MCAO)-induced upregulation of ABCB1 (ATP-binding cassette subfamily B member 1 transporter) and MMP-9 (matrix metalloproteinase 9) as well as activation of NF-κB (nuclear factor-κB) in ischemic microvessels.
Mice were exposed to 60 min of middle cerebral artery (MCA) occlusion followed by 24 h of survival. Sham group mice underwent the surgery procedure without MCA occlusion. Mice were treated with PBS (control and sham) or intravenously treated at the beginning of reperfusion and 6 h later with another EV administration. A, In the schematic diagram, EVs reach endothelial cells (ECs), cross (Continued )
BA SIC SCI ENCES - V B
no effect on the subset of neutrophils (Figure 7). Taken together, these results indicate that EV treatment signifi-cantly decreased the infiltration of leukocytes and espe-cially the Ly6Chigh monocyte invasion into the brain tissue at 24 hours poststroke. On the contrary, the ratio of T cells and B cells in leukocytes were significantly elevated at this early stage due to EV treatment.
DISCUSSION
Using both an in vitro and an in vivo stroke model, the present study analyzed the therapeutic value of NPC-EVs with regard to the stability of the BBB. Focusing on the ABCB1 transporter, our data demonstrate that ABCB1 is upregulated upon induction of hypoxia in the BBB co-culture model and in stroke mice as well. The application of EVs reverses these effects. ABCB1 protein expression is, however, not directly affected by NPC-EVs. Rather, EVs modify the aforementioned pro-tein expression by inhibiting the proinflammatory NF-κB pathway, all of which resulting in reduced activation of MMP-9 and enhanced BBB integrity.
ECs forming the BBB consist of luminal (blood side) and abluminal (brain side) membrane domains. Intercel-lular tight junction proteins greatly limit both paracelIntercel-lular and transcellular movement of molecules through the EC layer.53,54 Regulated bidirectional transport of drugs and metabolites is, however, guaranteed by specific transport-ers such as ABCB1 (P-gp, Mdr-1 [multidrug resistance protein-1]). As a matter of fact, up to 50% of pharmaceu-tical compounds currently tested are likely to be ABCB1 substrates,55 and ABCB1 has been repeatedly reported to be regulated under stroke conditions.7,11,56–58 ABCB1 knockdown models or pharmacological inhibition of the transporter itself result in reduced brain injury under in vivo stroke conditions.7,13 In line with this, other disease models such as neuroinflammation find increased levels of ABCB1 to be associated with exacerbated brain injury,8,59,60 empha-sizing the role of ABCB1 under pathological brain condi-tions. The present data of our study, however, do not only further stress the role of ABCB1 but also show a potential means to pharmacologically modulate ABCB1 expression patterns in patients with stroke as well.
Previous research from our group showed that trans-planted NPCs induce acute postischemic neuroprotection by stabilizing the BBB.61 Since adult stem cells like NPCs
and others mediate their biological effect by secreting EVs, the latter have been reported to enhance neurore-generation, neurological recovery, and to modulate neu-roinflammation after stroke.27,29–31 Herein, EVs enhance the BBB stability as suggested by reduced Evans blue leakage and by reduced MMP activity in a rodent stroke model. As such, EV infusion decreases the expression of ABCB1 in the ischemic brain, which is in accordance with our in vitro results.
When stimulated by ischemic stroke, activated astro-cytes are an important source of MMP secretion which contributes to the degradation of the basal membrane, thus facilitating BBB breakdown.52,62–64 Whereas within the first hours after stroke onset both MMP-2 and MMP-9 are responsible for BBB opening, severe disrup-tion of the BBB between 24 hours to 48 hours is primarily associated with an activation of MMP-9 only.65–67 In accor-dance with these findings, our study shows an extensive upregulation of MMP-9 within the ischemic hemisphere after 24 hours, whereas MMP-2 remained at its basal level at that time point. Of note, EVs do not significantly modify TER measurements in our in vitro BBB model, nor do they affect ZO-1 protein abundance. Indeed, the TER value depends on tight junction proteins between adjacent ECs. Beside tight junctions, however, the BBB permeabil-ity also––and even more so––relies on the endothelial basal membrane.68,69 Hence, our in vitro data suggest that EVs regulate the permeability of the posthypoxic BBB by preventing the degradation of the basal membrane, rather than enhancing tight junction protein patterns.
Interestingly, MMP-9 is known to be modulated by the NF-κB pathway under stroke conditions21,70 and previ-ous research of ours demonstrate that transplanted NPCs induce postischemic neuroprotection by inhibit-ing this pathway.19 Likewise, additional research from oncology and nonstroke related neurosciences found an interesting connection between ABCB1 and the NF-κB pathway,17,60,70–73 albeit this relationship has not been described for ECs. The NF-κB pathway, therefore, appears to be an interesting target of EVs under stroke conditions. Whereas OGD exposure yields NF-κB p65 nuclear translocation, EV treatment results in retention of p65 within the cytoplasm. Thus, NPC-EVs indeed suppress the activation of the NF-κB pathway in ECs exposed to OGD, thus repressing the transcription of downstream ABCB1 genes in ECs.
Figure 6 Continued. the blood-brain barrier (BBB), enter end-feet of astrocytes, and arrive in the brain parenchyma outside of microvessels. B, EVs labeled with DiI (red) reached ECs of the brain tissue as shown by immunofluorescence staining against CD31 (green). Furthermore, EVs-DiI (red spots) were also detected in the brain parenchyma outside of the microvessels with some positive signaling in astrocytes (GFAP [glial fibrillary acidic protein], green). Scale bars: 20 µm. C and E, Quantitative analysis of ABCB1, p65, and MMP-9 expression in sham, MCAO, and MCAO treated with EVs by Western blot analysis of the hemisphere microvessels. Western blot was normalized with the housekeeping protein α-tubulin or β-actin (n=5 per group). F, Analysis of MMP-9 and MMP-2 activity using gelatin zymography of the ischemic hemisphere or sham hemisphere. G, Quantitative analysis of MMP-9 (red) expression by immunofluorescence staining and measurement of fluorescence intensity of the ischemic striatum in the 3 groups. GFAP (green) represents a specific maker of astrocytes. Scale bars: 50 µm. H, Analysis of the blood-brain barrier integrity using the Evans blue extravasation assay in ischemic hemispheres of the three groups (n=5 per group). Data are expressed as mean±SD, *P<0.05, **P<0.01, ***P<0.001, ****P<0.0001, #P<0.05 and ##P<0.001.
BA SIC SCI ENCES - V B
Brain-invading leukocytes significantly contribute to early phase secondary ischemic injury after break-down of the BBB, triggering a sustained inflammatory response.49,74–76 Consistent with the observed stabiliza-tion of the BBB by EV infusion, we report a decreased early infiltration of total numbers of leukocytes, for which
significant changes of higher ratios of T cells and B cells as well as a lower ratio of Ly6Chigh monocytes are found. In this context, emerging evidence suggests that a large number of infiltrated monocytes, especially Ly6Chigh monocytes, produce proinflammatory cytokines contrib-uting to the early functional impairment after stroke.77–79 Figure 7. Extracellular vesicles (EVs) decrease postischemic infiltration of leukocyte invasion into the ischemic hemisphere. Flow cytometry of ischemic hemispheres showed a significant decrease of infiltrated total number of leukocytes (A), a relative increase of T cells (B), a relative increase of B cells (D), and a relative decrease of monocytes (E and F) in the EV treatment group compared with the middle cerebral artery occlusion (MCAO) control group. EVs did not affect the subset of neutrophils (C). Data are expressed as mean±SD (n=4 per group). *P<0.05, **P<0.01, ***P<0.001, and ****P<0.0001.
BA SIC SCI ENCES - V B
Likewise, a plethora of studies claim a role of regula-tory T cells for secreting cytokines like IL-10 and TGF-β, yielding anti-inflammatory actions under conditions of cerebral ischemia.80–82 Hence, our data suggest a role of EVs in mediating the infiltration of Ly6Chigh monocytes and T cells into the ischemic brain. Since previous work suggests ABCB1 in ECs to be involved in the secre-tion of proinflammatory and chemotactic factors into the extracellular space, inhibiting ABCB1 transporter activ-ity due to EV treatment is an elegant tool to attenuate immune cell recruitment into the brain.
The present study, for the first time, defines a novel way of action for EVs under conditions of cerebral ischemia, demonstrating enhanced BBB integrity due to EV appli-cation. We propose that ischemic stroke activates MMP-9 secretion by astrocytes and increases ABCB1 expression in ECs, which are attributed to the activation of the NF-κB signaling pathway. The latter eventually leads to the dis-ruption of the basal membrane and to increased BBB permeability. The application of EVs, however, reverses the aforementioned process by inhibiting the NF-κB path-way, resulting in reduced ABCB1 and MMP-9 activation. These findings provide novel evidence on the therapeutic potential of EVs under conditions of early ischemic BBB injury, which deserve further scientific investigation.
ARTICLE INFORMATION
Received July 12, 2020; accepted December 7, 2020.
Affiliations
Department of Neurology (L.Z., I.G., Y.K., X.Z., M.H., M.S.W., M.B., T.R.D.) and De-partment of Neuropathology (M.S.W., J.O.), University Medical Center Göttingen, Germany. Sheffield Institute for Translational Neuroscience, University of Shef-field, United Kingdom (A.M.). Istanbul Medipol University, Regenerative and Re-storative Medical Research Center, Turkey (E.K., T.R.D.). Department of Neurol-ogy, University Hospital Essen, University of Duisburg-Essen, Germany (D.M.H.). Department of Neuroradiology, University Hospital Basel, Switzerland (M.-N.P.).
Acknowledgments
We thank Regine Kruse for excellent technical assistance. This article does not contain any studies with human participants performed by any of the authors. All animal experiments were performed with governmental approval according to the National Institutes of Health guidelines for the care and use of laboratory animals. Both the STAIR (Stroke Therapy Academic Industry Roundtable) criteria and the ARRIVE (Animal Research: Reporting of In Vivo Experiments) guidelines have been followed.
Sources of Funding
L. Zhang thanks the China Scholarship Council for the financial support (No. 201706230260).
Disclosures
None.
REFERENCES
1. Dirnagl U, Iadecola C, Moskowitz MA. Pathobiology of ischaemic stroke: an integrated view. Trends Neurosci. 1999;22:391–397. doi: 10.1016/s0166-2236(99)01401-0
2. Abbott NJ, Rönnbäck L, Hansson E. Astrocyte-endothelial interac-tions at the blood-brain barrier. Nat Rev Neurosci. 2006;7:41–53. doi: 10.1038/nrn1824
3. Miller DS. Regulation of ABC transporters blood-brain barrier: the good, the bad, and the ugly. Adv Cancer Res. 2015;125:43–70. doi: 10.1016/bs.acr.2014.10.002
4. Felix RA, Barrand MA. P-glycoprotein expression in rat brain endothelial cells: evidence for regulation by transient oxidative stress. J Neurochem. 2002;80:64–72. doi: 10.1046/j.0022-3042.2001.00660.x
5. Zhou SF. Structure, function and regulation of P-glycoprotein and its clinical relevance in drug disposition. Xenobiotica. 2008;38:802–832. doi: 10.1080/00498250701867889
6. Sanchez-Covarrubias L, Slosky LM, Thompson BJ, Davis TP, Ronaldson PT. Transporters at CNS barrier sites: obstacles or opportunities for drug delivery? Curr Pharm Des. 2014;20:1422–1449. doi: 10.2174/ 13816128113199990463
7. Spudich A, Kilic E, Xing H, Kilic U, Rentsch KM, Wunderli-Allenspach H, Bassetti CL, Hermann DM. Inhibition of multidrug resistance transporter-1 facilitates neuroprotective therapies after focal cerebral ischemia. Nat Neu-rosci. 2006;9:487–488. doi: 10.1038/nn1676
8. Kooij G, Mizee MR, van Horssen J, Reijerkerk A, Witte ME, Drexhage JA, van der Pol SM, van Het Hof B, Scheffer G, Scheper R, et al. Adenosine triphosphate-binding cassette transporters mediate chemokine (C-C motif) ligand 2 secretion from reactive astrocytes: relevance to multiple sclerosis pathogenesis. Brain. 2011;134(pt 2):555–570. doi: 10.1093/brain/awq330 9. Patak P, Hermann DM. ATP-binding cassette transporters at the blood-brain barrier in ischaemic stroke. Curr Pharm Des. 2011;17:2787–2792. doi: 10.2174/138161211797440195
10. DeMars KM, Yang C, Hawkins KE, McCrea AO, Siwarski DM, Candelario- Jalil E. Spatiotemporal changes in P-glycoprotein levels in brain and peripheral tissues following ischemic stroke in rats. J Exp Neurosci. 2017;11:1179069517701741. doi: 10.1177/1179069517701741 11. ElAli A, Hermann DM. Liver X receptor activation enhances blood-brain
bar-rier integrity in the ischemic brain and increases the abundance of ATP-bind-ing cassette transporters ABCB1 and ABCC1 on brain capillary cells. Brain Pathol. 2012;22:175–187. doi: 10.1111/j.1750-3639.2011.00517.x 12. Hermann DM. Future Perspectives for brain pharmacotherapies:
implica-tions of drug transport processes at the blood-brain barrier. Ther Adv Neurol Disord. 2008;1:167–179. doi: 10.1177/1756285608097775
13. Murozono M, Matsumoto S, Okada S, Nagaoka D, Isshiki A, Watanabe Y. Reduction of brain infarction induced by a transient brain ischemia in mdr1a knockout mice. Neurochem Res. 2009;34:1555–1561. doi: 10.1007/ s11064-009-9943-6
14. Lakhan SE, Kirchgessner A, Tepper D, Leonard A. Matrix metalloproteinases and blood-brain barrier disruption in acute ischemic stroke. Front Neurol. 2013;4:32. doi: 10.3389/fneur.2013.00032
15. Andersson P, Yang Y, Hosaka K, Zhang Y, Fischer C, Braun H, Liu S, Yu G, Liu S, Beyaert R, et al. Molecular mechanisms of IL-33-mediated stro-mal interactions in cancer metastasis. JCI Insight. 2018;3:e122375. doi: 10.1172/jci.insight.122375
16. Chiu CT, Chen JH, Chou FP, Lin HH. Hibiscus sabdariffa leaf extract inhibits human prostate cancer cell invasion via down-regulation of Akt/NF-kB/ MMP-9 pathway. Nutrients. 2015;7:5065–5087. doi: 10.3390/nu7075065 17. Katayama K, Noguchi K, Sugimoto Y. Regulations of P-glycoprotein/ ABCB1/MDR1in human cancer cells. N J Sci. 2014;2014:1–10. doi: 10.1042/BCJ20190736
18. Nakanishi C, Toi M. Nuclear factor-kappaB inhibitors as sensitizers to anti-cancer drugs. Nat Rev Cancer. 2005;5:297–309. doi: 10.1038/nrc1588 19. Doeppner TR, Kaltwasser B, Fengyan J, Hermann DM, Bähr M. TAT-Hsp70
induces neuroprotection against stroke via anti-inflammatory actions pro-viding appropriate cellular microenvironment for transplantation of neu-ral precursor cells. J Cereb Blood Flow Metab. 2013;33:1778–1788. doi: 10.1038/jcbfm.2013.126
20. Harari OA, Liao JK. NF-κB and innate immunity in ischemic stroke. Ann N Y Acad Sci. 2010;1207:32–40. doi: 10.1111/j.1749-6632.2010.05735.x 21. Lv Y, Liu W, Ruan Z, Xu Z, Fu L. Myosin IIA regulated tight junction in oxygen
glucose-deprived brain endothelial cells via activation of TLR4/PI3K/Akt/ JNK1/2/14-3-3ε/NF-κB/MMP9 signal transduction pathway. Cell Mol Neurobiol. 2019;39:301–319. doi: 10.1007/s10571-019-00654-y 22. Ridder DA, Schwaninger M. NF-kappaB signaling in cerebral ischemia.
Neu-roscience. 2009;158:995–1006. doi: 10.1016/j.neuNeu-roscience.2008.07.007 23. Mathivanan S, Fahner CJ, Reid GE, Simpson RJ. ExoCarta 2012: database
of exosomal proteins, RNA and lipids. Nucleic Acids Res. 2012;40(Database issue):D1241–D1244. doi: 10.1093/nar/gkr828
24. Théry C, Witwer KW, Aikawa E, Alcaraz MJ, Anderson JD, Andriantsitohaina R, Antoniou A, Arab T, Archer F, Atkin-Smith GK, et al. Minimal informa-tion for studies of extracellular vesicles 2018 (MISEV2018): a posiinforma-tion