THE EFFECTS OF PRIVATE SCHOOLS ON PUBLIC SCHOOL ACHIEVEMENT A Master’s Thesis by SIRMA KOLLU The Department of Economics Bilkent University Ankara January 2006
THE EFFECTS OF PRIVATE SCHOOLS ON PUBLIC SCHOOL ACHIEVEMENT
The Institute of Economics and Social Sciences of
Bilkent University
by
SIRMA KOLLU
In Partial Fulfillment of the Requirements for the Degree of MASTER OF ARTS
in
THE DEPARTMENT OF ECONOMICS BİLKENT UNIVERSITY
ANKARA
I certify that I have read this thesis and have found that it is fully adequate, in scope and in quality, as a thesis for the degree of Master of Arts in Economics.
--- Asst. Prof. Çağla Ökten Supervisor
I certify that I have read this thesis and have found that it is fully adequate, in scope and in quality, as a thesis for the degree of Master of Arts in Economics.
--- Asst. Prof. Ümit Özlale Examining Comittee Member
I certify that I have read this thesis and have found that it is fully adequate, in scope and in quality, as a thesis for the degree of Master of Arts in Economics.
---
Asst. Prof. Zahide Karakitapoğlu Aygün Examining Comittee Member
Approval of the Institute of Economics and Social Sciences
--- Prof. Erdal Erel
ABSTRACT
THE EFFECTS OF PRIVATE SCHOOLS ON PUBLIC SCHOOL ACHIEVEMENT
Kollu, Sırma
M.A., Department of Economics Supervisor: Asst. Prof. Çağla Ökten
January 2006
This thesis analyzes the effects of private schooling on public school quality. The share of private schools in Turkish education system has been continuously increasing especially after the extension of compulsory primary education to uninterrupted eight years in 1997. While new regulations are being considered by the government regarding encouraging private schooling, the share of private schools will increase and the importance of the relationship between private and public education will also increase.
In this study, the effects of private schools on public high school achievement, which is measured by Student Selection Examination (ÖSS), in 2003 in Turkey are estimated. Both the percentage of students attending private schools and alternative of it, the percentage of private schools, are treated as endogenous variables in the model. Private school achievement in previous year is used to identify a two-stage model. The empirical results showed that private schools have negative effect on public school achievement.
ÖZET
ÖZEL OKULLARIN DEVLET OKULU BAŞARISI ÜZERİNDEKİ ETKİSİ
Kollu, Sırma
Yüksek Lisans, Ekonomi Bölümü Tez Yöneticisi: Yrd. Doç. Çağla Ökten
Ocak 2006
Bu çalışma, özel okulların, devlet okullarının niteliği üzerindeki etkilerini incelemiştir. Özellikle zorunlu eğitimin 1997 yılında kesintisiz sekiz yıla çıkarılmasından sonra, Türk eğitim sisteminde, özel okulların payı devamlı olarak artmaktadır. Hükümetin özel okulların teşvik edilmesini amaçlayan yeni düzenlemeler üzerinde çalışması, özel okul payının ileride daha fazla artmasına yol açacak ve özel ile devlet okulları arasındaki ilişki daha da önem kazanacaktır.
Bu çalışmada, 2003 yılı için Türkiye’de özel okulların, Öğrenci Seçme Sınavı ile ölçülen devlet liseleri başarısı üzerideki etkisi incelenmiştir. Gerek özel okula giden öğrenci yüzdesi gerekse bunun alternatifi olarak kullanılan özel okul yüzdesi içsel değişkenler olarak kullanılmıştır. Bir önceki yıl özel okul başarısı iki aşamalı modeli belirlemek için kullanılmıştır. Deneysel bulgular özel okulların devlet okulu başarısı üzerinde olumsuz etkileri olduğunu göstermiştir.
ACKNOWLEDGEMENTS
I would like to express my gratitude to Asst. Prof. Çağla Ökten, my supervisor, for her guidance and contribution during preparation of my thesis.
I am grateful to my family for their support and tolerance.
TABLE OF CONTENTS
ABSTRACT ... iii
ÖZET ... iv
ACKNOWLEDGMENTS ... v
TABLE OF CONTENTS ... vi
LIST OF TABLES ... vii
LIST OF FIGURES ... viii
CHAPTER 1: INTRODUCTION ... 1
CHAPTER 2: EDUCATION SYSTEM IN TURKEY ... 4
2.1 Pre-Primary Education ... 6
2.2 Primary Education ... 7
2.3 Secondary Education ... 8
2.3.1 Public High Schools ... 9
2.3.2 Private High Schools ... 13
2.4 Higher Education ... 19
2.5 Student Selection Examination ... 20
CHAPTER 3: CONCEPTUAL FRAMEWORK ... 29
CHAPTER 4: DATA ... 34
CHAPTER 5: METHODOLOGY ... 40
CHAPTER 6: EMPIRICAL RESULTS ... 44
CHAPTER 7: CONCLUSION ... 55
BIBLIOGRAPHY ... 58
APPENDIX A ... 64
LIST OF TABLES
Table 1: List of Private High Schools Excluding Turkish Private
Schools in 2005 ... 16 Table 2: Student and Teacher Statistics of Private High Schools
in 2005 ... 17 Table 3: The Number of Applicants in the Student Selection and
Placement Examination and Those Placed in Programs
of Higher Education Between 1980 and 1998 ... 21 Table 4: Percentage of Those Placed in Undergraduate Programs
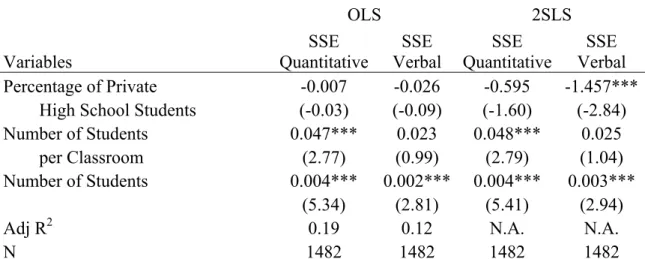
by School Types ... 25 Table 5: Summary Statistics ... 38 Table 6: OLS and 2SLS Estimates of Students Achievement Using
Percentage of Private High School Students ... 46 Table 7: The Results of OLS and 2SLS Estimates of Student Achievement
Using Percentage of Private High School Students, Excluding
FLW’s, for Selected Variables ... 49 Table 8: The Results of OLS and 2SLS Estimates of Student Achievement
Using Percentage of Private High School Students, Excluding
Schools Having FLW Sections, for Selected Variables ... 50 Table 9: OLS and 2SLS Estimates of Students Achievement Using Percentage
of Private High Schools ... 53 Table A1: First Stage Regression Results
Table A2: OLS Estimates of Student Achievement Including the Instrumental
LIST OF FIGURES
Figure 1: The Difference Between SSE Scores of Private and Public
Schools in 2002 ... 26 Figure 2: Percentage Share of Private Schools by Years ... 27 Figure 3: The Percentage of Students Attending Private High Schools
CHAPTER 1
INTRODUCTION
In this study we analyze the determinants of public school quality in Turkey. We primarily focus on how the prevalence of private schools affects the public school achievement. The relationship between private and public sector in education system is very important since private sector in Turkey has grown over the years. We specifically analyze the effect of private schooling in secondary education level on public high school achievement, as the percentage of private high schools grows faster than the whole education sector. Besides, in order to encourage private schooling, the Ministry of National Education considers possible revisions regarding the regulations about private schools (Milliyet)1. Therefore, investigating the effect of private education on public schools will be even a more important issue, as the share of private schools increases.
An increase in the size of the private sector would not only lessen the burden on the public schools by decreasing the amount of the students but also lead public schools to compete as private schools offer better standards and achieve high success. On the other hand, as private sector grows, high quality teachers and successful students, who can afford tuition fees, would be attracted by private
schools and this would result in a decrease in public school achievement level. The findings of the literature also show this ambiguity by presenting conflicting results regarding the sign and the significance of the coefficient measuring the private school sector. Our goal is to find out which of these effects are more relevant in Turkey.
We use the Student Selection Examination (SSE) scores to measure the educational outcome and estimate our regressions with both quantitative and verbal test scores of public high schools. In order to avoid selection bias we exclude the public high schools admitting students by central examinations. The determinant of public school achievement, receiving priority consideration, is the size of the private school sector and measured by two alternative ways, percentage of private students attending private high schools and percentage of private high schools. Other determinants can be classified as school and city variables, where school variables measure the characteristics of the public school such as student per classroom and city variables reflect the characteristics of the city, in which the relevant public high school is located, such as Gross Domestic Product (GDP) per capita. In order to avoid possible endogeneity between public school achievement and size of the private sector, that is the level of public school achievement might affect the private school attendance, private sector is treated as an endogenous determinant of educational outcomes and public school achievement is estimated using both ordinary least squares (OLS) and two-stage least squares (2SLS). After controlling for the endogeneity problem, our estimation results show that private schooling has a negative impact on public school achievement in high school level in Turkey.
The organization of the paper is as follows. The next section gives information about the education system and the role of private schooling in Turkey. Section 3 discusses the conceptual framework. Section 4 and 5 describe the data and the model, respectively. Empirical results are presented in section 6. Finally section 7 concludes the thesis.
CHAPTER 2
EDUCATION SYSTEM IN TURKEY
The Ministry of National Education of Turkish education system was founded in 1857 during the Ottoman period under Council of Ministers. This was the first education organization at the level of Ministry. After the opening of Turkish Parliament on 23 April 1920, the “Ministry of Instruction” was organized as one of the eleven ministries of the government under Act No. 3, which was passed on May 2, 1920. In 1920, the Ministry of Instruction consisted of five units: The Program Committee, Department of Primary Education, Department of Secondary Education, Office of Turkish Antiquities, and Registry and Statistics Office. Since 1920, the national education policy has been carried on under various structures: It was “The Ministry of Instruction” between 1923 and 1935; “The Ministry of Culture” between 1935 and 1941; “The Ministry of Instruction” between 1941 and 1946; “The Ministry of National Education” after 1946; “The Ministry of Instruction” between 1950and 1960; “The Ministry of National Education” after 1960; “The Ministry of National Education, Youth and Sports” after 1983; and it is “The Ministry of National Education” since 1989. Today the Ministry of National Education (Ministry) consists of four divisions: Central, provincial, overseas and affiliated organizations. Due to the Law no. 3797 on the Organization and Duties of the Ministry of National Education, the Ministry of National Education has provincial
organizations in 81 cities and 924 towns, 70 of them being the central towns of metropolitan cities. The Ministry of National Education has representation offices in 21 countries with 20 education undersecretaries and 18 education attaches (National Education Statistics (NES), 2005).
Today, Turkish education system has four major education levels in formal education: Pre-primary education, primary education, secondary education and higher education.
― Pre-primary education ― Primary education
y Public primary schools y Private primary schools
• Turkish private primary schools • Minority primary schools • Foreign primary schools • International primary schools ― Secondary education
y General secondary education • Public high schools
· High schools
· Foreign language weighted high schools (FLW High schools) · Anatolian high schools
· Science high schools • Private high schools
٠ Private high schools
٠ Private Anatolian high schools ٠ Private science high schools · Minority high schools
· Foreign high schools · International high schools
y Vocational and technical secondary education ― Higher Education
y Universities y Institutes y Higher schools
y Vocational higher schools y Conservatories
y Research and application centers
2.1 Pre-Primary Education
Pre-primary education involves the education of children in the age group of three to five. There are two types of pre-primary education institutions: Kindergartens are the independent pre-primary education institutions whereas, nursery-classes are established as parts of other education institutions. Besides the kindergartens and nursery-classes financed by government, there are also institutions financed privately. Private institutions are either Turkish, minority, foreign or
international institutions (Pre-Primary Education Institutions Regulations)2. Although pre-primary education is not a part of the compulsory education in Turkey, by the next level of education becoming compulsory in 1970’s had a positive impact on pre-primary education. In 1970’s, pre-pre-primary education indicators had an extreme jump and the number of students in pre-primary education institutions grew 15 times3 and the average number of students per teacher improved from 26.5 to 17.9 during this period (NES, 2005). Today, there are 434,771 students in 16,016 pre-primary education institutions, 48 percent of them are female. Only 4 percent of the students in pre-primary education attend private institutions (NES, 2005). The average number of students per teacher in public institutions is 23 whereas the number is 12.5 for private institutions (NES, 2005). Pre-primary education institutions are established to prepare children for the next level of education, which is called primary education.
2.2 Primary Education
Primary education is the only level of education that is compulsory. Primary education became compulsory in 1970’s and it has included five years of education until 1997. Today it consists of eight years of uninterrupted education and aims education of children in the age group of six to fourteen by the relevant stipulations in Law no. 4306, which was passed on 18 august 19974. Primary education is given to female and male students together in public primary schools and financed by
2 This regulation was published in 25486 numbered and 08.06.2004 dated official gazette and also attainable at http://ooegm.meb.gov.tr
3http://meb.gov.tr/stats/eskiistatistikler.html 4http://iogm.meb.gov.tr
government. Although every Turkish citizen has a right to get primary education in public primary schools, there are also private primary schools, in which education of children are financed by the parents. In 1997, the average number of students per teacher was around 30 and today it is 26.5 in aggregate, where 9.6 for private primary schools and 26.6 for public primary schools (NES, 2005). Schooling ratio in primary education was 86.4 percent in 1970 and by the help of the legislation about compulsory education; it regularly increased and reached to 99.8 percent in 19975.
There are three types of private primary schools besides the Turkish private primary schools: International, minorities and foreign primary schools. 1.67 percent of students in primary education are attending private primary schools (NES, 2005).
2.3 Secondary Education
Secondary education includes all education institutions of a general or vocational and technical character of at least three6 years after primary education. Making primary education compulsory also had an effect on secondary schooling ratios. It was around 20 percent in 1970 and reached to nearly 60 percent in 1997. The schooling ratio of secondary education had a big improvement during 1980’s and doubled itself. Nevertheless, the indicators of general secondary education did not go well enough; although schooling ratio of general secondary education, which is the ratio of students attending general secondary education to the secondary
5http://apk.meb.gov.tr
6 In accordance with the acts on EU integration, by the 184 numbered 07.06.2005 dated sentence of the Board of Higher Discipline, education period for all secondary education institutes was increased to four years.
school-age population, had doubled itself until 1997, it hardly managed 30 percent in 19977.
Today there are 3,039,449 students in 6861 schools in secondary education and 1,937,055 of these students, are having general secondary education in 2,991 schools. In 2005, 21 percent of students are having secondary education and 63 percent of these students are in general secondary education. The average number of students per teacher is 18.1 in secondary education, while it is 20.7 for general secondary education. 4 percentage of general secondary education belongs to private sector having 7.9 students per teacher while public sector achieved 19 students per teacher. In public general secondary education, high schools and FLW high schools have a common share of 83 percent, Anatolian high schools have 12 and science high schools have 1 percentage share (NES, 2005).
2.3.1 Public High Schools
Every Turkish citizen, who was awarded by primary education diploma, has right to continue his or her secondary education in high schools. In some high schools foreign language weighted education is given depending on the physical resources, these institutes are called foreign language weighted high schools. The students, who are more successful relative to their peers, are assigned by school administrations to attend FLW high schools. On the other hand students, who want to attend Anatolian or science high schools, must take and succeed in the central
examination, Secondary Education Institutes Examination (SIE), which is done by the Student Selection and Placement Center (SSPC)8.
Anatolian high schools were first established in 1955 under the name of Instruction Colleges (Maarif Koleji). In 1955 there were Instruction Colleges only in six cities, which were İstanbul, İzmir, Eskişehir, Diyarbakır, Konya and Samsun, each having one. In 1975 the name of these schools was converted to Anatolian High Schools. Today there are 442 schools in all of the 81 cities of Turkey with 14,442 teachers and 191,931 students, where 47 percent of them are female. Anatolian high schools include at least three years of education in addition to the prep school for foreign language9. The objectives are to prepare students to higher education considering the interests and aptitudes they have and to provide education of foreign language so that students to use their knowledge in following the scientific and technological developments around the world. Although every 8th grade student can apply to Anatolian high schools, a student must succeed in SIE. Before December 2004, in addition to the success in SIE, the weighted averages of a student’s 4th, 5th, 6th and 7th grade GPA’s had also effect on placement. Student per classroom is set not to exceed 30 for all grades including prep; by considering not only the physical capacity and equipment of each school but also the number of teachers in all branches especially in foreign languages. Foreign language is the instruction language in mathematics and science courses. If there is inadequate number of teachers, who are capable of instructing in foreign language, all courses are held in Turkish (Anatolian High Schools Regulations)10.
8http://ogm.meb.gov.tr, School Information, High Schools.
9http://ogm.meb.gov.tr, School Information, Anatolian High Schools.
10This regulation was published in 23867 numbered and 05.11.1999 dated official gazette and also attainable at http://ogm.meb.gov.tr
First science high school was established in 1964 in Ankara by the help of Ford Foundation. There can be at most one science high school in a city and 70 cities in Turkey have them. Science high schools are coeducational11 boarding schools. Although students may not use this option due to parents’ preferences, institutions are obliged to provide coeducation12. Total enrollments are set as not to exceed 96 in a year and student per classroom is set at 24 for each and every science high schools inTurkey. Like the Anatolian high schools, science high schools also include at least three years of education in addition to the prep school for foreign language. The objectives of science high schools are; to prepare the students, who have high intelligence level and are talented in math and science areas, to higher education and to provide opportunities for students to participate in scientific and technological works. Although they are not as assertive as Anatolian high schools, to provide knowledge of foreign language at a sufficient level to follow the scientific and technological developments around the world is another goal for science high schools.
Every student, who has a weighted average of 4.00 out of 5.00 in Turkish, math and science courses at the end of 6th and 7th grades, can apply for science high schools. In addition, since September 2003, applicants must also achieve to make at least 3.00 out of 5.00 in each of these three courses at the end of 6th and 7th grades. In order the applicants to enroll in science high schools; they must first succeed in SIE like all other applicants for Anatolian high schools. However science high school applicants not only must answer some additional questions, which are designed to
11 Coeducation is the education of students of both sexes at the same institution. 12http://ogm.gov.tr, School Information, Science High Schools.
measure the level of intelligence, but also are subject to another treatment in which answers to math and science are more weighted while calculating their scores. Administrative units are highly selective about the teachers they hire just like in the case of student decisions. Teachers must have at least four-year undergraduate diplomas, at least five-year experience in teaching, high reputation in records, no serious disciplinary penalties. Moreover, having a graduate diploma, grade of C in foreign language qualifier exam for public personnel, being honored by a mention or by bonus and having a certificate of in service training are all plus in hiring decisions. Besides the elite students and teachers, training programs make also these schools privileged. For 10th and 11th grades, the weight of science courses is designed not to be less than 60 percent of total hours of education. Applied laboratory courses are weighted compared to other types of high schools. In addition attending seminars and participating in projects are not only encouraged but also participating in at least an individual or group project regarding math or science courses is a must. On the other hand, foreign language education does not have a priority as it has in Anatolian high schools. Only the technical terms that are used in math and science courses are taught to students (Science High Schools Regulations)13. Consequently, every year, approximately 700,000 students take SIE. Not more than a percentage of these students have achance to enroll in science high schools (Milliyet)14. Today, there are 14,940 students and 1,160 teachers in 70 science high schools in Turkey, 33 % of the students are female (NES, 2005).
13 This regulation was published in 23579 numbered and 10.01.1999 dated official gazette and also attainable at http://ogm.meb.gov.tr
2.3.2 Private High Schools
Private schools have a considerable history in Turkish education system. The first private school was established during the Ottoman period as a minority school. The motive of giving permission to minority schools in 1,453 was to provide minorities, who live in the empire territory, opportunities to have education and training of their own religion in their native language. Consequently, the first minority school began to education in 1,454 under the name of Fener Greek School. Different ethnic groups like the Armenians, Greeks and Jewish people benefited from these schools, each was supported by resident members of their societies, religious order and by country of origins. After minority schools, foreign countries, especially the overseas countries like Brazil and U.S.A demanded their citizens to have their own schools in Ottoman Empire in order to have education and training in their native languages during their very long stays in the empire. As a result, in 1583, the first foreign school was founded in Istanbul under the name of St. Benoit by French missionaries. Subsequently, many foreign countries like America, France, England, Italy, Austria, Germany, Russia Bulgaria and Iran financed their own foreign schools in Ottoman Empire. Having more and more foreign schools became a competition between these countries (Ertuğrul, 1998). In 1900, the number of students in foreign schools sponsored by only the American missionaries was around 20.000 in more than 400 American schools (Ortaylı, 1982), while there were around 7.000 students in only 69 Ottoman schools. Moreover, in those years, the number of foreign schools was around 2.000, when we add the minority schools the number was 10.000 (Sezer, 1999).
Until the end of 18th century, only the foreigners and minorities had been attending to foreign schools. However, later Muslim residents also attended to these schools of foreigners. The reasons of foreign schools being so attractive were firstly that the education quality of Ottoman schools was far behind the modern education standards. Ottoman schools were very inadequate in number and quality to satisfy all the citizens. The inadequacy of Ottoman schools were admitted even by the central government, so that the Ottoman Empire sent an ambassador to Paris to investigate the modern system of education and how they could improve the current system in 1721. Moreover, the foreign schools provided an opportunity to have at least one foreign language. In addition, foreigners had grown in Muslims’ esteem because of the failures of the Ottoman Empire in the areas of military and finance. Thus the success of foreigners in every area became a common belief. Finally, the idea of being a member of some elite society made many parents, who could afford the expenses, to send their children to foreign schools. All of these beliefs behind the appreciation of foreign schools were well founded. The graduates of foreign schools did create a well educated, productive elite society having at least one foreign language and members of this elite group had many senior positions both in public and private sector (Ertuğrul, 1998; Odabaşı, 2003).
On the other hand, these schools of both minorities and foreigners were claimed to harm the national values and to impose the values of their own. By the establishment of Republic of Turkey, many of these minority and foreign schools were closed and some of them were allowed to work under the supervision of Ministry of National Education due to the Lausanne Pact. The main concern of the very young Republic, which was founded in 1923, was to have the unionized secular
education system, having high minimum standards. To achieve this goal first all institutions giving religious education of any religion were closed (Vahapoğlu, 1990; Tozlu, 1991). Then Turkish was made the common language of education. Last, all minority and foreign schools were passed into the control of Ministry of National Education. To have a control over these schools was tried also during the Ottoman period but it did not turn into reality. For example according to the census, which was done by the order of Sultan Abdulhamid II, during the late 1800’s, only 51 protestant schools had license out of 392 protestant schools. However, the Republic of Turkey did apply strict policies and did shut down the institutions, which did not act in accordance to the regulations. Many of these schools were shut down, some were adapted into Anatolian high schools like Lycée de Galatasaray and few remain (Ertuğrul, 1998).
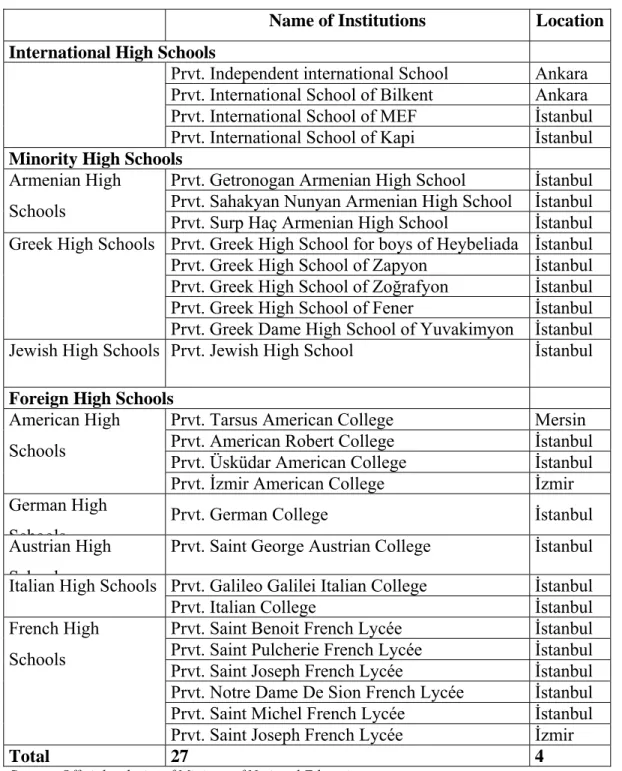
The action of westernization started during the Ottoman period and created a keen interest towards foreign schools. By the end of Ottoman period, minority schools were allowed only for foreign citizens or members of minority groups. However, westernization period did not end as the Ottoman period did. The demand for western education institutions, which provide more attentive education in addition to foreign language education, created its own supply and initiated the Turkish private schools. The Turkish Parliament gave utterance to this demand and encouraged people to play a role in financing these private schools in 1925. Consequently, the first Turkish private school was founded in 1928 in Ankara, under the name of TED Ankara College15. Today, there are 14 foreign, 9 minority, 4 international and 600 Turkish private high schools in Turkey (NES, 2005). The list of
non-Turkish high schools is given inTable 1 and as shown in Table 1, these schools are mostly located in İstanbul, İzmir and Ankara, where most of the foreigners live in.
Table 1. List of Private High Schools Excluding Turkish Private Schools in 2005 Name of Institutions Location
International High Schools
Prvt. Independent international School Ankara Prvt. International School of Bilkent Ankara Prvt. International School of MEF İstanbul
Prvt. International School of Kapi İstanbul Minority High Schools
Prvt. Getronogan Armenian High School İstanbul Prvt. Sahakyan Nunyan Armenian High School İstanbul Armenian High
Schools
Prvt. Surp Haç Armenian High School İstanbul Prvt. Greek High School for boys of Heybeliada İstanbul Prvt. Greek High School of Zapyon İstanbul Prvt. Greek High School of Zoğrafyon İstanbul Prvt. Greek High School of Fener İstanbul Greek High Schools
Prvt. Greek Dame High School of Yuvakimyon İstanbul Jewish High Schools Prvt. Jewish High School İstanbul Foreign High Schools
Prvt. Tarsus American College Mersin Prvt. American Robert College İstanbul Prvt. Üsküdar American College İstanbul American High
Schools
Prvt. İzmir American College İzmir German High
Schools
Prvt. German College İstanbul
Austrian High S h l
Prvt. Saint George Austrian College İstanbul Prvt. Galileo Galilei Italian College İstanbul Italian High Schools
Prvt. Italian College İstanbul
Prvt. Saint Benoit French Lycée İstanbul Prvt. Saint Pulcherie French Lycée İstanbul Prvt. Saint Joseph French Lycée İstanbul Prvt. Notre Dame De Sion French Lycée İstanbul Prvt. Saint Michel French Lycée İstanbul French High
Schools
Prvt. Saint Joseph French Lycée İzmir
Total 27 4
Source: Official web site of Ministry of National Education; http://ookgm.meb.gov.tr/OkulListe.aspx
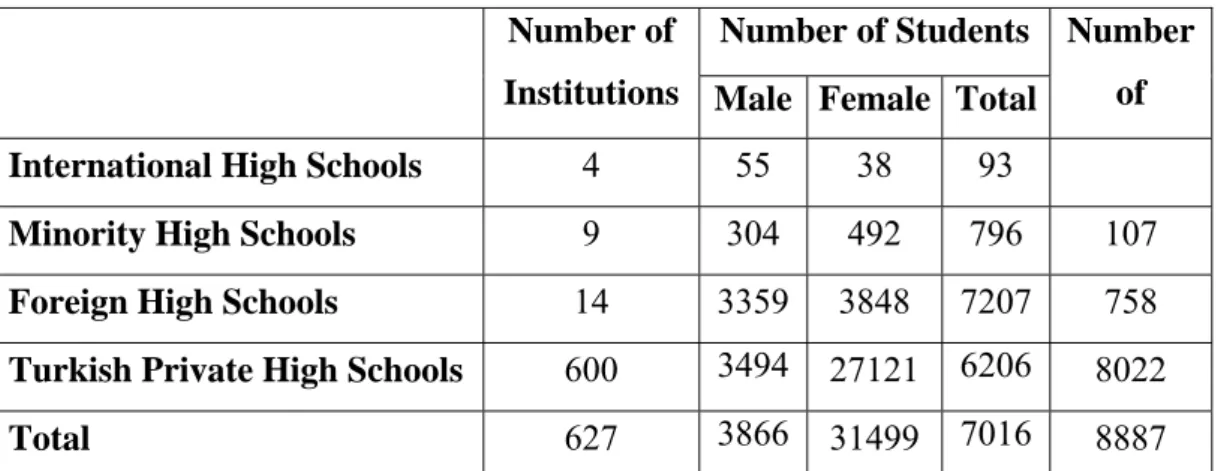
Table 2 shows the student and teacher numbers in private high schools. Foreign high school institutions are the biggest in capacity among non-Turkish high schools. Number of students per institution is 23 for International high schools and 88 for Minority high schools, where it is 514 for foreign high schools, thus the percentage of students in foreign high schools is 89 percent of all students in non-Turkish high schools. Foreign schools are popular because they are no longer only for foreigners but also appeal to Turkish citizens and claim to give the best instruction in foreign languages (Ertuğrul, 1998). Thus it will be more appropriate if the foreign schools are considered within Turkish private schools now on. The regulations regarding private schools were discouraging foreign schooling until 1985 and foreign countries had also stopped financing these schools by 1923, thus minority and foreign schools did not grow in number while the number of Turkish private schools continuously grows. As a result, today 95 % of students attending private schools are in Turkish private schools (NES, 2005).
Table 2. Student and Teacher Statistics of Private High Schools in 2005 Number of Students
Number of
Institutions Male Female Total
Number of
International High Schools 4 55 38 93
Minority High Schools 9 304 492 796 107
Foreign High Schools 14 3359 3848 7207 758
Turkish Private High Schools 600 3494 27121 6206 8022
Total 627 3866 31499 7016 8887
Source: National Education Statistics, 2004-2005 and official web site of Ministry of National Education; http://ookgm.meb.gov.tr/OkulListe.aspx
It is important to note that Foreign and Minority schools have been very successful in achieving their goals. They achieved their claims of creating an elite
society, many of their graduates became diplomats, politicians, ambassadors, ministers, prime ministers, artists, musicians, poets, painters, writers and so on (Ertuğrul,1998). Now, Turkish private schools have the claim with foreign schools, but it is for sure that they all provide better standards of education compared to many of public schools.
The reason behind encouraging private sector was to reduce the burden of the public sector in financing public education; however the aims and required standards of private schools are regulated by law, and private education institutions are run under control and supervision of Ministry in accordance with related law and regulations. Every private school follows the syllabus, which is prepared by the school authority and also approved by the ministry. The length of a course is set to 45 minutes and any education material, which is not recommended by the ministry, is not allowed to be used in courses. Every private school has to provide a library available to students. Private schools must be coeducational institutions and the number of students per classroom must have an upper bound of 40 students. The number of foreign students cannot exceed 20% of number of Turkish students and every private school must grant scholarship to students between 2 and 10 % of its student capacity. The private schools giving education in foreign language generally admit students based on the results of central examination for private secondary schools (CEPSS) (Private Schools Regulations)16. In 2005, the exam took place in 15 cities and 32,040 students took it, this number was 21,050 in previous year so the increase in demand for private secondary education is around 50 %, which indicates
16 This regulation was published in 25883 numbered and 22.07.2005 dated official gazette and also attainable at http://ookgm.meb.gov.tr
a considerable increase in the demand for private institutions. By this central examination, around 5,000 successful students were placed in 98 schools (Milliyet)17.
All the regulations about the standards of and admissions to private science schools are same as public science high schools. Today, there are 70,163 students and 8,888 teachers in 627 private secondary education institutions (NES, 2005).
2.4 Higher Education
Secondary education is followed by higher education of at least two years. Higher education institutions are established not only by the state as public corporations having autonomy in teaching and research but also by private foundations as non-profit organizations. Today there are three types of higher education institutions: universities, military and police colleges and academies, and vocational schools affiliated with ministries. Universities are the main higher education institutions, which have units as faculties, graduate schools, schools of higher education, conservatories, two-year vocational training schools and centers for applied work and research. High level educational activities, scientific research and publications are carried out in universities (NES, 2005).
2.5 Student Selection Examination
Admissions to higher education are mostly done in accordance with the examinations organized by SSPC. Before the 1950’s, the number of applicants to higher education was not high enough to require a central examination. The grades from graduation examinations at the end of secondary education were used as the criterion for selection. Once the number of applicants exceeded the capacity, faculties had to address different methods in admissions. Each faculty started to organize their own student selection examinations in addition to the grades from graduation examinations. The time consuming nature and difficulties in evaluations of essay type examinations, having examinations of more than a faculty at a time had proved to be inadequate. Consequently, the higher education institutions began to search for more objective methods in application, evaluation, and placement. Finally The Interuniversity Board set up The Interuniversity Student Selection and Placement Center to select among the applicants considering the limited capacity of universities. Thus the centralized system for admission of students to the institutions of higher education started in the 1973-1974 academic year.
In both 1973-1974 and 1974-1975 academic years, student selection examinations were held in two sessions on the same day; one in the morning, the other in the afternoon. From 1976 to 1980, student selection exam was made up of a single session. In 1981, the center was attached to The Higher Education Council under the name of The Student Selection and Placement Center, in accordance with The Higher Education Law. Between 1981 and 1998, student selection examination was turned into two-stage system, in which the first stage was Student Selection
Examination (SSE) and the second stage was Student Placement Examination (SPE) two months after the SSE.
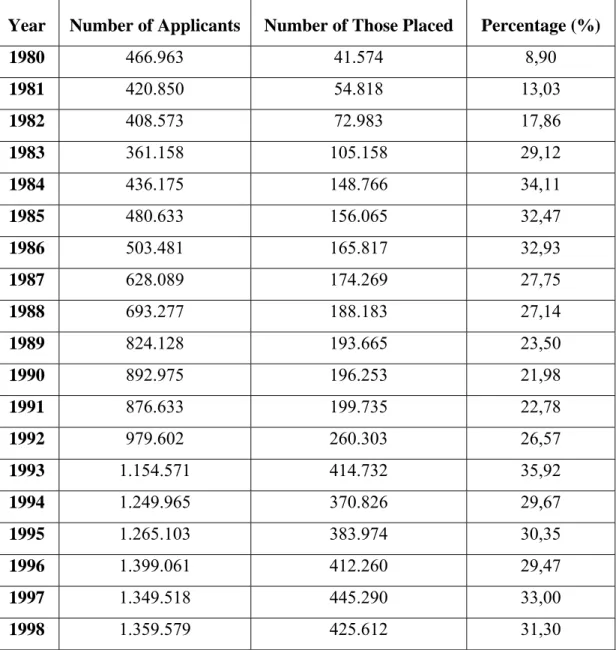
Table 3. The Number of Applicants in the Student Selection and Placement Examination and Those Placed in Programs of Higher Education Between 1980 and 1998.
Year Number of Applicants Number of Those Placed Percentage (%)
1980 466.963 41.574 8,90 1981 420.850 54.818 13,03 1982 408.573 72.983 17,86 1983 361.158 105.158 29,12 1984 436.175 148.766 34,11 1985 480.633 156.065 32,47 1986 503.481 165.817 32,93 1987 628.089 174.269 27,75 1988 693.277 188.183 27,14 1989 824.128 193.665 23,50 1990 892.975 196.253 21,98 1991 876.633 199.735 22,78 1992 979.602 260.303 26,57 1993 1.154.571 414.732 35,92 1994 1.249.965 370.826 29,67 1995 1.265.103 383.974 30,35 1996 1.399.061 412.260 29,47 1997 1.349.518 445.290 33,00 1998 1.359.579 425.612 31,30
Source: Official we site of the Student Selection and Placement Center;
http://www.osym.gov.tr/BelgeGoster.aspx?DIL=1&BELGEBAGLANTIANAH=169
Beginning with the 1999 administration, the second stage had dropped and the entrance examination system is based on a one-stage examination under the name of SSE. Any Turkish citizen, who has a high school diploma or who is in the final year
of such a school is qualified to apply for SSE. The objectives of SSE is firstly to select those candidates who will be considered in the placement decisions and then to select and place those candidates in the higher education programs of their highest preferences compatible with their relevant weighted composites as the criterion. SSE consists of two tests. One is designed to measure the verbal abilities and the other is designed to measure the quantitative abilities of the candidates. There are approximately 90 items in each of these tests and candidates are expected to take both tests. The components of the verbal test are proficiency in Turkish, history, geography and philosophy where the components of the quantitative test are mathematics, physics, chemistry and biology.
In the evaluation of the tests, the number of correct and incorrect answers in both the verbal and the quantitative tests and their sub tests are counted separately. The raw score for each section is obtained by subtracting one fourth of the number of incorrect answers from the number of correct answers. Then, as a preparation for the calculation of the composite scores to be used in the selection and placement decisions, each candidate’s verbal and quantitative raw scores are transformed to standard T scores (a score scale with an arithmetic mean of 50 and standard deviation of 10). This transformation is carried by using the arithmetic means and standard deviations of the respective score distributions for candidates who are in the last year of secondary education. Essentially, candidates are evaluated on the basis of not only their performance on the SSE but also their academic achievement in high school. Thus each candidate’s high school grade-point average is also transformed to a standard T score in order to achieve uniformity in the units of measurements to be weighted. The arithmetic mean and standard deviation are calculated from the
grade-point average distribution of the high school which the candidate has attended. The purpose of this calculation is first to minimize the discrepancies that may arise because of the differences in grading between schools and then to counterbalance the differences between schools in the resources for effective learning.
After the completion of score transformations, three different composite scores are calculated for each candidate to be used in placement of the candidate to four-year undergraduate program or two-four-year vocational higher school program, considering with the preferences of each candidate. These composite scores are verbal SSE score in which the answers in verbal sections are weighted relatively heavily for students in verbal programs in their high schools, quantitative SSE score in which the answers in quantitative sections are weighted for students in quantitative programs in their high schools and equally weighted SSE score in which the answers in mathematics and Turkish are weighted for students in equally weighted programs in their high schools. In year 2003, a minimum composite score of 120.000 points is stipulated for qualification to be considered for placement in the four-year undergraduate programs. The candidates having composite scores between 105.000 and 119.999 points are offered a restricted choice of higher education programs. Candidates whose composite scores are 105.000 or above receive the preference form for listing their preferences on programs18.
The graduates of vocational and technical high schools are encouraged to continue to their professions in relevant vocational higher school programs and receive a favorable weight for their high school grade-point averages when they are
being considered for placement in higher education programs in the field of their high school education. Because the vocational and technical high schools have completely different curriculum from general secondary education institutions, it would be inappropriate to aggregate the vocational and technical high schools with general high schools. To search for the effect of private vocational and technical schooling on the success of public vocational and technical schools might be an alternative study but the number of private vocational and technical high schools is not sufficient for such a study, besides the primary goal of vocational and technical high schools is not to prepare students to higher education, but to create man power for labor market19.
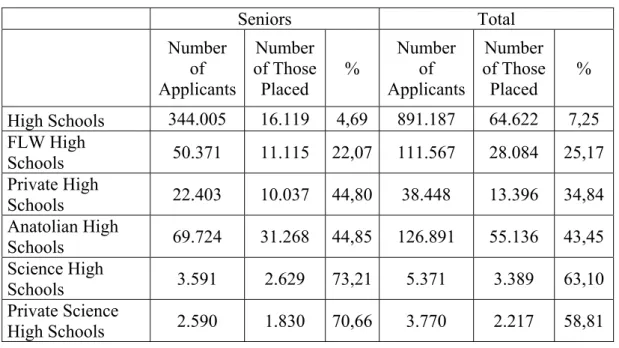
In 2004, the number of applicants in SSE was 1,786,883. 28 percent of these applicants were in senior classes in high schools, while 37 percent of applicants, who were placed in undergraduate programs, were seniors (NES, 2005). Not only among seniors but also in total, both public and private science schools are appeared to be the most successful schools in training the students who were placed in undergraduate programs as presented in Table 4.
Table 4. Percentage of Those Placed in Undergraduate Programs by School Types Seniors Total Number of Applicants Number of Those Placed % Number of Applicants Number of Those Placed % High Schools 344.005 16.119 4,69 891.187 64.622 7,25 FLW High Schools 50.371 11.115 22,07 111.567 28.084 25,17 Private High Schools 22.403 10.037 44,80 38.448 13.396 34,84 Anatolian High Schools 69.724 31.268 44,85 126.891 55.136 43,45 Science High Schools 3.591 2.629 73,21 5.371 3.389 63,10 Private Science High Schools 2.590 1.830 70,66 3.770 2.217 58,81
Source: National Education Statistics, 2004-2005.
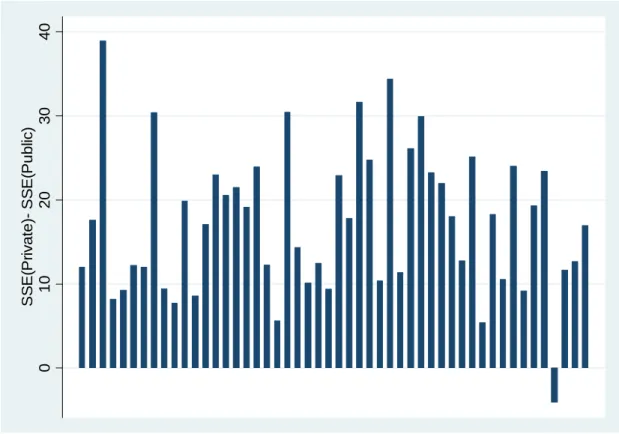
Nevertheless, science high schools and Anatolian high schools admit students after a series of elimination process; one can say that their success would be anticipated. On the other hand, success of Private high schools is the highest among those do not stipulate exams in admission when both the percentage of students who are placed in undergraduate programs and the difference between private and public school SSE scores are considered as in Figure 120. Each bar indicates the difference between average private school achievement and average public school achievement in SSE quantitative test scores for a city, in which private high schools are established.
0 10 20 30 40 SS E( Pr iv ate) - SS E( Publ ic )
Figure 1. The Difference Between SSE Scores of Private and Public Schools in 2002
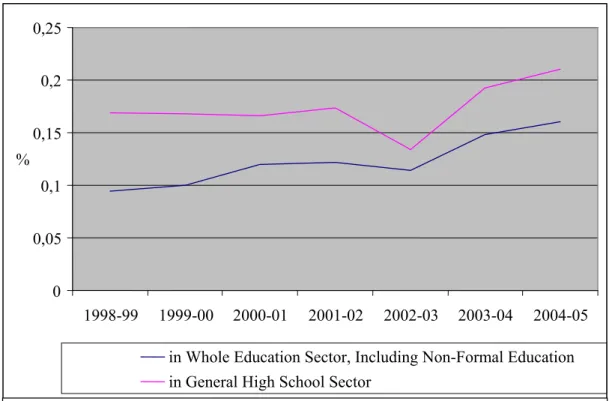
Private schools offer high standards of education which is stipulated by law, provide the best foreign language education, opportunities for their students to participate in various social activities, have different rules regarding discipline and higher expectations regarding homework and achieve to place their senior students to undergraduate programs with higher percentage than double of public high schools as shown in Table 4. Because of all, there has always been demand for private education as long as the parents can afford. Figure 2 presents the share of private schools in whole education sector in percentages.
0,25 0,2 0,15 % 0,1 0,05 0 1998-99 1999-00 2000-01 2001-02 2002-03 2003-04 2004-05
in Whole Education Sector, Including Non-Formal Education in General High School Sector
Source: Calculated from National Education Statistics, for relevant years.
Figure 2. Percentage Share of Private Schools by Years
Share of private schools seems to follow an increasing pattern according to Figure 2. Some of this increase in the share of private schools is because the compulsory education was extended from 5 to 8 years of uninterrupted education. Before the extension, students had chances to change schools at three different grades, at the beginning of 1st, 6th and 9th grades. Moreover, most of the private schools admit students relying on the results of CEPSS and in the past this examination had been done just before 6th grade. Thus private schools mostly admitted students at the beginning of 1st and 6th grades. Once the compulsory education was extended to eight years, schools can admit students either at the beginning of 1st grade or at the beginning of 9th grade. Since parents consider that 9th grade is too late to start foreign language instruction; they prefer sending their children to private schools earlier than before. As a result, first demand for then the share of private schools increase as shown in Figure 2. Moreover, the increase in the
percentage of private schools in general high school sector is greater than the whole education sector. As the share of private schools increases, investigating the effect of private education on public schools will be even a more important issue.
CHAPTER 3
CONCEPTUAL FRAMEWORK
Friedman (1962), Friedman and Friedman (1981) argued that private schooling has a positive effect on the quality of public education through competitive pressures. However empirical literature gives conflicting results on the effect of private schooling on public education. Although there are studies consistent with Friedman’s argument (Hoxby, 1994, 1996, 2001; Brokaw, Gale and Merz, 1995; Arum, 1996; Dee, 1998; Mizala and Romaguera, 2000), there are also studies that find no significant effect of private schooling on public education (Sander, 1999; Jepsen, 2000; McEwan, 2000; Geller, Sjoquist and Walker, 2001; Sander, 2001; Jepsen, 2002). Besides, McMillan (1999) and Rangazas (1997) found that private schools have negative impact on public schools.
Even though the measures do not capture skill differences very well, measured differences in quality of teachers indicate a positive relationship between teacher skills and student performance (Glewwe and Jacoby, 1994; Betts and Morell, 1999). Moreover this effect is said to be stable over time (Hanushek, 1992). Since teachers differ dramatically in their effectiveness (Hanushek, 1971, 1986), relatively high salaries to teachers in private schools would cause a competition among all teachers, which would end up with the hire of most talented and skilled teachers in private
schools. Eventually the quality of public school teachers may fall as private education sector grows (Ballou, 1996) and schools would fight against this pressure (Hoxby, 2002). By increasing the salaries, public schools can keep on hiring well-qualified teachers (Hoxby, 1996); however in unionized school districts they cannot achieve to hire well-qualified teachers even if they increase the salaries (Figlio, 2002).
On the other hand, larger private school sector would increase the quality of public education through competitive pressures. Although Hanushek, Rivkin and Taylor (1996) present evidence that school quality differences are not systematically related to school resources, high quality of private schools, which are financed by parents, might lead to higher educational outcomes in private schools (Lewis and Wanner, 1979; Coleman, Hoffer and Kilgore, 1982; Teachman, 1987; Card and Krueger, 1992; Arum, 1996; Mizala and Romaguera, 2000; McEwans, 2000; Alderman, Orazem and Paterno, 2001; Jepsen and Jepsen, 2001; Sander, 2001). Public schools would eventually respond to the changes in the sector and intend to increase quality in order to catch up with private schools. Besides the competition from private schools, even more competition in the public school sector increases the quality of public education (Borland and Howsen, 1992; Grosskopf et al. 1998). In addition, increasing private school sector would relieve the burden on public education by decreasing the mass amount of students in public school sector. Although this does not have a significant effect on per pupil expenditures in the public sector according to Hoxby (1998), Poterba (1998) points out an increase in public school spending per pupil.
Furthermore, higher standards of education would attract not only the teachers but also the students. One can expect that successful students would respond more to higher standards in private school than low ability students. Consequently higher ability students tend to enroll in private schools (Figlio and Stone, 2001). This would result in a way consistent with Epple and Romano (1999) that, students with the lowest ability and lowest family income end up concentrated in public schools. Besides this incentive of students towards private schools would directly reduce public school achievement by reducing the number of high achieving students in public schools, it would be reduced also because of negative peer group effect. Relatively high abilities of schoolmates increase the abilities of others. When students with higher abilities are gone, this will also reduce the performance of those that remain in public schools (Hanushek, Kain, Markman and Rivkin, 2001; Hoxby, 2002).
Moreover, there are several other variables, such as family background, income and size that affect educational performance of children. Hanushek (1992) finds that parents compensate lower ability children within family. One might argue that parents have impact not only on lower ability children but also on each and every child they have as relevant studies of Lam and Schoeni (1993) and Hanushek (2001) states. On the other hand, Card and Krueger (1992) do not find any effect of parental education on student performance when school quality measures are held constant. Moreover, in the same study, Hanushek (1992) finds that neither the work behavior of the mother nor the single parenthood has any impact on educational performance of the children. However, Hanushek (2001), Altonji and Dunn (1996) identify the positive relationship between parental schooling and educational performance of
children later. In addition single parenthood tends to be negatively related to educational performance (Becker, 1991). Although family income seems to have no impact on educational outcomes (Card and Krueger, 1992), it may affect indirectly through affecting school resources or its influence might be hidden in the effect of family size on educational performance of children, which is found to be negative (Hanushek, 1992, 2001).
Several methods of measuring educational outcomes are used in the literature and discussed in the next section. We use average test scores of public schools as the dependent variable to measure the student achievement level. While explaining the possible effects of competitive pressures from private sector on student achievement, the main problem, which is faced by many researchers, is that the variable measuring the private schooling, thus competition, might be endogenous with public school achievement. In order to solve this problem, some of the studies use value-added approach (Bryk, Lee and Holland, 1993; Coleman, Hoffer and Kilgore, 1982), and Hanushek and Taylor (1990) show that value-added models reduce selection bias. Value-added models include also the past achievement level of the student or the school, which that student is attending, thus they can measure the improvement made by that particular student. Another method to deal with this endogeneity problem is to implement two-stage least squares approach. Thus at least one variable, which affects private school attendance and is uncorrelated with public school achievement, is needed. Most of the studies use being Catholic, the percentage Catholic in the county, percentage of church members, density of Catholic churches in the county, etc. as instrumental variables (Sander, 1995, 1999; Sander and Krautmann, 1999; Jepsen, 2000, 2002). However, religion cannot be used as instrumental variable in
Turkish case since religion can only be a determinant for vocational high schools in the field of religion.
Another country specific issue is the determination of the school types, which are used in this study. Most of the studies separate the data into two depending on whether the school is public school or financed privately. However in Turkey, both public and private science high schools and Anatolian high schools, which are financed publicly, admit students by central examinations. Since this would result in a selectivity issue, we drop both public and private science high schools and Anatolian high schools from our sample. The data includes public FLW high schools and public high schools. There is still a selection bias since FLW high schools admit the students considering their previously obtained grades. In order to manage this problem we include a dummy variable indicating whether the school is FLW or not. According to the new regulations, by June 2005, also public FLW high schools will admit students by central examination and their names will be changed to Anatolian high schools. This transformation of public FLW high schools to Anatolian high schools will increase the amount of Anatolian high schools, thus may decrease the quality of education and students in the long run. If this will be the case in the future, Anatolian high schools can then be included in the sample but not in present conditions.
CHAPTER 4
DATA
Various types of indicators can be used as left-hand side variable, the educational outcomes. Many of the studies in the literature use test scores measuring the performance of students as Hanushek (1992), Arum (1996), Sander (1999), Mizala and Romaguera (2000), Figlio and Stone (2001), Hanushek, Kain, Markman and Rivkin (2001) and Jepsen (2002), while Glewwe and Jacoby (1994), McEwan (2000), Sander (2001) and Goldhaber and Brewer (1997) preferring specifically the scores of math tests. Hanushek (1992), Hanushek, Rivkin and Taylor (1996) and Hanushek, Kain and Rivkin (2004) choose the standardized the test scores, whereas Sander (1996) uses the number of correct answers. As alternatives for student achievement, educational and occupational attainment, especially wages, (Lewis and Wanner, 1979; Lam and Schoeni, 1993), enrollment rates (Glewwe and Jacoby, 1994; Alderman, Orazem and Paterno, 2001; Lloyd, Mete and Sathar, 2005), high school completion and higher education attendance (Hoxby, 1994; Evans and Schwab, 1995; Neal, 1997; McEwan, 2000), high school drop-out rates (Sander and Krautmann, 1995) and additional years of schooling (Card and Krueger, 1992) are used in the literature. Here in this study, we use the test scores as left-hand side variable in order to measure the educational outcomes; however we neither use the standardized test scores nor the number of correct answers. We use the number of
correct answers minus one fourth of incorrect answers, namely the raw scores. Because SSE is the most widely held examination among high schools in Turkey, neither the questions, evaluation, date nor time changes from person to person and from city to city and provides many observations among Turkey, we prefer to use SSE raw scores data, which includes 2203 numbers of observations, as left-hand side variable to measure the student achievement level at school level. The data set does not include schools having no senior grade students or number of applicants less than five. As the variables that might have effect on public school achievement level, we have the private school competition in that city, other city variables and the school variables.
In this study, our major analysis is to find out how private schooling affects public school achievement level. In this sense, there are several alternatives to measure the competition. Jepsen (2000) used the distance of the public school to the nearest private school; however in our case it would not be possible to find this data for Turkey. Moreover, we argue that the distance to the nearest private school does not affect the decisions of parents on whether sending their children to private schools or not, but affects to which private school they will send their children, once they decided to choose private schooling. Even if the decision of parents on sending their children to private schools is affected by the distance to the nearest private school, it would be more reasonable to have such effect for elementary schools but not for high schools (James, 1987). Therefore, it would be more convenient to use a variable, which measures the size of the private sector in education system within a city.
There are basically two different ways to measure the size of the private sector in the literature; one is to use the percentage of school-age population attending private schools and the other is to use the percentage of private schools for the relevant demographical area. Arum (1996), Sander (1999) and Jepsen (2000) use elementary and secondary school students for the former measure, while Hoxby (1994) uses high school students and Geller, Sjoquist and Walker (2001) and Jepsen (2002) use grade specific variables. Elementary and secondary schooling used in these studies refer to the eight-year uninterrupted compulsory education, namely the primary education in Turkey. One might argue that the private elementary and secondary school student population would reflect more or less the future private school population in high schools, since there are studies, which find positive relation between private schools and college attendance (McEwan, 2000). However, the denominator, which is the total primary school population while calculating the percentage of primary education school-age population attending in private schools, would not truly reflect the amount for high schools, since primary education is compulsory and high schools are not. Therefore we argue that the percentage of high school students attending private schools is a better measure in explaining the effect of private sector size on public high schools’ achievement levels as Hoxby (1994) did.
In addition to the percentage of students attending private schools, we also use the percentage of private schools in another model as a measure of competition as in Geller, Sjoquist and Walker (2001). The reason of having a model with an alternative measure of competition is that we believe that percentage of private schools may
even be a better measure since the more school options available, the greater the competitive pressure.
While estimating the effect of private sector on public school achievement level, the dependent variable is measured at the school level in Turkey in 2002-2003 academic year, which is obtained from the Student Selection and Placement Center (SSPC). The size of the private sector, both the percentage of school-age population attending private high schools and the percentage of private schools are measured at the city level in 2002-2003 academic year. The measures for competition are computed using the yearly publication of the Ministry of National Education, namely the National Education Statistics 2002-2003. Other control variables can be classified as school variables and city variables. School variables include the number of students per classroom, the number of students in the school and a dummy variable indicating whether the school is FLW or not. The number of students and classrooms are taken from the Ministry of National Education for 2002-2003 academic year for each public high school. Unfortunately, the data taken from the Ministry of National Education do not include a distinction between FLW and non-FLW sections of the school and presents the aggregate numbers of students and classrooms. Here we calculate the weighted numbers of students and classrooms according to the number of SSE applicants of schools21. Moreover, because of the mismatch of the data sets
21 We have the number of applicants from each public high school, including the FLW sections. The number of classrooms and the number of students data is also available for each public high school but without indicating how many of them belong to the FLW or non-FLW sections. In order not to lose number of observations, we calculate their weighted averages. To calculate the number of students in FLW section of a particular school, we multiply number of applicants from the non-FLW section of the school with total number of students, including those in non-non-FLW and non-FLW sections of that school, then divide it by sum of number of applicants from non-FLW and FLW sections of that school. The calculation is similar for FLW sections and the number of classrooms of non-FLW and FLW sections of schools.
from SSPC and the Ministry, 72 observations are lost thus the number of observations decreases to 2131.
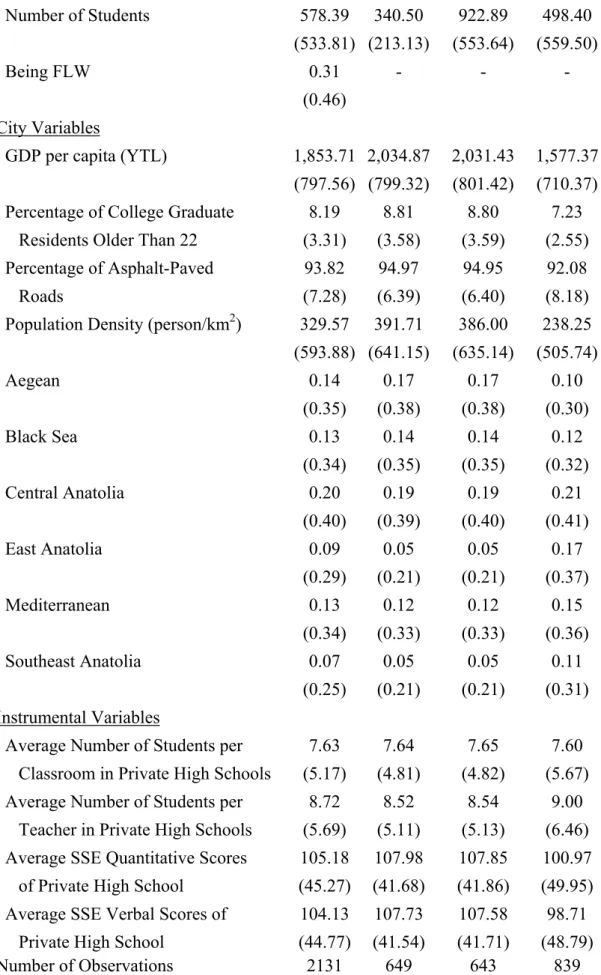
City variables include per capita income, the percentage of residents older than 22, who are college graduates, the percentage of roads that are asphalt-paved, population density and dummy variables indicating the geographical region in which the city is located, while Turkey is divided into seven geographical regions, which are Aegean, Black Sea, Central Anatolia, East Anatolia, Marmara, Mediterranean and South East Anatolia. All the city variables are taken from the results of 2000 Census, which are gathered by State Planning Organization. The summary of the statistics are presented in Table 5.
Table 5. Summary Statistics
Mean Variables All FLW Sections Non-FLW Sections of Schools with FLW Schools without FLW Dependent Variables SSE Quantitative 160.03 178.93 155.26 149.07 (16.60) (11.52) (7.09) (12.06) SSE Verbal 186.46 201.88 183.69 176.65 (16.74) (10.84) (9.43) (16.34)
Percentage of Private High 3.24 3.68 3.67 2.57 School Students (2.49) (2.60) (2.59) (2.17) Percentage of Private High 13.28 15.11 15.07 10.50
Schools (10.26) (10.52) (10.48) (9.23)
School Variables
Number of Students per 43.13 49.73 50.15 32.63
Table 5. (cont’d) Number of Students 578.39 340.50 922.89 498.40 (533.81) (213.13) (553.64) (559.50) Being FLW 0.31 - - - (0.46) City Variables
GDP per capita (YTL) 1,853.71 2,034.87 2,031.43 1,577.37
(797.56) (799.32) (801.42) (710.37)
Percentage of College Graduate 8.19 8.81 8.80 7.23 Residents Older Than 22 (3.31) (3.58) (3.59) (2.55) Percentage of Asphalt-Paved 93.82 94.97 94.95 92.08
Roads (7.28) (6.39) (6.40) (8.18)
Population Density (person/km2) 329.57 391.71 386.00 238.25
(593.88) (641.15) (635.14) (505.74) Aegean 0.14 0.17 0.17 0.10 (0.35) (0.38) (0.38) (0.30) Black Sea 0.13 0.14 0.14 0.12 (0.34) (0.35) (0.35) (0.32) Central Anatolia 0.20 0.19 0.19 0.21 (0.40) (0.39) (0.40) (0.41) East Anatolia 0.09 0.05 0.05 0.17 (0.29) (0.21) (0.21) (0.37) Mediterranean 0.13 0.12 0.12 0.15 (0.34) (0.33) (0.33) (0.36) Southeast Anatolia 0.07 0.05 0.05 0.11 (0.25) (0.21) (0.21) (0.31) Instrumental Variables
Average Number of Students per 7.63 7.64 7.65 7.60 Classroom in Private High Schools (5.17) (4.81) (4.82) (5.67) Average Number of Students per 8.72 8.52 8.54 9.00
Teacher in Private High Schools (5.69) (5.11) (5.13) (6.46) Average SSE Quantitative Scores 105.18 107.98 107.85 100.97
of Private High School (45.27) (41.68) (41.86) (49.95) Average SSE Verbal Scores of 104.13 107.73 107.58 98.71
Private High School (44.77) (41.54) (41.71) (48.79)
Number of Observations 2131 649 643 839
CHAPTER 5
METHODOLOGY
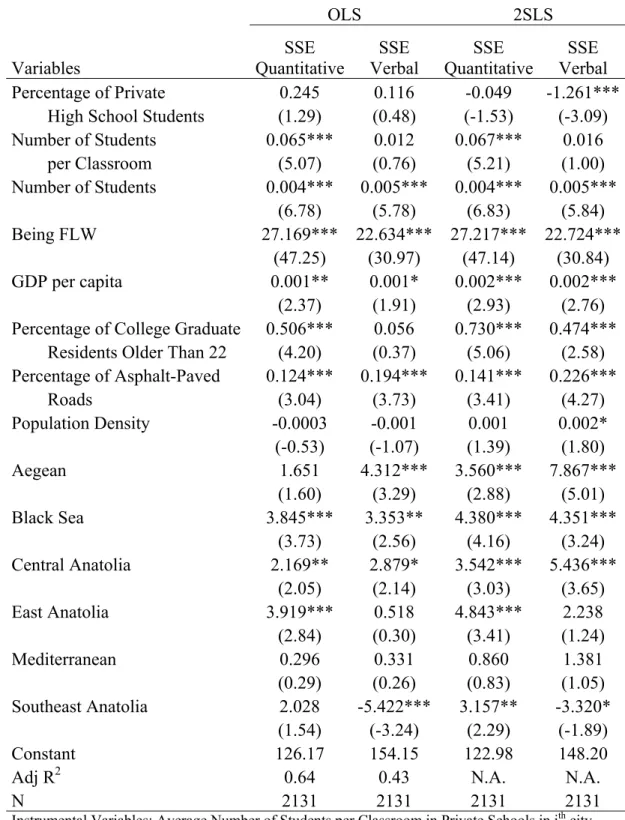
The basic empirical model, which is used in identifying the effect of private schooling on public school achievement, is estimated by ordinary-least squares (OLS) and presented as:
(1) Yij =α +β1Pj +β2Si +β3Cj +εij
where i and j stand for the relevant high school and city, respectively. The variable Yij represents the academic achievement in the ith public high school in the jth city. Although the math scores are usually considered more school-specific, we estimate our regressions with both quantitative and verbal test scores of public high schools. The variable represents the percentage of students attending private high schools in j
j
P
th city. In some specifications we use percentage of private schools in jth city. The vector includes the characteristics of the iSi th public school, which are number of student per classroom, number of students in the ith public school and a dummy for whether the ith public school is a FLW or not. The vector includes the characteristics of the j
j
C
th city namely per capita GDP, the percentage of residents older than 22 who are college graduates, the percentage of roads that are asphalt-paved,
population density and a dummy variable indicating the geographical region in which the jth city is located. There are also determinants of educational outcomes, which we cannot observe, such as the quality of teachers, number of teachers and parental background. Effects of such determinants would be included inεij, which is the unobserved error term.
Because there might be endogeneity between and , that is the level of
public school achievement might affect the private school attendance, is treated as an endogenous determinant of educational outcomes and is estimated using two-stage least squares. Thus the model becomes:
j P Yij j P ij Y (2) Yij =α +β1Pˆj +β2Si +β3Cj +εij
where is predicted using additional exogenous variables that are related to and unrelated to the error term. The number of students per classroom, the number of students per teacher in private high schools and the private high school achievement, which are all averages at the city level for 2003 except for the private school achievement. Since we expect the achievement of private high schools in previous year affects the decision process of parents in sending their children to private high schools in the next year, we use the private school achievement in year 2002. The variable of private achievement is calculated as the weighted averages of private high school average SSE scores in relevant city using the data obtained from SSPC, where the numbers of students per classroom and per teacher are calculated by dividing the total number of students attending private high school in the j
j
Pˆ
j
P
by the total number of classrooms and the total number of teachers hired in private high schools in the jth city. The summary of the statistics is presented in Table 5.
The number of students per classroom is expected to measure the effect of resources on educational outcomes and we expect a negative relationship between the number students per classroom and SSE scores of public high schools. However, the literature presents conflicting results regarding the effect of the average instructional expenditures per student, also measures the resource effect, or the number of students per classroom on educational outcomes. The number of students measures the size of the relevant public high school. The greater the school size, the more difficult to maintain the discipline and to manage the school. Therefore we expect the number of students in a school to have a negative effect on school achievement. Moreover, being FLW is expected to have positive effect since the most successful students among the applicants to the high schools are admitted to the FLW sections of high schools.
Moreover, city variables like per capita GDP, the percentage of college graduate residents older than 22 and the percentage of asphalt-paved roads are expected to have positive effect on student achievement level since per capita GDP measures the income effect and the percentage of asphalt-paved roads measures the effect of infrastructure and the level of public goods on educational outcomes. In addition, the percentage of college graduate residents older than 22 measures the education level of the relevant city, is a proxy for the education level of the possible parents in the city and we expect as education level in a city increases the student achievement increases as well, relying on the literature (Sander, 1999). Population