EFFECTS OF AGING, DIET AND POTENTIAL GENETIC
INTERVENTIONS ON THE LEVELS OF SMURF2 AND ITS INTERACTING PARTNERS IN ZEBRAFISH (DANIO RERIO) BRAIN
A DISSERTATION SUBMITTED TO
THE GRADUATE SCHOOL OF ENGINEERING AND SCIENCE
OF BILKENT UNIVERSITY
IN PARTIAL FULFILLMENT OF THE REQUIREMENTS FOR
THE DEGREE OF
DOCTOR OF PHILOSOPHY
IN
NEUROSCIENCE
By
Melek Umay Tüz Şaşik
ii
EFFECTS OF AGING, DIET AND POTENTIAL GENETIC
INTERVENTIONS ON THE LEVELS OF SMURF2 AND ITS INTERACTING PARTNERS IN ZEBRAFISH (DANIO RERIO) BRAIN
By Melek Umay Tüz Şaşik September, 2020
We certify that we have read this dissertation and that in our opinion it is fully adequate, in scope and in quality, as a thesis for the degree of Doctor of Philosophy.
Michelle Marie Adams (Advisor)
Urartu Özgür Şafak Şeker
Hatice Güneş Özhan
Özlen Konu Karakayalı
Çağdaş Devrim Son
Approved for the Graduate School of Engineering and Science
Ezhan Karaşan
iii ABSTRACT
EFFECTS OF AGING, DIET AND POTENTIAL GENETIC
INTERVENTIONS ON THE LEVELS OF SMURF2 AND ITS INTERACTING PARTNERS IN ZEBRAFISH (DANIO RERIO) BRAIN
Melek Umay Tüz Şaşik PhD in Neuroscience Advisor: Michelle Marie Adams
September, 2020
Aging is a natural process that is ultimate combination of numerous intrinsic and extrinsic changes in an organism. Contrary the common belief, brain aging is not a loss of neurons while it has been shown that subtle cellular and synaptic alterations have contribution to brain aging. Therefore, the molecular and cellular alterations may give more insight into the brain aging process. There are some hallmarks of aging that are common features in different organisms including genomic instability, telomere attrition, cellular senescence. There are some common factors with the ability to regulate more than one of the hallmarks of aging such as Smurf2. HECT-domain E3 ubiquitin ligase Smurf2 has several roles in the cellular processes for example, telomere attrition and cellular senescence. Moreover, its gene expression is higher in the aged brain. Although there are several publications about Smurf2, most of them focused on its role in cancer. We believed that Smurf2 levels should be
iv
examined in terms of brain aging. The first aim of the study was to examine the levels of Smurf2 and its interacting partners across lifespan. Although the Smurf2 protein level was not increased significantly in the whole zebrafish brain, its protein level was upregulated significantly in telencephalon and cerebellum. Also, subcellular protein fractionation demonstrated an enriched Smurf2 level in the cytosolic part. In the case of gene expression levels, smurf2 level was significantly higher in aged whole brain although its expression was downregulated during aging in telencephalon and cerebellum. In addition, the levels of mdm2, ep300a and sirt1 were lower in the aged telencephalon. According to multivariate analysis there is a potential balance between Smurf2-mediated ubiquitination, ep300a-mediated acetylation and Sirt1-mediated deacetylation but with advancing age, this balance may disrupt and other regulatory genes should also take a role to sustain cellular stability. The second aim was to investigate the roles of Smurf2 on brain aging with the help of genetic interventions including inducible knockin, stable knockout or transient knockdown. Since stable knockin and knockout models should be genotyped before further investigations, the genotyping and phenotyping methods were employed to find an efficient and reliable way. Also, transient knockdown via Vivo-morpholino was applied to adult brain and efficient post injection times of two different morpholinos were identified in order to examine the effects of Smurf2 knockdown in both young and old zebrafish. Lastly, it was aimed to examine the effects of non-genetic interventions including dietary regimens and pharmacological compounds on the gene expression of smurf2 and its interacting partners and the levels of the neuronal proteins and proliferation/senescence proteins. The opposing short-term dietary regimens, overfeeding and caloric restriction, were altered the levels of neuronal
v
proteins, HuC and DCAMKL1, and their relation with proliferation and senescence proteins during aging. Also, the gene expression levels of smurf2 and interacting partners except tp53 was not influenced by dietary regimens and aging in terms of whole brain. Also, multivariate analysis indicated that the correlations among smurf2,
mdm2, ep300a and sirt1 were conserved in both young and old ages independent to
dietary regimen which may imply that the balance between ubiquitination, acetylation and deacetylation is maintained in order to provide cellular stability during aging. Heclin, an inhibitor of HECT E3 ligases, were employed to inhibit Smurf2 activity. Before using in adult zebrafish, heclin was applied to embryos to see its effects. The higher dose of heclin decreased the survival ratio and altered the gene expression levels of downstream gene drastically. So, moderate dose of heclin should be applied to the adult brain and neuronal markers should be examined to observe target effects rather than off-target, unspecific impacts. Taken together, Smurf2 has potential roles during aging and it could be a promising target to delay the brain aging process and probably the onset of age-related cognitive decline.
Keywords: zebrafish, aging, brain, smurf2, caloric restriction, overfeeding, genetic interventions, heclin, neuronal proteins
vi ÖZET
ZEBRABALIĞI (DANIO RERIO) BEYNİNDE YAŞLANMA, DİYET VE OLASI GENETİK MÜDAHALELERİN SMURF2 VE ETKİLEŞİM
ORTAKLARININ İFADESİNE ETKİLERİ Melek Umay Tüz Şaşik
Nörobilim Lisansüstü Programı, Doktora
Tez Danışmanı: Michelle Marie Adams
Eylül, 2020
Yaşlanma, bir organizmadaki çok sayıda içsel ve dışsal değişikliğin nihai birleşimi olan doğal bir süreçtir. Yaygın inancın aksine, beyin yaşlanmasının nöron kaybı olmadığı, küçük hücresel ve sinaptik değişikliklerin beyin yaşlanmasına katkıda bulunduğu gösterilmiştir. Bu nedenle moleküler ve hücresel değişiklikler beyin yaşlanma sürecine daha fazla ışık tutabilir. Genomik kararsızlık, telomer yıpranması, hücresel yaşlanma gibi yaşlanmanın bazı ayırt edici özellikleri vardır, bu özellikler farklı organizmalarda gözlenen ortak özelliklerdir. Smurf2 gibi yaşlanmanın ayırt edici özelliklerinden birden fazlasını düzenleme becerisine sahip olan bazı ortak faktörler vardır. HECT-domain E3 ubikuitin ligaz Smurf2, birçok hücresel işlemde, telomer yıpranması ve hücresel yaşlanma gibi, önemli rollere sahiptir. Ayrıca yaşlı beyinde gen ekspresyonu daha yüksektir. Smurf2 hakkında birçok yayın olmasına rağmen, çoğu kanserdeki rolüne odaklanmıştır. Bu sebeplerle Smurf2 seviyelerinin beyin yaşlanması açısından incelenmesi gerektiğine inanıyoruz.
vii
Çalışmanın ilk amacı, Smurf2'nin ve etkileşimde bulunduğu ortaklarının seviyelerini yaşam boyu incelemekti. Smurf2 protein seviyesi tüm zebrabalığı beyninde önemli ölçüde artmamış olsa da, protein seviyesi telensefalon ve beyincikte (serebellum) önemli ölçüde artmıştır. Ayrıca, hücre içi protein fraksiyonasyonu, sitozolik kısımda zenginleştirilmiş bir Smurf2 seviyesi göstermiştir. Gen ekspresyon seviyeleri durumunda, smurf2 seviyesi yaşlı tüm beyinde önemli ölçüde daha yüksekken, telensefalon ve beyincikte ekspresyonu yaşlanma sırasında azalmıştır. Ayrıca yaşlı telensefalonda mdm2, ep300a ve sirt1 seviyeleri gençlere göre daha düşüktü. Çok değişkenli analize göre, Smurf2 aracılığıyla ubikuitin ekleme, ep300a aracılı asetilasyon ve Sirt1 aracılı deasetilasyon arasında potansiyel bir denge vardır, ancak ilerleyen yaşla birlikte bu denge bozulabilir ve diğer düzenleyici genlerin de hücresel stabiliteyi sürdürmek için rol alması gerekebilir. İkinci amaç, Smurf2'nin beyin yaşlanmasındaki rolünü, indüklenebilir knockin, stabil knockout veya geçici knockdown gibi genetik müdahaleler yardımıyla araştırmaktı. Kararlı knockin ve knockout modellerinin daha detaylı araştırmasından önce genotiplenmesi gerektiğinden, etkili ve güvenilir bir metot bulmak için genotipleme ve fenotipleme yöntemleri kullanıldı. Ayrıca, Vivo-morfolino aracılığıyla geçici knockdown, yetişkin beynine uygulandı ve Smurf2'nin hem genç hem de yaşlı zebra balığı üzerindeki etkilerini incelemek için iki farklı morfolinonun en etkili olduğu enjeksiyon sonrası süreleri belirlendi. Son olarak, diyet rejimleri ve farmakolojik bileşikleri içeren genetik olmayan müdahalelerin, smurf2 ve etkileşim ortaklarının gen ekspresyonu ve nöronal ve proliferasyon/senesans proteinlerinin seviyeleri üzerindeki etkilerinin incelenmesi amaçlanmıştır. Zıt kısa süreli diyet rejimleri, aşırı besleme ve kalori kısıtlaması, nöronal proteinlerin, HuC ve DCAMKL1, düzeylerini ve bunların
viii
yaşlanma sırasında proliferasyon ve yaşlanma proteinleri ile ilişkisini değiştirdi. Ayrıca, tp53 dışındaki etkileşimli partnerlerinin ve smurf2‘nin gen ekspresyon seviyeleri, beslenme rejimlerinden ve yaşlanmadan etkilenmemiştir. Ayrıca, çok değişkenli analiz, smurf2, mdm2, ep300a ve sirt1 arasındaki ilişkinin, diyet rejiminden bağımsız olarak hem genç hem de yaşlılarda korunduğunu göstermiştir; bu, yaşlanma sırasında hücresel stabiliteyi sağlamak için ubikuitin ekleme, asetilasyon ve deasetilasyon arasındaki dengenin korunduğu anlamına gelebilir. Ayrıca, HECT E3 ligazlarının bir inhibitörü olan heclin, Smurf2 aktivitesini inhibe etmek için kullanıldı. Yetişkin zebra balıklarında kullanılmadan önce, etkilerini görmek için embriyolara heclin uygulandı. Heclin dozunun artması hayatta kalma oranını düşürdü ve bazı genlerin ekspresyon seviyelerini büyük ölçüde değiştirdi. Bu nedenle, yetişkin beynine orta doz heclin uygulanmalı ve hedef dışı, spesifik olmayan etkiler yerine hedef etkileri gözlemlemek için nöronal belirteçler incelenmelidir. Birlikte ele alındığında, Smurf2 yaşlanma sırasında potansiyel rollere sahiptir ve beyin yaşlanma sürecini ve muhtemelen yaşa bağlı bilişsel gerilemenin ortaya çıkışını geciktirmek için umut verici bir hedef olabilir.
Anahtar Sözcükler: zebrabalığı, yaşlanma, beyin, smurf2, kalori kısıtlaması, aşırı beslenme, genetik müdahaleler, heclin, nöronal proteinler
ix
x
ACKNOWLEDGEMENTS
I am deeply grateful to my advisor Prof. Dr. Michelle Adams for giving me a great opportunity to work in the field of the neuroscience, for her endless support, guidance and patient throughout this thesis journey.
I am very thankful to Assoc. Prof. Dr. Güneş Özhan Baykan for her patience with my questions, her feedback and support on the project and being a thesis progress committee and a jury member. I would like to thank to Assoc. Prof. Dr. Urartu Özgür Şafak Sezer for his feedback and critical discussion during my thesis progress and being a thesis progress committee and a jury member. I am also thankful to Assoc. Prof. Dr. Özlen Konu and Assoc. Prof. Dr. Çağdaş Devrim Son for evaluating my thesis and being a jury member.
I would like to thank to Assoc. Prof. Dr. Ayça Arslan-Ergül for her patience, support, critical discussion and encouraging me during these years. I am grateful to my colleagues Elif Tuğce Karoglu-Eravşar for her friendship, endless support and advices, Meriç Kınalı for helping with the preparation of graphs, her sisterhood and compassion. I also thank to all former and current members of Adams Lab; Dilan Çelebi-Birand, Begün Erbaba, Füsun Doldur-Ballı, Zeynep Gültekin, Özge Pelin Burhan, Göksemin Fatma Şengül, Naz Şerifoğlu, Bilge Aşkın, Naz Mengi, Esra Şenol, Beyza Özen, Hande Aydoğan, Duygu Macaroğlu, Duygu Mutlu and Narin Ilgım Ardıç. I would like to record my sincere appreciation to Tülay Arayıcı for her endless support and help in the zebrafish facility.
xi
I have special thanks to my beloved friends, Levent Karacasulu, Merve Akkulak, Ceren Ok and Sevtap Songül for their endless support, understanding, compassion and love.
I am deeply grateful to my parents without them I couldn‘t get to this point. I would like to thank to my mother Ayşe Şahinbay for encouraging me all the time, her unhesitant support, patience and endless love. I am thankful to my father Ümit Tüz to his support, understanding and great love. I would like to thank my little brother Umut Tüz for his patience, moral support and love.
Last but not least, I am very lucky and grateful to have my spouse Reşat Şaşik. I have special thanks to him for encouraging, understanding, balancing, and helping me without hesitation and his compassion and eternal love. Also, I would like to thank to all family members I haven‘t mentioned yet in this limited page.
I would like to thank to The Scientific and Technological Research Council of Turkey (TÜBİTAK) for financial support as 2211 National Graduate Scholarship Programme (BIDEB). I would like to acknowledge European Molecular Biology Organization (EMBO) Installation Grant to Michelle M. Adams for financially supporting the experiments during my Ph.D.
xii TABLE OF CONTENTS
ABSTRACT iii
ÖZET vi
ACKNOWLEDGEMENTS x
TABLE OF CONTENTS xii
LIST OF FIGURES xvi
LIST OF TABLES xx
CHAPTER 1 1
INTRODUCTION 1
1.1 Brain Aging ... 1
1.2 Molecular hallmarks of aging ... 2
1.2.1 Genomic stability ... 2
1.2.2 Telomere attrition ... 3
1.2.3 Proteostasis ... 3
1.2.4 Deregulated nutrient sensing ... 4
1.2.5 Cellular senescence ... 4
1.3 Smurf2 and its interacting partners ... 5
1.3.1 Smurf2 ... 6 1.3.2 Tp53 ... 7 1.3.3 Mdm2 ... 8 1.3.4 Ep300a ... 8 1.3.5 Yy1a ... 9 1.3.6 Smad7 ... 9 1.3.7 Sirt1 ... 10
1.4 Zebrafish as a gerontological model ... 10
1.5 Genetic interventions ... 12
1.5.1 Tol2 transposase system ... 13
1.5.2 CRISPR-Cas9 system ... 14
1.5.3 Vivo-morpholino knockdown technology ... 14
1.6 Non-genetic interventions ... 15
xiii
1.6.2 Pharmacological interventions ... 16
1.7 Aims and Hypothesis ... 18
CHAPTER 2 20 METHODS ... 20
2.1 Subjects ... 20
2.1.1 Animals ... 20
2.1.2 Cell lines ... 22
2.2 Dissection of adult zebrafish brain ... 23
2.3 Protein Isolation ... 24
2.3.1 Total protein isolation ... 24
2.3.2 Subcellular protein isolation ... 25
2.3.3 Bradford assay ... 26
2.4 Western Blotting ... 27
2.5 RNA isolation ... 32
2.6 cDNA synthesis ... 32
2.7 Quantitative real time PCR (qRT-PCR) ... 32
2.8 DNA isolation and plasmid isolation ... 33
2.9 Conventional PCR ... 34
2.9.1 PCR amplification to obtain Smurf2 CDS flanked with attB sites ... 34
2.9.2 PCR amplication to genotype Tg(hsp70l:smurf2_EGFP) F1 embryos ... 35
2.9.3 PCR-based methods to genotype Tg(smurf2_e10) ... 36
2.10 Tol2 transposase system ... 38
2.11 CRISPR-Cas9 knockout system ... 39
2.12 Microinjection into one-cell stage embryos ... 41
2.13 Heat-shock treatment ... 41
2.14 Vivo-morpholino injection ... 42
2.15 Heclin treatment ... 43
2.16 STRING analysis for interacting partners of Smurf2 protein ... 44
2.17 Statistical Analysis ... 45
xiv
THE LEVELS OF BRAIN-SPECIFIC EXPRESSION OF SMURF2 AND ITS
INTERACTING PARTNERS WERE ALTERED ACROSS LIFESPAN 47
3.1 Two commercially available Smurf2 antibody were validated in
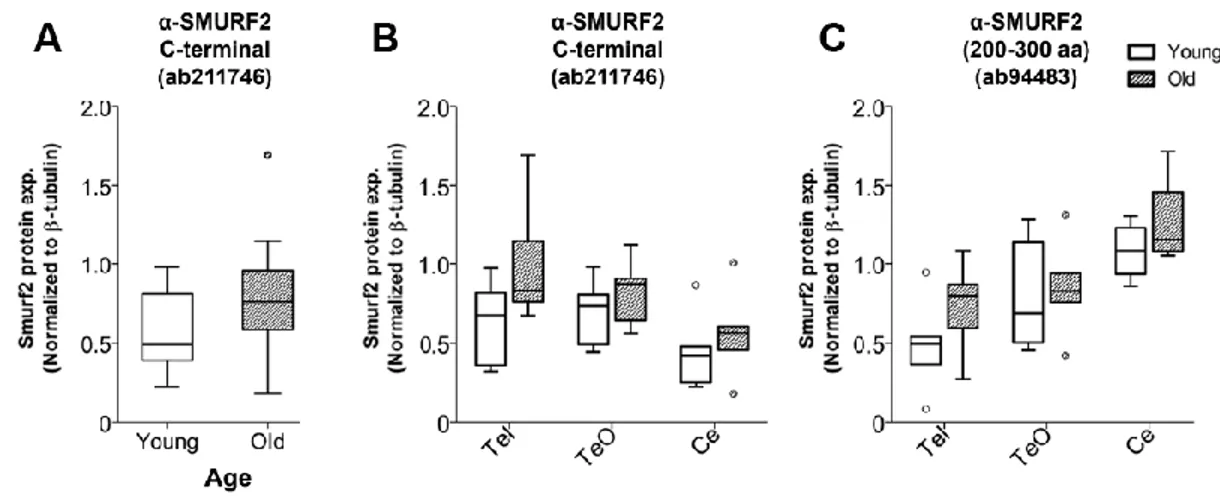
zebrafish brain ... 47 3.2 Smurf2 protein expression was altered during brain aging ... 48 3.3 Smurf2 protein was localized mostly in cytosolic fraction ... 51 3.4 The expression levels of smurf2 and its interacting partners were
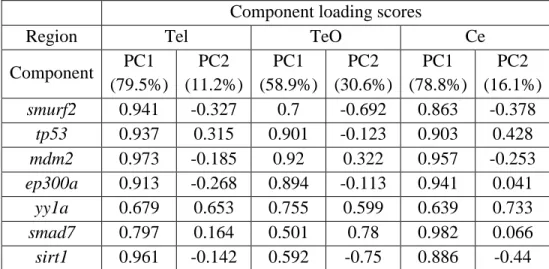
changed in the whole brain and brain regions across lifespan ... 55 3.5 There was a potential balance between ubiquitination, acetylation,
and deacetylation regulatory genes during brain aging according to
multivariate analysis ... 59 3.6 Discussion and Conclusions ... 69
CHAPTER 4 76
THE STABLE AND TRANSIENT GENETIC INTERVENTIONS CHANGED THE
SMURF2 LEVELS IN THE ADULT ZEBRAFISH BRAIN 76
4.1 The heat-inducible Tol2 transposase system was utilized to obtain
an inducible Smurf2 overexpression model ... 76 4.1.1 The prepared destination vector and Tol2 transposase mRNA were co-injected into one-cell stage embryos which grew in the adulthood ... 76 4.1.2 Heat-shock application and PCR experiments was used to confirm the founder animals and their F1 generation ... 77 4.1.3 Discussion and Conclusions ... 82 4.2 The gene knockout of Smurf2 across lifespan were obtained by
utilizing CRISPR-Cas9 system ... 85 4.2.1 Several PCR-based methods were employed for genotyping the founder fish and F1 generation embryos ... 86 4.2.2 Discussion and Conclusions ... 88 4.3 Vivo Morpholino ... 89
4.3.1 Exon-skipping Vivo-morpholino decreased the protein intensity in a non-significant manner ... 90 4.3.2 Translational Vivo-morpholino also decreased the protein levels of Smurf2 but the level of downregulation did not reach statistically significant level with observed timepoints ... 92 4.3.3 Discussion and Conclusions ... 95
xv
CHAPTER 5 98
THE NON-GENETIC INTERVENTIONS INCLUDING DIET AND INHIBITOR TREATMENT ALTERED THE EXPRESSION OF INTERACTING PARTNERS
OF SMURF2 AND NEURONAL MARKERS 98
5.1 Dietary interventions, overfeeding and caloric restriction, altered the body parameters and neuronal markers while they did not affect the
expression of Smurf2 and its interacting partners in the brain ... 98 5.1.1 The dietary regimens changed the primary and secondary body parameters
98
5.1.2 The neuronal markers, HuC and DCAMKL1, were altered by aging and dietary regimens ... 102 5.1.3 Global proliferation marker, PCNA, and senescence associated protein Smurf2, did not change with age and diet ... 105 5.1.4 The neuronal markers, HuC and DCAMKL1, were negatively correlated especially in aged brain while DCAMKL1 and PCNA were highly correlated in both young and aged brain ... 107 5.1.5 Age and dietary regimens did not affect the gene expression levels of
smurf2 and interacting partners ... 111
5.1.6 The post-translational modifications, ubiquitination, acetylation and deacetylation, controlling genes were in a potential balance during aging ... 116 5.1.7 Discussion and Conclusions ... 119 5.2 The specific inhibitor of HECT E3 ligase, Heclin, altered the
expression of mdm2 and tp53 in zebrafish embryos ... 131 5.2.1 Increasing doses of heclin decreased the survival proportions of embryos
131
5.2.2 Heclin treatment altered the expression of Smurf2 interacting partners, especially in terms of mdm2 ... 133 5.2.3 The early-differentiated neuronal marker, HuC, was changed in embryos with respect to the treatment of heclin ... 135 5.2.4 Discussion and Conclusions ... 139
CHAPTER 6 142
OVERALL DISCUSSION AND CONCLUSIONS, AS WELL AS FUTURE
PROSPECTIVES 142
xvi
LIST OF FIGURES
Figure 1.1 STRING analysis of 7 proteins in (A) human; (B) zebrafish. Color nodes represent the proteins and color lines represent interaction type between nodes. Green line: activation, red line: inhibition, blue line: binding, purple line: catalysis, cyan line: phenotype, magenta line: PTM, black line: reaction, yellow line: transcriptional regulation. (Reprinted from Tuz-Sasik et al., 2020 [36]) ... 6 Figure 1.2. Zebrafish developmental time line and its properties as a model organism. The image is created with BioRender. ... 12 Figure 2.1 Representation of the microdissection procedure. (A) Dorsal photograph of zebrafish brain, (B) schematic representation of brain regions. Tel: telencephalon and olfactory bulb, TeO: the optic tectum, Ce: the cerebellum/medulla/spinal cord.
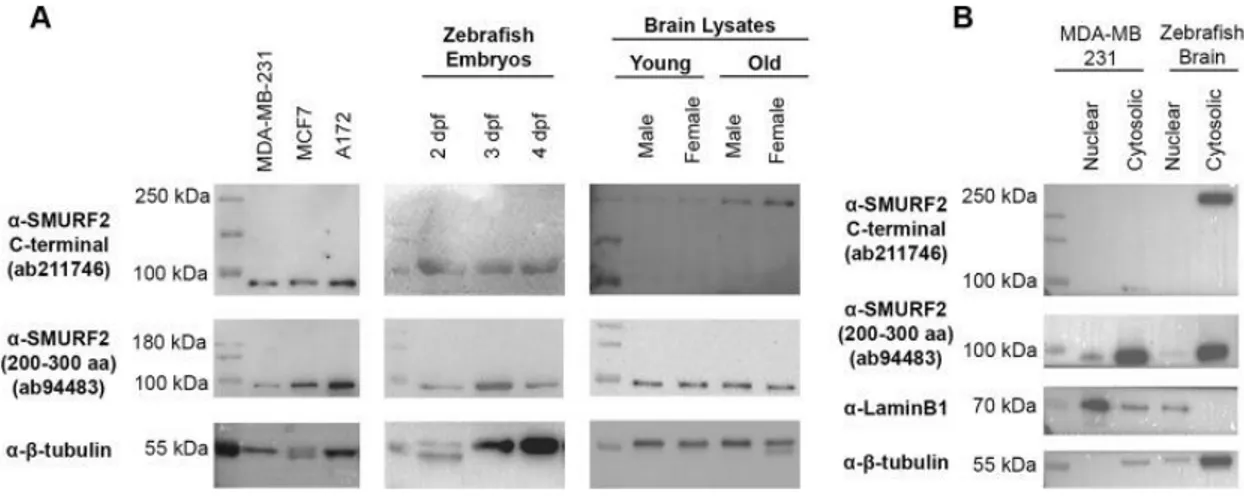
(Adapted from Näslund, 2014 [119]) ... 24 Figure 2.2 (a) Fluorescent signal at the injection site, the dispersion of injection solution is weak. (b) A good injection with homogenous dispersion of fluorescence signal. (c) Uninjected control, long exposure than injected ones. ... 43 Figure 3.1 Antibody validation of anti-SMURF2 antibodies, the anti-SMURF2, 200– 300 aa, and anti-SMURF2 C-terminal antibody. (A) Protein lysates from the MDA-MB-231 cell line, the MCF7 cell line, and the A172 cell line, protein lysates of
zebrafish embryos and protein lysates of zebrafish brain. (B) Subcellular fractionation was validated with a nuclear marker, LaminB1 and a cytosolic marker, β-tubulin. (Reprinted from Tuz-Sasik et al., 2020 [36]) ... 48 Figure 3.2 Representative Western images for Smurf2 antibodies and the
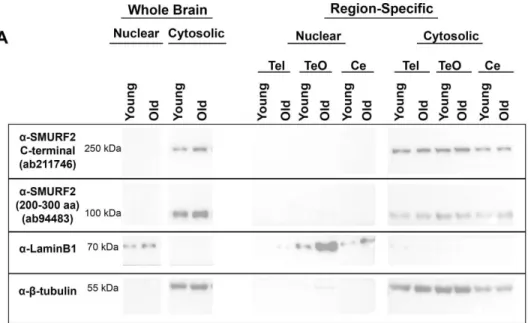
housekeeping, β-tubulin, in whole brain lysates and region-specific lysates including telencephalon (Tel), the optic tectum (TeO) and the cerebellum/medulla/spinal cord (Ce) areas. (Reprinted from Tuz-Sasik et al., 2020 [36]) ... 50 Figure 3.3 (A) Smurf2 protein expression levels detected with the anti-SMURF2 (200–300 aa) antibody. (B) Smurf2 protein expression levels detected with the anti-SMURF2 C-terminal antibody. Tub-normalized values are indicated in (A) and (B). * indicates p<0.0167. (Reprinted from Tuz-Sasik et al., 2020 [36]) ... 51 Figure 3.4 Representative Western blots for subcellular fractions. Smurf2 protein was enriched in the cytosolic fraction of the zebrafish brain. (Reprinted from Tuz-Sasik et al., 2020 [36]) ... 53 Figure 3.5 Smurf2 protein was enriched in the cytosolic fraction of the zebrafish brain. (A) Smurf2 protein expression levels detected with the anti-SMURF2 (200– 300 aa) antibody. (B) Smurf2 protein expression levels detected with the anti-SMURF2 C-terminal antibody. Tub-normalized values are indicated in (A) and (B). ... 54 Figure 3.6 Smurf2 protein was enriched in the cytosolic fraction of the zebrafish brain. (A)(B) Smurf2 protein expression levels detected with the anti-SMURF2 C-terminal antibody in the cytosolic fraction of the zebrafish brain. (C) Smurf2 protein
xvii
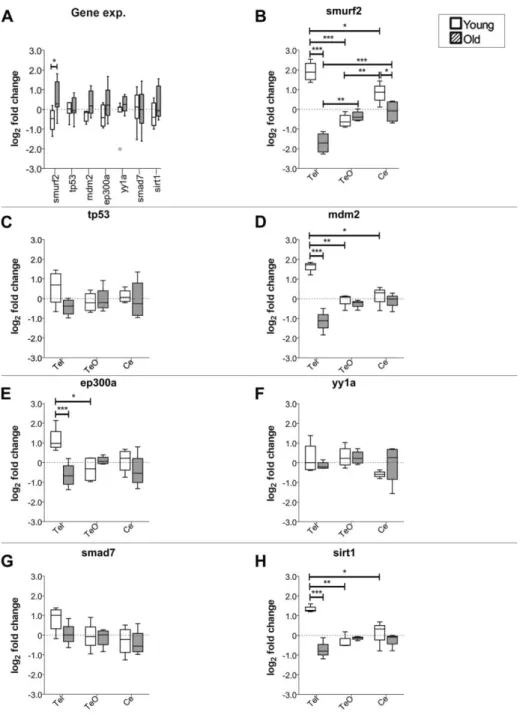
expression levels detected with the anti-SMURF2, 200–300 aa, antibody in the cytosolic fraction of the zebrafish brain. Tub-normalized values are indicated in (A), (B), and (C). (Reprinted from Tuz-Sasik et al., 2020 [36]) ... 55 Figure 3.7 The relative gene expression levels of smurf2 and its interacting partners. (A) The relative expression levels of the target genes of interest in whole zebrafish brain during aging. The brain region-specific expression levels of (B) smurf2, (C)
tp53, (D) mdm2, (E) ep300a, (F) yy1a, (G) smad7 and (H) sirt1 during aging. *
indicates p<0.05, ** indicates p<0.01, *** indicates p<0.001. (Reprinted from Tuz-Sasik et al., 2020 [36]) ... 58 Figure 3.8 Loading plot and scatterplot of the first and second principal component scores arranged by the factor of age in whole zebrafish brain. Old=red,
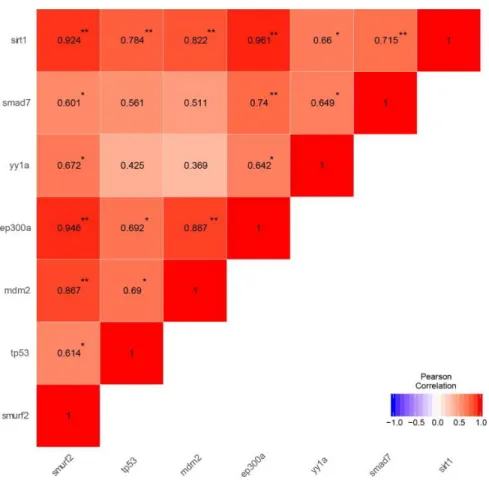
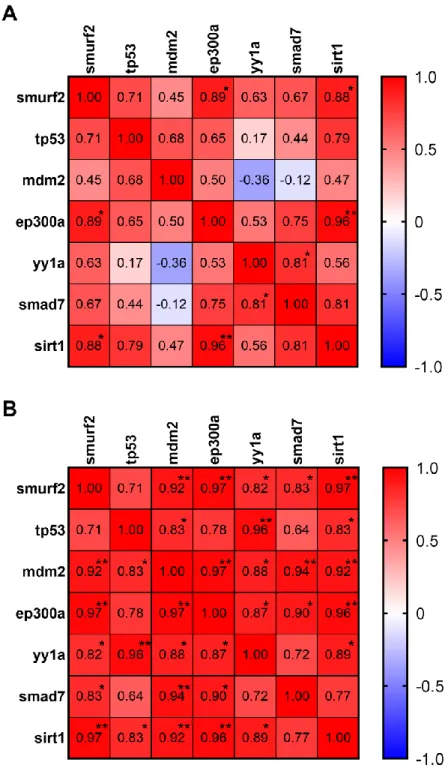
young=orange. The loading plot was generated by Meriç Kınalı. (Reprinted from Tuz-Sasik et al., 2020 [36]) ... 61 Figure 3.9 Pearson correlation matrix of genes of interest in whole zebrafish brain. *p<0.05, **p<0.01. The correlation matrix was generated by Meriç Kınalı.
(Reprinted from Tuz-Sasik et al., 2020 [36] ) ... 63 Figure 3.10 Pearson correlation matrices of genes of interest in (A) young and (B) old whole zebrafish brain. *p < 0.05, **p< 0.01. ... 64 Figure 3.11 Loading plots the scatterplots of the first and second principal component scores arranged by the factor of age in specific zebrafish brain regions; (A) Tel, (B) TeO, (C) Ce. Old=red, young=orange. The loading plots were generated by Meriç Kınalı. (Reprinted from Tuz-Sasik et al., 2020 [36]) ... 67 Figure 4.1 Agarose gel to confirm transposase mRNA integrity. Lane 1: DNA
marker, Lane 2, 3: in vitro transcribed transposase mRNA. ... 77 Figure 4.2 Fluorescence microscope images of Tg(hsp70l:smurf2_EGFP) F1 (Tol2-1M, Tol2-6F) and WT embryos. ... 78 Figure 4.3 PCR products of Smurf2 primers. ... 79 Figure 4.4 Gradient PCR products of EGFP primers. 61oC was chosen for the next PCR experiments with this primer pair. ... 79 Figure 4.5 PCR products of β-Actin and EGFP primers. ... 80 Figure 4.6 Gene expression levels of smurf2 was increased with Tol2 genotype in heat-shock treated group as compared to WT heat-shock treated embryos. *: p<0.05. ... 81 Figure 4.7 Gradient PCR for genotyping pair #1 to utilize in ACT-PCR. ... 86 Figure 4.8 Representative image of T7E1 assay. C9: only cas9 injected F0, CC: gRNA and cas9 injected F0. ... 87 Figure 4.9 Representative RFLP results. C9: only cas9 injected F0, CC: gRNA and
cas9 injected F0. ... 88
Figure 4.10 Representative Western image for Anti-SMURF2 C-terminal (~200 kDa) and β-tubulin (55 kDa) antibodies after exon-skipping Vivo-morpholino injection... 91
xviii
Figure 4.11 Protein expression level of Smurf2 was not altered with respect to post injection time. Tub-normalized values are indicated. ... 91 Figure 4.12 Representative Western image after translational blocking
Vivo-morpholino injection. ... 93 Figure 4.13 Protein expression level of Smurf2 was not altered with respect to
treatment and post injection time. Tub-normalized values are indicated. ... 93 Figure 4.14 Protein expression level of Smurf2 was not altered with respect to
treatment and post injection time when uninjected animals were also incised with syringe under anesthesization. Tub-normalized values are indicated. ... 95 Figure 5.1 Body weight was altered with respect to aging and dietary regimens. Corrected p-values, *: p<0.025, **: p<0.005, ***: p<0.0005. ... 99 Figure 5.2 Body length of zebrafish was altered in terms of age and diet. *: p<0.05, **: p<0.01, ***: p<0.001. ... 100 Figure 5.3 Secondary body parameters, (A) BMI and (B) Fulton K factor, were changed by dietary regimens. Corrected p-values, *: p<0.025, **: p<0.005, ***:
p<0.0005. ... 102
Figure 5.4 HuC and DCAMKL1 antibodies were validated in zebrafish brain. (A) Antibody validation with positive controls; NIH3T3 and mice brain lysate. (B) Representative Western blots for HuC and DCAMKL1 across age and diet groups. ... 103 Figure 5.5 Protein expression levels of post-mitotic neuronal markers (A) HuC and (B) DCAMKL1 in terms of age and diet. Tub-normalized values are indicated in (A) and (B). *: p<0.05, **: p<0.01. ... 104 Figure 5.6 PCNA antibody were validated in zebrafish brain. (A) Antibody validation with positive controls; HEK293 and NIH3T3 protein lysates. (B) Representative Western blots for PCNA and Smurf2 across age and diet groups. ... 105 Figure 5.7 Protein expression levels of (A) global proliferation marker, PCNA and (B) senescence-related protein, Smurf2 in terms of age and diet. Tub-normalized values are indicated in (A) and (B). ... 107 Figure 5.8 Pearson correlation matrix indicated a negative correlation between HuC and DCAMKL1 protein levels and a positive correlation between DCAMKL1 and PCNA protein levels. *: p<0.05, **: p<0.01, ***: p<0.001. ... 109 Figure 5.9 Pearson correlation matrices indicated diverse correlations between
proteins of interest in (A) young and (B) old brains. *: p<0.05, **: p<0.01, ***: p<0.001. ... 110 Figure 5.10 The relative gene expression levels of smurf2 and its interacting partners. (A) smurf2, (B) tp53, (C) mdm2, (D) ep300a, (E) yy1a, (F) smad7 and (G) sirt1 with respect to age and diet. ***: p<0.001. ... 113 Figure 5.11 Pearson correlation matrix indicated strong correlations among smurf2,
xix
Figure 5.12 Pearson correlation matrices indicated diverse correlations between genes of interest in (A) young and (B) old brains. *: p<0.05, **: p<0.01, ***: p<0.001. .. 118 Figure 5.13 Survival analysis indicated that the survival distributions for the
interventions were statistically different. ... 132 Figure 5.14 The relative gene expression levels of smurf2 and its interacting partners in whole embryo at 72 hpf after heclin treatment; (A) smurf2, (B) tp53, (C) mdm2, (D) ep300a, (E) yy1a, (F) smad7 and (G) sirt1 . **: p<0.01, ***: p<0.001. ... 134 Figure 5.15 Survival analysis indicated that the survival distributions for the
interventions for 5 days were not statistically different. ... 136 Figure 5.16 Protein expression level of Smurf2 was not altered with respect to heclin treatment and time. Tub-normalized values are indicated. ... 137 Figure 5.17 Protein expression level of (A) HuC, (B) DCAMKL1 and (C) PCNA was altered with respect to developmental time. Tub-normalized values are indicated. *: p<0.05, **: p<0.01, ***: p<0.001. ... 139 Figure 6.1 STRING analysis of 13 proteins in humans. Nodes represent the proteins and the colors in the nodes represent the specific functional enrichment in the network; blue in node: protein ubiquitination (GO:0016567), purple in node:
regulation of synaptic plasticity (GO:0048167), red in node: neurodegeneration (KW-0523), green in node: Alzheimer‘s disease (KW-0026) and yellow in node:
Parkinson‘s disease (KW-0907). Color lines represent interaction type between nodes; green line: activation, red line: inhibition, blue line: binding, purple line: catalysis, cyan line: phenotype, magenta line: PTM, black line: reaction, yellow line: transcriptional regulation. ... 145
xx
LIST OF TABLES
Table 2.1 Preparation of BSA standards ... 26
Table 2.2 10% and 8% Resolving Gel Recipes ... 28
Table 2.3 5% Stacking Gel Recipe ... 28
Table 2.4 2X Loading Buffer recipe ... 29
Table 2.5 Primary and secondary antibodies used in the study. ... 31
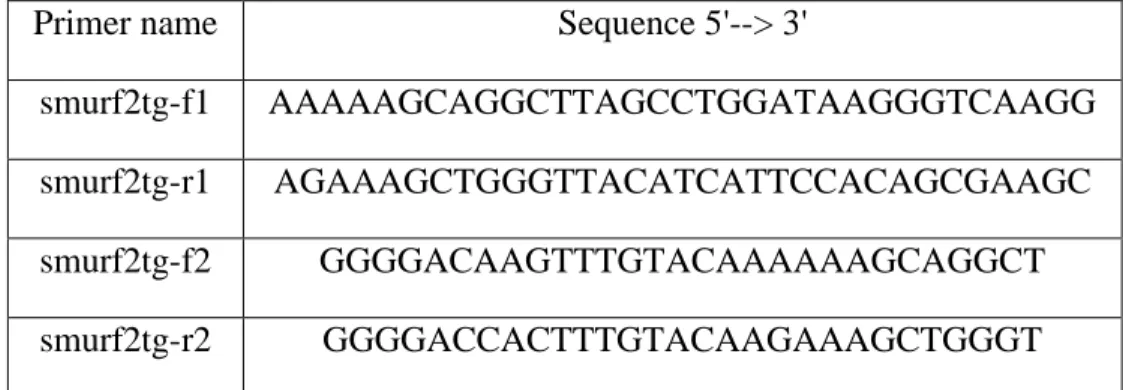
Table 2.6 The sequences of primer pairs used in this study. ... 33
Table 2.7 Primer sequences for PCR to add attB (recombination sites) to Smurf2 coding sequence. ... 35
Table 2.8 Primer sequences for genotyping Tg(hsp70l:smurf2_EGFP) F1 embryos. 36 Table 2.9 Primer pairs for ACT-PCR. ... 37
Table 2.10 M13 Sequencing primers. ... 39
Table 2.11 Oligo sequences to anneal guide RNAs. ... 40
Table 3.1 Component loading scores of PC1 and PC2 in terms of whole brain gene expression. ... 62
Table 3.2 Component loading scores of PC1 and PC2 in terms of brain regions; Tel, TeO and Ce. ... 66
Table 5.1 Survival proportions (%) at the time of 24, 48, and 72 hpf for each treatment solutions. ... 132
1
CHAPTER 1
INTRODUCTION 1.1 Brain AgingAging is a natural process that is the ultimate combination of numerous intrinsic and extrinsic changes in an organism. Normal aging is associated with impairments in cognitive function, including the slowing of information processing, declines in memory and increased failure of executive or strategic control over cognitive operations [1]. During normal aging, there is a measurable but tolerable loss in cognitive ability that does not affect a person‘s quality of life or ability to function [2].
At first sight, brain aging is thought to be a result of neuronal death. However, studies using multiple model organisms have shown that there is no significant change in the hippocampal neuron number with aging and so neuron loss does not contribute to age-related cognitive decline [3]. In another study, the number of neurons in the hippocampus, parahippocampal region and subregions of parahippocampal region including perirhinal cortex, lateral entorhinal area, postrhinal cortex and medial entorhinal area showed no significant differences between young and aged groups [4]. Brain aging is not a loss of neurons while it is accompanied by specific and relatively subtle synaptic alterations in the hippocampus and prefrontal cortex [5]. Furthermore, until recently it was hypothesized that neurons are not regenerated unlike cells in colon or skin tissues. Recent evidence showed that neurons also regenerate but at a slower rate than most of the other tissues [6].
2
Neurogenesis, a process of regenerating new neurons from neural progenitors, occurs in restricted brain regions across lifespan in mammals [7]. Also, it was shown that 700 new neurons are generated every day in each hippocampus of adult human brain [8] while its rate declines with aging [6], [8]. Moreover, it has been shown that subtle cellular and synaptic alterations have contribution to brain aging [9]–[12]. Therefore the molecular and cellular alterations may give more insight into the brain aging process.
1.2 Molecular hallmarks of aging
At the molecular level, because of the accumulation of cellular damage throughout the life, a loss of physiological integrity and function increases vulnerability to pathologies, which are the characteristics of aging process [13]. López-Otín et al. have defined nine hallmarks of aging that represent common features of aging in different organisms, which are genomic instability, telomere attrition, epigenetic alterations, loss of proteostasis, deregulated nutrient sensing, mitochondrial dysfunction, cellular senescence, stem cell exhaustion, and altered intercellular communication [13]. These likely contribute to the aging phenotypes in the brain.
1.2.1 Genomic stability
Genomic instability increases with age because of the accumulation of exogenous and endogenous factors such as mutations and reactive oxygen species [14]. During DNA replication, polymerases can do some errors, however, the other enzymes in the nucleus can proof-read and correct these errors. Also, the external
3
mutagens such as chemicals and ultraviolet radiation in sunlight cause mutations in the genome. If the errors cannot be compensated by several repair mechanisms, which deal with most of the damages of nuclear DNA, the mutations in the genome are accumulated in the cells [15]. Thus, tumor progression and premature aging diseases, such as Werner syndrome and Bloom syndrome, are the consequence of increased DNA damage accumulation [15], [16]. Because of the important role in the center of cell, genomic instability is a primary hallmark of aging.
1.2.2 Telomere attrition
Telomere attrition is another primary hallmark of aging. During replication, DNA polymerases cannot replicate completely the terminal ends of linear DNA molecules called end-replication problem [17] unless telomerase, a specialized DNA polymerase, is not expressed in the cell. Thus, the progressive and cumulative loss of telomere-protective sequences from chromosome ends occurs and finally telomere attrition is a normal process during aging. Recently, it was demonstrated that post-mitotic neurons display the characteristics of senescence due to telomere attrition [18]. Moreover, telomere shortening leads to apoptosis and replicative senescence [13], [14].
1.2.3 Proteostasis
Proteostasis involves the multiple mechanisms including protein synthesis, protein folding, the stabilization of correctly folded proteins, trafficking, aggregation, disaggregation and degradation of misfolded/unfolded proteins by the proteasome or the lysosome [19]. It was shown that the quality control mechanisms of proteostasis are altered with aging [20]. Moreover, aging and age-related pathologies including
4
Alzheimer‘s disease and Parkinson‘s disease are associated with impaired proteostasis or impaired proteasomal degradation mechanism [19].
1.2.4 Deregulated nutrient sensing
The somatotrophic axis consist the growth hormone (GH) and its secondary mediator, insulin-like growth factor 1 (IGF1). The intracellular signaling pathway driven by IGF1 informs cells about glucose presence like insulin. Thus, insulin and IGF1 signaling (IIS) pathway is the most conserved aging-controlling pathway [13]. Genetic changes or non-genetic interventions that alter the functions of GH, IGF1 receptor, insulin receptor, or downstream intracellular effectors have been linked to longevity both in humans and in model organisms [21], [22]. Also, the sirtuin family regulates the lifespan together with metabolism [23]. For example, the high fat diet in mice caused to downregulation of SIRT1 protein levels in hippocampus [24] while caloric restriction (CR) diet increased sirt1 gene expression in the prefrontal cortex and hippocampus [25] and SIRT1 protein expression in hippocampus [26].
1.2.5 Cellular senescence
As implied by its name, senescence derives from senex, a Latin word meaning old man or old age. This senescence is an antagonistic hallmark of aging and sometimes termed cellular aging or replicative senescence [27]. The term ―senescence‖ means deteriorative processes following development and maturation. Cellular senescence is a compensatory response that operates by removing damaged and potentially oncogenic cells. In aged organisms, this system may become inefficient and leads to the accumulation of senescent cells that may contribute to aging [13]. The p16 gene is an important regulator of senescence and used to identify
5
senescent cells [28]. The other marker to be used for the specific identification of senescent cells is the senescence-associated β-galactosidase (SA-β-gal) [29]. Although the senescence term comes from a word meaning old age, actually it is an important compensatory mechanism to protect organisms from the accumulation of damaged cells and so has an antagonistic effect on aging [13].
1.3 Smurf2 and its interacting partners
SMAD specific E3 ubiquitin protein ligase 2 (Smurf2) has several roles in diverse cellular processes and works coordinately with some interacting partners to regulate downstream genes and proteins [30]. It may a common factor with the ability to regulate most of the hallmarks of aging mentioned previous sections. For example, the ectopic expression of Smurf2 is enough to induce telomere attrition-dependent cellular senescence [31]–[33] and it controls the genomic stability through RNF20 [34]. Moreover, its expression increased in hematopoietic stem cells (HSCs) during aging [35]. In the light of these evidences, Smurf2 and its interacting partners (Figure 1.1) should be investigated in terms of aging in detail.
6
Figure 1.1 STRING analysis of 7 proteins in (A) human; (B) zebrafish. Color nodes represent the proteins and color lines represent interaction type between nodes. Green line: activation, red line: inhibition, blue line: binding, purple line: catalysis, cyan line: phenotype, magenta line: PTM, black line: reaction, yellow line: transcriptional regulation. (Reprinted from Tuz-Sasik et al., 2020 [36])
1.3.1 Smurf2
Smurf2 is a conserved HECT-domain E3 ubiquitin ligase and belongs to Nedd4 subgroup [37]. Firstly, its negative regulatory role in transforming growth factor β (TGF-β) signaling was defined [38]. Smurf2 interacts with phosphorylated Smads and TGF-β type 1 receptor and leads to their ubiquitination and degradation [30]. Then, its role in other signaling pathways and cellular processes were identified [31]–[35]. For example, telomere attrition causes the increased Smurf2 expression
7
and its overexpression is enough to induce the senescent phenotype [31]. Furthermore, the expression of Id1 at protein level decreases depending on the upregulation of Smurf2 expression which is the result of telomere shortening [31], [32]. It was suggested that the decline in the protein level of Id1 link Smurf2 with p16 mechanistically. It is already known that the gene expression of p16 increases in cells during senescence and this leads to the decrease in stem cell self-renewal during aging [35]. Moreover, in a review paper by David et al., Smurf2 was defined as a double edged sword because of both tumor-suppressor and tumor-promoter functions [30]. However, most of the published studies focused on its role in cancer mechanism. A previous research of our group indicated that smurf2 gene expression increases significantly in the brain of aged zebrafish [39]. It should be further investigated in terms of brain aging because of its significant impacts on the hallmarks of aging.
1.3.2 Tp53
Tumor protein p53 (tp53) is often called as the guardian of the genome [40]. It has key regulatory roles in cell cycle arrest, DNA repair, apoptosis, and cellular senescence as a response to cellular stressors [41], [42]. The activity of tp53 is under tight control of post-translational modifications (PTMs), protein-protein interactions and protein stabilization [41], [43]. For example, the predominant negative regulator of tp53 is an E3 ubiquitin ligase ‗mouse double minute 2‘ (MDM2) [41]. Also, a transcription factor, Yin Yang 1 (YY1), is also a negative regulator of tp53 [44], [45]. Smurf2 protein regulates both MDM2, and YY1 and indirectly tp53 levels [46], [47]. Furthermore, E1A Binding Protein P300 (ep300), a transcriptional co-activator,
8
acetylates tp53 protein [48] which inhibits the ubiqutination of tp53 by MDM2 [42]. However, MDM2 suppresses the acetylation of tp53 by ep300 [48].
1.3.3 Mdm2
E3 ubiquitin ligase ‗mouse double minute 2‘ (MDM2) is a negative regulator of tp53 [41]. As a RING-domain E3 ligase, MDM2 ubiquitinates and subsequently degrade tp53 protein [42]. Also, MDM2 activity and stability is regulated by several mechanisms [47]. For example, Smurf2 stabilizes the MDM2 protein to promote tp53 degradation [47]. On the other hand, YY1 interacts with MDM2 to form tp53-MDM2 complex and promote the degradation of tp53 [44], [45]. Furthermore, it was shown that dysregulation in the MDM2-tp53 balance leads to premature aging [43], [49].
1.3.4 Ep300a
Ep300, a transcriptional co-activator and histone and lysysl acetyltransferase, acetylates tp53, YY1 and Smad7 proteins [44], [48], [50]. The ep300-mediated acetylation of Smad7 protects it from ubiquitination-mediated degradation [50]. However, ep300-mediated acetylation of tp53 is inhibited by YY1 [44]. Last but not least, ep300 protein levels decrease in the senescent cells [51]. Taken together, ep300 may have an indirect relation with Smurf2 in the regulation of Smad7 and tp53 and should be investigated in terms of brain aging. Moreover, ep300 could be a master regulator of genes dysregulated in the obesity and normalized by CR and resveratrol [52].
Due to the existence of teleost-specific genome duplication [53], there are two paralogues of ep300 in the zebrafish genome, ep300a and ep300b. A previous study indicated that both ep300a and ep300b expressed in the adult brain while only ep300a
9
is catalytically active transferase in the brain [54]. In the present study conducted with zebrafish, ep300a gene was considered because of its active function in the brain.
1.3.5 Yy1a
YY1 is a transcription factor and it is a well-known negative regulator of tp53 [44], [45]. YY1 disrupts the interaction between tp53 and ep300 and thus acetylation and stabilization of tp53 [44]. As mentioned in previous section, YY1 is physically interacted with MDM2 and promotes the degradation of tp53 [44]. At that point, Smurf2 relieves the suppression on tp53 protein by ubiquitin-mediated degradation of YY1 [46]. In addition, YY1 regulates the genes associated with neurodegenerative diseases according to a transcriptional meta-analysis [55]. Lastly, it was shown that YY1 is a part of the repressor complex with sirtuin 1 (SIRT1) to suppress microRNA-134 and regulate synaptic plasticity and memory formation [56]. Hence, YY1 could be investigated to determine its role during brain aging.
Similar to ep300, YY1 has two paralogoues in the zebrafish genome, yy1a and yy1b, because of the genome duplication [53]. At 3 days post fertilization (dpf), yy1a was expressed in the brain and eye tissues and also yy1a knockdown caused to upregulation of tp53 and the developmental brain defects [57]. In the present study conducted with zebrafish, yy1a gene was considered because of its potential function in the brain.
1.3.6 Smad7
Smad7 is an inhibitory Smad that acts as a negative regulator of TGF-β signaling pathway [58]. Smad7 exports Smurf2 to the cytosol and recruits it to TGF-β
10
receptor complex for the ubiquitin-mediated degradation of TGF-β receptors as well as Smurf2 itself and Smad7 [58], [59]. However, ep300-mediated acetylation protects Smad7 against the ubiquitin-mediated degradation by Smurf2 [50], [60]. Moreover, Smad7 is deacetylated by SIRT1 to inhibit TGF-β signaling [58]. It has been shown that PTMs compete with each other to regulate the stability of Smad7 [50], [60]; Smad7 is ubiquitinated by Smurf2, acetylated by ep300 and deacetylated by SIRT1 [50], [58], [59].
1.3.7 Sirt1
SIRT1 is a nicotinamide adenine dinucleotide (NAD)-dependent deacetylase that regulates lifespan in concert with metabolism [23]. For example, its protein level decreases in the high fat-fed mice [24] while CR diet increased the gene and protein expression of SIRT1 [25], [26]. Moreover, SIRT1 regulates cellular senescence by deacetylating target proteins [61]. Specifically, SIRT1 deacetylates Smad7 and so inhibits TGF-β signaling [58]. Furthermore, tp53 is deacetylated by SIRT1 [62], [63]. Lastly, SIRT1 works coordinately with YY1 in a repressor complex to regulate synaptic plasticity and memory [56]. Taken together, all of these genes of interest are interacting with each other and their relations in terms of brain aging should be investigated to unravel the neurobiological underpinnings of aging.
1.4 Zebrafish as a gerontological model
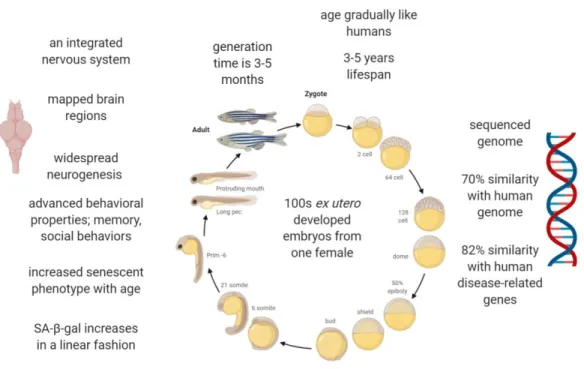
Zebrafish (Danio rerio) is a small teleost with several advantages. Firstly, one female may produce several hundred transparent eggs which provide an easy visual observation of developing embryos because embryos develop ex utero [64].
11
Secondly, because of their generation time is about 3–5 months [65], they can be reproduced to large populations easily and also large populations can be maintained at very low cost. Other advantage is that zebrafish genome has been sequenced already and show 70% similarity with human genome and 82% similarity with disease-related genes [66].
In addition to general advantages of zebrafish, it has become popular as a gerontological model because it has an integrated nervous system and shows cognitive decline and behavioral properties such as memory and social behaviors [14], [67]–[69]. They age gradually like humans [65]. Moreover, their major brain regions have been mapped and homologous regions were defined [70], [71]. For instance, the ventral division of the lateral zone of area dorsalis (Dlv) in medial pallium is the zebrafish equivalent of mammalian hippocampus while the medial zone of dorsal telencephalon (Dm) is the putative homolog of mammalian amygdala [70], [72]. Also, several studies indicated that long-term potentiation (LTP), the underlying mechanism of learning and memory, occurs in telencephalon region of zebrafish brain and it is N-methyl-D-aspartate (NMDA) receptor-dependent similar to mammals [73]–[75].
The zebrafish brain has regenerative properties and neurogenesis which is not restricted to the telencephalon but is widespread throughout the entire brain with 16 distinct proliferative zones [76], [77]. Although they possess a high regenerative capacity, their growth rate decreases with aging. Moreover, neurogenesis declines during aging [78], [79]. In parallel to decreasing growth rate and neurogenesis, zebrafish tissues such as skin and brain show increased senescent phenotype with age
12
[79], [80]. An important biomarker of aging, SA-β-gal, increases in a linear fashion with age in zebrafish [80]. Also, as explained in a review of Van Houcke et al., zebrafish share same hallmarks with mammals during aging [14]. All these features make zebrafish an attractive model organism to study brain aging and age-related changes. Also, it was shown that smurf2 expression is upregulated with advanced age in the adult zebrafish brain [39].
Figure 1.2. Zebrafish developmental time line and its properties as a model organism. The image is created with BioRender.
1.5 Genetic interventions
The forward and reverse genetic approaches are widely applicable on zebrafish to generate mutant or transgenic models. These genetic approaches can be
13
stable or transient based on their lifelong or short-term effects, respectively. This section covers Tol2 transposase system, CRISPR-Cas9 system and Vivo-morpholino knockdown technology.
1.5.1 Tol2 transposase system
Tol2 transposon system transposases and integrates the gene of interest into zebrafish genome very efficiently. The Tol2 element, the natural transposon in vertebrates, was identified from the genome of the medaka fish (Oryzias latipes). Firstly, the plasmid containing a Tol2 vector is produced according to experimental needs. For example, in addition to the gene of interest, a specific promoter that is ubiquitously expressed or expressed by an induction such as heat-shock, and/or a specific tag for easy detection such as EGFP or mCherry fluorescent tags can be integrated into the Tol2 vector [81]. The destination Tol2 vector is co-injected with in
vitro synthesized Tol2 transposase mRNA into one-cell stage embryos to catalyze the
transposition of the Tol2 vector including the gene of interest to the genome in the zebrafish germ lineage [82]. The Tol2 vector and transposase mRNA injected embryos, that are called as F0 generation, are grown to adulthood and crossed with wild-type animals to create stable transgenic fish in the next generations [82]. Moreover, by using the Tol2 transposon system, important genetic methods, such as gene trapping, enhancer trapping, and the Gal4-UAS system were developed to study developmental biology, organogenesis, and neuroscience [83].
14 1.5.2 CRISPR-Cas9 system
CRISPR/Cas9 can edit the genome of zebrafish with high efficiency [84]. Clustered, regularly interspaced, short palindromic repeats (CRISPR) – CRISPR-associated (Cas) system normally found in bacteria is a defense mechanism to silence foreign nucleic acids [84]. This bacterial defense mechanism has been adapted to create guide RNAs (gRNAs) that direct site-specific DNA cleavage by the Cas9 endonuclease in vivo. The site-specific gRNA is designed as 20 bp sequence which is complementary to genomic target sequence adjacent to protospacer adjacent motif (PAM) site of NGG [84]. The mixture of gRNA and Cas9 mRNA/protein is co-injected into one-cell stage embryos to generate gRNA-targeted DNA double strand breaks (DSBs) mediated by Cas9 cleavage enzyme. Then, DSBs are repaired via homology-directed repair (HDR) or non-homologous end-joining (NHEJ) and this repair mechanism generally results in insertions or deletions (indels) of variable length and thus frame shift or non-sense mutations [84], [85]. If these mutations are found in the germ lines, then they are transmitted to next generations and so stable mutant lines are generated.
1.5.3 Vivo-morpholino knockdown technology
Morpholino technology is a widely-used knockdown system in the zebrafish organism [86]. There are two main types of morpholinos; splice-blocking and translational-blocking morpholinos. Splice-blocking morpholinos are designed to target intron-exon junctions and inhibit the pre-mRNA processing [86]–[88]. However, translational-blocking morpholinos are designed to target against the
15
initiation codon of target mRNA to inhibit the translation of protein [86]–[88]. Vivo-morpholinos are designed to deliver into tissues rather than the embryos [89]. In order to deliver Vivo-morpholino to adult brain, cerebroventricular microinjection (CVMI) method has been developed [90], [91]. After a skull incision under anesthesia, Vivo-morpholino solution including cell tracker dye is injected by using a glass injection capillary at the incision site [91]. Then zebrafish recover in fresh water. At least 30 min later, the fluorescence signal is controlled under anesthesia [91]. The effect of morpholino is transient and lasts for at most 5 days [86], [87], [91].
1.6 Non-genetic interventions
Non-genetic interventions may also be utilized to investigate the cellular and molecular alterations during brain aging. One of the widely used non-genetic intervention is dietary ones including caloric restriction (CR) or overfeeding (OF) [79], [92]–[94]. Moreover, drug or inhibitor treatment is using to change molecular and cellular biology of organism [92], [95]–[97].
1.6.1 Dietary interventions
Non-genetic dietary interventions have impacts on the lifespan, healthspan and mindspan. For example, high calorie or high fat diet leads to age-related metabolic deteriorations including type-2 diabetes, cardiovascular diseases, accelerated brain aging and cognitive impairments [98]–[101]. Moreover, high caloric intake change the molecular and cellular mechanisms in the brain that may cause cognitive decline [98], [99], [102], [103]. On the contrary, caloric restriction (CR) is the only non-genetic intervention to extends the lifespan and healthspan
16
across multiple species [21], [104], [105]. The low caloric intake (CR) reduces the body fat and delays the onset of age-related metabolic diseases such as type-2 diabetes, cardiovascular diseases [106] and attenuates the cognitive decline with the subtle alterations in the synaptic proteins [10], [107], [108].
Importantly, few studies have investigated the impacts of high calorie intake, overfeeding (OF), and low calorie intake (CR) on the brain aging of zebrafish. For example, a publication indicated that 6 week high fat-fed young zebrafish have increased level of TrkB while decreased level of BDNF gene expression in the central nervous system [109]. Moreover, lifelong high calorie diet decreased the neurogenesis and declined the cognitive performance in 1 year old zebrafish as compared to ad libitum (AL)-fed 1 year old and even 3 year old fish [110]. In addition, CR diet has applied to this model organism previously in our laboratory [79], [92]. However, very few publications have applied these opposing dietary regimens, OF and CR, together in the same experimental conditions to unravel their diverse mechanisms with respect to brain aging. Thus, to the best of our knowledge, this present study is one of the few studies examined the impacts OF and CR diets together in terms of the expression of neuronal proteins as well as the gene expression of smurf2 and its interacting partners across lifespan.
1.6.2 Pharmacological interventions
The other important non-genetic intervention to alter aging profile is the drug/inhibitor treatment. Some of the chemicals mimic CR diet such as resveratrol and rapamycin or induce the apoptosis of senescent cells named as senolytic drugs
17
and thus these pharmacological compounds have anti-aging effects [111]. For example, resveratrol, an activator of SIRT1 and a CR mimetic, extends the lifespan of yeast [112] while it changes the health parameters and transcription profile in mouse tissues without extending the lifespan [113]. It has been shown that another CR mimetic, rapamycin, extends the lifespan in yeast, worms and mouse models through the activation of autophagy [111]. Moreover, the accumulation of senescent cells in tissues is the hallmark of aging and this negative effect may be reversed by senolytic compounds such as quercetin [111]. Another approach is to suppress the telomere attrition by using telomerase activators [111]. It was shown that a telomerase activator increases the healthspan in mice [114] and another telomerase activator compound has neuroprotective effects in SOD1 transgenic mouse [115]. Taken together, the pharmacological interventions could also be utilized to increase lifespan, healthspan and mindspan.
A HECT E3 ligase inhibitor, heclin, was identified over the past decade to inhibit specifically HECT-domain E3 ubiquitin ligases, Smurf2, Nedd4, and WWP1 [116]. Since the previously published studies indicated that Smurf2 expression increased during aging [35], [36], [39], it may imply that Smurf2 inhibition via heclin in the adult animals could lead to delayed aging profile. Recently, Redondo et al. demonstrated that hippocampal heclin injection improves the short-term memory, consolidation and retrieval based on the administration time [97]. Taken together, heclin administration to adult zebrafish may delay the onset of aging profile and age-related cognitive decline and should be investigated to unveil the roles of Smurf2 during aging.
18 1.7 Aims and Hypothesis
According to previous studies [35], [39], Smurf2 expression increases with age in brain and bone marrow. Also, Smurf2 upregulation leads to cellular senescence as a consequence of telomere shortening and it controls the genomic stability [31], [34]. Taken together, it is suggested that Smurf2 protein has important roles in the aging process. Although its expression is well-studied in cancer pathways, to the best of our knowledge, the current study is one of the first studies to investigate Smurf2 gene and protein expression with respect to genetic and non-genetic interventions across lifespan.
The first aim of this thesis was to investigate the Smurf2 protein and gene expression levels across lifespan and to analyze the gene expression levels of its interacting partners during aging in both whole brain and specific brain regions. It was hypothesized that Smurf2 protein expression levels would increase with advanced age and its interacting partners would be affected by this increase. The next purpose was to examine the impacts of Smurf2 alterations in response to genetic interventions including inducible knockin, stable knockout or transient knockdown. We hypothesized that upregulation of Smurf2 would accelerate the brain aging processes while its downregulation could delay the aging phenotypes. Lastly, it was aimed to investigate the effects of non-genetic interventions on the gene expression of
smurf2 and its interacting partners and the protein levels of the neuronal and
proliferation/senescence proteins. The hypothesis was that the opposing dietary regimens would have diverse impacts on the neuronal markers as well as on the levels
19
of Smurf2 and its interacting partners while the Smurf2 inhibition with drug treatment could alter the survival of embryos and the levels of its interacting partners.
20
CHAPTER 2
METHODS 2.1 Subjects2.1.1 Animals
All fish were raised and maintained in the zebrafish facility in Bilkent University Molecular Biology and Genetics Department, Ankara, Turkey. Zebrafish were kept on a 14-hour light-10-hour dark cycle at 27.50C. Fry fish were fed twice a day with fry dry food and once a day with small Artemia while adult fish were fed twice a day with dry food flakes and once a day with live food, Artemia, which is live food and a predatory source for the animals. The day before breeding, 6-8 pairs of wild-type (WT) fish were put into the breeding tanks in the afternoon as one pair, keeping the male and female separated with a separator. The next day, the separator was removed from the breeding tanks. After the eggs were fertilized, within 20 min, the embryos were collected into a petri dish and raised in E3 medium. All the birth dates were recorded and the fish with the same date of birth were kept together. All fish were maintained in the zebrafish facility.
In Chapter 3, to determine the gene and protein expression of Smurf2 in the adult brain, a total of 56 WT zebrafish were utilized. The distribution of zebrafish was young (6–8 months old) and old (29–35 months old) male and female animals. The age range of old group were determined according to Yu et al. [69] indicating that in zebrafish cognitive decline occurs between 24-36 months. The animal protocol for
21
this study was approved by the Bilkent University Local Animal Ethics Committee (HADYEK) with approval date Feb 21, 2018 and number 2018/5.
In Chapter 4, after the eggs were fertilized, within 20 min, the embryos were collected into a petri dish and then Tol2 transposase system or CRIPSR-Cas9 system was injected to one-cell stage embryos. The Tol2 transposase injected F0 generation was labeled as Tg(hsp70l:smurf2_EGFP) and CRISPR-Cas9 injected F0 generation was labeled as Tg(smurf2_e10). After Tg(hsp70l:smurf2_EGFP) F0 animals were grown to adulthood, they were bred with WT animals and embryos were collected for heat-shock application and at the end of the heat-shock application, they were examined under fluorescence microscope and then euthanized on ice. When the
Tg(smurf2_e10) F0 animals became sexually mature, they were bred with WT
animals to collect F1 embryos. Also, 8 adult Tg(smurf2_e10) fish were utilized to optimize the PCR-based genotyping methods. The animal protocol for this study was approved by the Bilkent University Local Animal Ethics Committee (HADYEK) with approval date Feb 21, 2018 and number 2018/5.
Also, in Chapter 4, Vivo-morpholino injections were applied to adult zebrafish. A total 54 of adult zebrafish were anesthetized with Tricaine and then injected with Vivo-morpholinos including Smurf2-specific morpholinos and standard control morpholinos by CVMI. After desired post injection time, the animals were euthanized on ice and their brain tissues were extracted for further analyses. The animal protocol for this study was approved by the Bilkent University Local Animal Ethics Committee (HADYEK) with approval date July 24, 2017 and number 2017/9.
22
In Chapter 5, the non-genetic feeding interventions were performed on a total of 86 zebrafish in both young and old ages. Age-matched male and female zebrafish were randomly assigned to the feeding tanks; ad-libitum (AL), overfeeding (OF) and caloric restriction (CR). The feeding interventions were give to 9 months old (young) and 20 months old (old) animals and lasted for 12 weeks. At the end of the 12 weeks of intervention, the experiment was finished and animals were sacrificed to determine the effects of age and diet on the zebrafish brain. Without deprivation from any dietary nutrient, the calorie intake was altered among the diet groups. AL groups were fed with 180 mg dry flake per day and with Artemia 3 times per week similar to usual daily feeding. However, OF groups were fed with 360 mg dry flake/day and with Artemia 2 times per day. CR groups were fed with Artemia once a week and with 90 mg dry flake per two days. The animal protocol for this study was approved by the Bilkent University Local Animal Ethics Committee (HADYEK) with the approval date: Sept 6, 2017, no: 2017/12.
In Chapter 5, a non-genetic drug treatment was applied to embryos starting from 6 hpf to at most 5 dpf. Each inhibitor solution and control solutions were applied to 10-12 embryos in 2 ml E3 medium and the embryos were maintained at 28oC incubator during treatment. The treatment was ended at 5 days of age (120 hpf).
2.1.2 Cell lines
The protein samples of MDA-MB-231, MCF7, and A172 cell lines were used for the validation of antibodies in the current study. The MDA-MB-231 cell line is a positive control for the anti-SMURF2 C-terminal (ab211746) antibody and the MCF7
23
cell line is a positive control for anti-SMURF2, 200–300 aa, (ab94483) antibody. The A172, a human brain glioblastoma cell line, was used as a brain-specific cell line. The MDA-MB-231 and MCF7 cell lines were kindly provided as pellets from Dr. Ali Gure‘s laboratory in Bilkent University.
2.2 Dissection of adult zebrafish brain
Adult female and male zebrafish (young and old) were euthanized in the ice water [117], [118]. Under the dissecting microscope, the head was separated from the body with a sharp blade and the eyes and optic nerve were separated carefully from the head. After cleaning of excessive tissues, the brain was removed from the skull as entirely intact. The weight of the brain was measured and recorded. The body weight and length of adult animals utilized in Chapter 5 were measured and recorded. For DNA, and RNA extraction, the whole brain or whole embryo was snap-frozen in liquid nitrogen and kept in -80oC. For protein isolation, the tissues were immediately homogenized in lysis buffer for experiments in Chapter 3. However, protein samples were extracted from snap-frozen brain tissues in Chapter 4 and 5.
For further experiments in Chapter 3, after the dissection of entire brain, three brain regions; telencephalon (Tel), the optic tectum (TeO) and, the cerebellum/medulla/spinal cord (Ce) were separated from each brain as shown in Figure 2.1 and the 3 microdissected pieces from each of the three animals in the same age group were pooled together for region-specific analysis. Tel region is including olfactory bulb and telencephalon while Ce region consists of cerebellum, medulla and spinal cord as an integrative center as defined in Wullimann et al., 1996 [71]. The
24
tissues were snap-frozen in liquid nitrogen and stored at -800C for further RNA isolation. To extract the proteins, fresh tissues were immediately homogenized in lysis buffer. For subcellular fractionation, dissected whole brains and three microdissected brain regions; Tel, TeO, and Ce, which were pooled, were lysed immediately.
Figure 2.1 Representation of the microdissection procedure. (A) Dorsal photograph of zebrafish brain, (B) schematic representation of brain regions. Tel: telencephalon and olfactory bulb, TeO: the optic tectum, Ce: the cerebellum/medulla/spinal cord. (Adapted from Näslund, 2014 [119])
2.3 Protein Isolation
2.3.1 Total protein isolation
Proteins from individual and pooled brains were homogenized with a 25-gauge, 2-mL syringe in lysis RIPA buffer (50 mM Tris, pH 8.0, 150 mM NaCl, 1% NP40, 0.1% SDS and protease inhibitor [Roche, 5892970001]), for which 60 μL was used per 1 mg of tissue. Homogenates were incubated on ice for 30 min with gentle mixing twice. After centrifuging at 13000 rpm for 20 min at +40C, supernatants were collected and aliquoted in clean tubes. The protein extraction from the cell lines was
25
performed in a similar manner for brain tissues as described above. The protein samples were stored at -800C.
To isolate total protein from the pooled embryos, they were homogenized in lysis RIPA buffer with a sonicator (UP 50H, Hielscher Ultrasonics GmbH, Teltow, Germany) in order to prevent the loss of sample that occurs with the use of a syringe during the protein extraction of pooled embryos. Homogenates were incubated on ice for 30 min with gentle mixing twice. After centrifuging at 13000 rpm for 20 min at +40C, supernatants were collected in a new tube. The protein samples were stored at -800C.
2.3.2 Subcellular protein isolation
Subcellular protein fractionation from individual and pooled brains was performed as described in Sezgin et al., (2017) with minor modifications. Whole brain tissues and pooled brain regions were homogenized in 500 μl lysis buffer (50 mM Tris pH 7.5, 150 mM NaCl, 1% Triton X-100, 10 mM NaF and protease inhibitor [Roche, 5892970001]) with Dounce homogenizer. Homogenates were incubated on ice for 10 min and centrifuged at 14000 rpm for 15 min at +4 0C. Supernatants including cytosolic fraction were collected into a new tube while the pellets including nuclear fraction were dissolved in 150 μl lysis RIPA buffer (50 mM Tris, pH 8.0, 150 mM NaCl, 1% NP40, 0.1% SDS and protease inhibitor [Roche, 5892970001]). Fractions were stored at -800C.