1
Electron-phonon interaction in bulk layered graphene and its oxide in the presence of
alcohols in a device: Equilibrium molecular doping
Sesha Vempati, *a Asli Celebioglu a,b and Tamer Uyar *a,b
a UNAM-Institute of Materials Science & Nanotechnology, Bilkent University, Ankara, 06800, Turkey b Institute of Materials Science & Nanotechnology, Bilkent University, Ankara, 06800, Turkey
SV: [email protected]; TU: [email protected] Supplemental Information
A
Glass V
Gr/GrO
Figure S1: Cartoon depicting the device structure employed to record IV-characteristics.
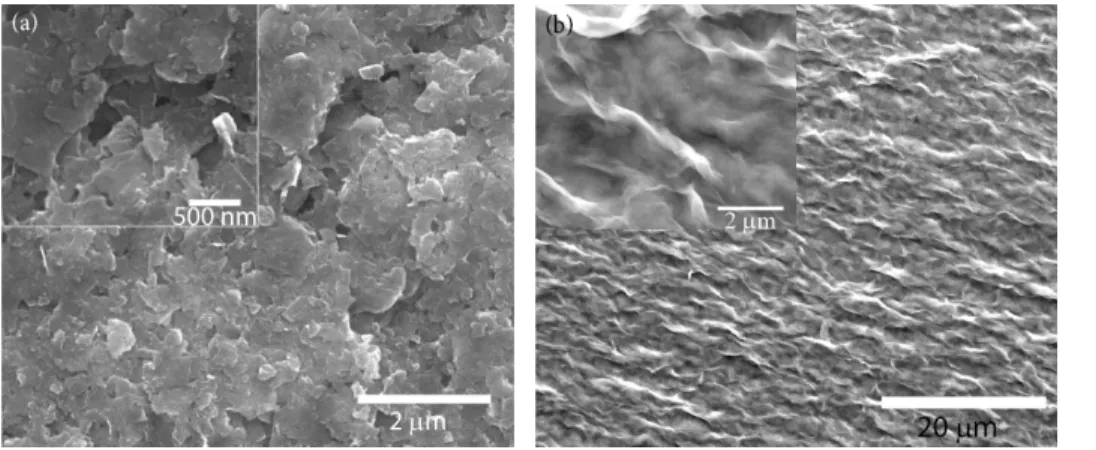
Figure S2: Scanning electron microscope images (a) showing flake like structure of graphite (Gr) and (b) graphite oxide (GrO). Insets show the morphology at higher magnification.
Figure S3: X-ray diffraction pattern from Gr in the presence of EtOH vapor. The peaks annotated with * originate from substrate. No shift of (002) peak is noticed indicating the unaltered interplanar spacing.
Electronic Supplementary Material (ESI) for Journal of Materials Chemistry C.
This journal is © The Royal Society of Chemistry 2014
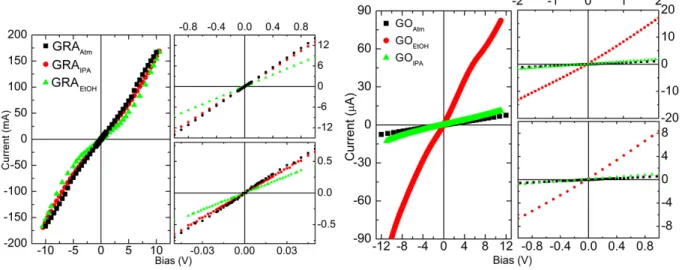
2 Figure S4: The IV- characteristics of the devices under three different environments for (left) Gr and (right) GrO. Parts of the figure indicate magnified region close to zero bias.
GRA- device GO-device
Environment
Resistance () ~ REtOH or IPA % Resistance () ~ REtOH or IPA %
Atmosphere (Atm) 0.074 k 1.601 M
Ethanol (EtOH) 0.116 k +56 132.9 k 92
Isopropanol (IPA) 0.077 k +4 1.099 M 31
Figure S5: Linear fit on the IV-characteristics are performed close to the zero bias and the resistance is employed in the following relation to quantify the changes
, where stands for the resistance of graphite in EtOH 𝑅𝐺𝑅𝐴/𝐺𝑂
𝐸𝑡𝑂𝐻/𝐼𝑃𝐴=
(
𝑅𝐸𝑡𝑂𝐻/𝐼𝑃𝐴𝐺𝑅𝐴/𝐺𝑂 ‒ 𝑅𝐺𝑅𝐴/𝐺𝑂𝐴𝑡𝑚)
∗ 100/ 𝑅𝐺𝑅𝐴/𝐺𝑂𝐴𝑡𝑚 𝑅𝐸𝑡𝑂𝐻𝐺𝑅𝐴environment. The other abbreviations follow similar logic. Upon exposure to ethanol or isopropanol the increase in the resistance is denoted by +sign while decrease is denoted by ve sign.
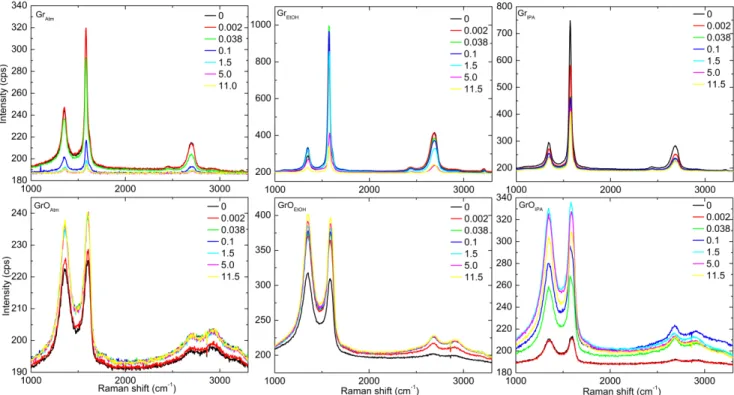
3 Figure S6: Raman spectra at different applied bias for Atm, EtOH and IPA cases. Top row shows spectra from Gr, while the bottom row shows spectra from GrO. Legend indicates the bias in V.
Figure S7: Ratio of intensities of 2D and G bands (A(2D)/A(G)) in Raman spectra at different applied bias for Atm, EtOH and IPA cases. 0V is manually assigned on the log scale.
4 Figure S8: (Color online) Raman intensities for three environments for two bias conditions. G band from (a) GRA, (b) GO; D band from (c) GRA and (d) GO. The spectra are normalized against the intensity at zero bias.