DOI 10.1007/s00296-015-3356-4
Rheumatology
INTERNATIONALORIGINAL ARTICLE - IMAGING
Association of real‑time sonoelastography findings with clinical
parameters in lateral epicondylitis
Figen Kocyigit1 · Ersin Kuyucu2 · Ali Kocyigit3 · Duygu Tuncer Herek3 · Raziye Savkin1 · Ummuhan Bas Aslan1 · Nevzat Karabulut3
Received: 3 July 2015 / Accepted: 28 August 2015 / Published online: 5 September 2015 © Springer-Verlag Berlin Heidelberg 2015
p = 0.001) and strain ratio (ICC = 0.61, p = 0.031). RTSE may facilitate differentiation between healthy and affected elbows as a feasible and practical supplementary method with substantial interobserver agreement. RTSE was supe-rior to B-mode ultrasound and color Doppler ultrasound in discriminating tendons with LE. Strain ratio of the medial portion of the tendon is associated moderately with noctur-nal pain and symptom duration. No other associations were present between RTSE findings and clinical or functional parameters.
Keywords Musculoskeletal disease · Elbow joint ·
Ultrasound · Quality of life
Introduction
Lateral epicondylitis (LE) is a common source of lateral elbow pain with an estimated prevalence of 1–3 % [1]. This overuse syndrome is associated with repetitive and/or forceful hand tasks and typically affects the dominant arm. Prevalence of LE increases to more than 50 % in tennis players, a population that uses regular repetitive hand func-tions [2]. The diagnosis is made clinically through history and physical examination [3]. Furthermore, magnetic res-onance imaging (MRI) and ultrasound (US) findings may provide information on differential diagnosis and disease severity [4, 5].
Ultrasound elasticity imaging is relatively new noninva-sive, ultrasound-based imaging method that provides infor-mation on the mechanical properties of tissues (stiffness and elasticity), reflecting their quality. There are two differ-ent types of ultrasound elasticity imaging: real-time strain elastography (RTSE) and shear-wave elastography (SWE). RTSE displays the subjective distribution of strain caused
Abstract The objective of this study was to investigate
the role of real-time sonoelastography (RTSE) in patients with lateral epicondylitis (LE) and whether it is associated with clinical parameters. Seventeen patients with unilateral LE were enrolled in the study. The healthy elbows of the participants constituted the control group. Using B-mode ultrasound, color Doppler ultrasound, and RTSE, we pro-spectively examined 34 common extensor tendon elbows of 17 patients. Both color scales and strain ratio were used for evaluating RTSE images. Two radiologists evaluated the RTSE images separately. Elbow pain was scored on a 100-mm visual analog scale (VAS). Symptom duration and the presence of nocturnal pain were questioned. Quick disabili-ties of arm shoulder and hand (DASH) Questionnaire was applied to assess the pain, function, and disability. Notting-ham health profile (NHP) was used to determine and quan-tify perceived health problems. Both color scales and strain ratios of the affected tendon portions were significantly dif-ferent from that of healthy tendons (p < 0.001). There was no significant association between NHP, VAS, Quick DASH scores, and color scales and strain ratio. Strain ratio of the medial portion of the affected tendon was significantly cor-related with symptom duration (rho = −0.61 p = 0.010) and nocturnal pain (rho = 0.522 p = 0.031). Interobserver agreement was substantial for color scales (κ = 0.74,
* Figen Kocyigit [email protected]
1 School of Physical Therapy and Rehabilitation, Pamukkale
University, 20070 Denizli, Turkey
2 Department of Orthopedics and Traumatology, Faculty
of Medicine, Medipol University, Istanbul, Turkey
3 Department of Radiology, Faculty of Medicine, Pamukkale
by tissue compression, whereas SWE measures the intrin-sic tissue elasticity using the acoustic push-pulse. Both RTSE and SWE have been used to evaluate different mus-culoskeletal disorders [6].
RTSE is based on the principle that tissue deforms due to the stress from the ultrasound transducer. Strain is defined as the amount of displacement from the probe. Strain dif-fers between tissues and lesions according to their elastic properties. Soft tissues deform more while stiff tissues deform less. Specific software systems convert the com-puted strain to color codes that represent different degrees of elasticity during RTSE. Lesions affecting the elasticity of tissue can be distinguished by RTSE as altered areas of stiffness [6].
RTSE is considered as a promising method to determine the stiffness of various musculoskeletal structures. It has been applied to patients with lateral epicondylitis in recent studies [7, 8]. De Zordo et al. [7] reported that RTSE find-ings were valuable in the detection of alterations in lateral epicondylitis. Ahn et al. [8] evaluated the feasibility of RTSE as an objective method for assessing patients with lateral epicondylitis. They reported significant strain ratio difference in patients with lateral epicondylitis. However, to the best of our knowledge, there is no prior study regard-ing the association between clinical parameters and RTSE findings.
The objective of our study is to assess the sonoelasto-graphic changes on the common extensor tendon in patients with lateral epicondylitis and investigate whether RTSE findings correlate with clinical parameters.
Materials and methods
The procedures followed in this study were in accordance with the ethical standards of Helsinki Declaration. The study was approved by the institutional ethics committee, and each patient gave written informed consent.
We performed power analysis for the sample size esti-mation. Setting type I error (α) at 0.01 and power of the test at 0.95, we calculated sample size appropriate to test the hypothesis and have confidence as 31. Number of elbows to ensure that final sample size is achieved was calculated to be 34 when the proportion of attrition is accepted as 10 %.
Subjects
Twenty-one patients who were presented to the insti-tutional outpatient clinic with a primary complaint of unilateral elbow pain were scrutinized for enrollment in the study to reach the estimated allocation number from January 2015 to April 2015. Two patients who had a history of corticosteroid injection to treat LE in
the previous 3 months were excluded. One patient with rheumatoid arthritis was also excluded. One patient did not come for the scheduled RTSE examination and was excluded. Finally, data of 34 elbows of 17 patients were analyzed. We used ultrasound, color Doppler ultra-sound, and RTSE to examine prospectively 34 common extensor tendons in both elbows of 17 patients. The healthy elbows of the participants constituted the con-trol group. The inclusion criteria for the involved elbow were unilateral elbow pain diagnosed as lateral epicon-dylitis according to physical examination findings, age between 18 and 65 years, and approval of inclusion in the study. The inclusion criteria for the healthy elbow were the absence of elbow pain, no limitation of elbow range of motion, and the absence of tenderness at lateral epicondyle. The exclusion criteria were history of pre-vious elbow fracture/surgery, history of corticosteroid injection for elbow pain, acquired or congenital elbow deformity, elbow osteoarthritis, inflammatory joint dis-ease, peripheral vascular disorder, corticosteroid or estrogen medication.
Patients were diagnosed as lateral epicondylitis if pal-pation of the common extensor origin and resisted wrist extension were painful [9]. A thorough physical and neu-rological examination was conducted to rule out other clinical conditions that can cause elbow pain. Elbow pain was evaluated on a 100-mm visual analog scale (VAS). We measured pressure pain threshold in kilograms, at the most tender soft tissue of the lateral epicondyle with pressure algometer (Wagner Pain Test™ Model FPK 40 Algometer, Wagner Instruments, Greenwich, CT, USA).
Quick DASH (disabilities of arm shoulder and hand) Questionnaire was applied to evaluate the pain, function, and disability. Quick DASH is an abbreviated version of the original DASH outcome measure. In comparison with the original 30 item DASH outcome measure, the Quick DASH only contains 11 items [10]. It is a questionnaire that measures the severity of symptoms, ability to complete tasks and absorb forces. Quick DASH tool uses a five-point Likert scale from which the patient can select an appropri-ate number corresponding to his/her severity level/function level [11]. The reliability and validity of a Turkish version of Quick DASH were reported in 2011 [12].
Nottingham health profile (NHP) is a self-administered questionnaire that is used to determine and quantify per-ceived health problems. It is divided into six subscales (sleep, mobility, energy, pain, emotional reactions, and social isolation) and consists of 38 items [13]. Validity and reliability of the Turkish version were documented in 2000 [14].
After these preliminary clinical and functional evalua-tions, B-mode US, color Doppler US, and RTSE examina-tions of both elbows were performed.
Ultrasound imaging
A high-resolution ultrasound device (Logiq E9, GE Health-care, Milwaukee, Wisconsin, USA) equipped with an elas-tography-compatible 9–15 MHz matrix linear probe was used to scan common extensor tendons of both elbows. All sonographic examinations were performed by the same radiologist (AK) who was blinded to the involved side of the patient.
All subjects were examined while seated and facing the examiner with both elbows in semiflexion. The probe was placed in the longitudinal plane over the lateral epicondyle along the common extensor tendon. The probe was posi-tioned parallel to the common extensor tendon to avoid anisotropy when performing the conventional US and to prevent tissue-shifting when performing RTSE. The entire tendon origin from the anterior edge to the posterior edge was scanned during ultrasound.
The common extensor tendinous origin from the lateral humeral epicondyle was examined in longitudinal and axial planes during B-mode US. Five ultrasound criteria were investigated on B-mode US: (1) echotexture, (2) intrasu-bstance tears, (3) presence of lateral collateral ligament (LCL) rupture, (4) swelling, and (5) calcification. We eval-uated echotexture by identifying areas of hypoechogenic-ity within the tendon. Discrete tears within the tendon were identified as focal areas of anechoic change, an anechoic area without intact fibers or hypoechoic planes of fibril discontinuity. A focal discontinuity of the echogenic band between the radius and lateral capitellum was defined as LCL tear that can be partial or full thickness. Swelling was defined as outward convexity of the tendon origin.
We used color Doppler US to evaluate intratendinous hyperemia. Intratendinous hyperemia was defined as a color-flow signal in the common extensor tendon origin, and color Doppler US settings were adjusted to maximize the sensitivity to low-velocity and low-volume blood flow (Fig. 1). The color Doppler US gain was optimized with an increase in gain until noise appeared, and the gain was then reduced slightly to suppress the noise as defined by Brei-dahl [15].
RTSE was performed focusing on the areas with abnor-mal findings on B-mode US. Tendinous abnorabnor-malities were divided into three sections: the anterior, middle, and posterior fibers as defined by Connell et al. [16]. At least three scans of each tendon third were performed. During RTSE examination, manual light compression and decom-pression of the common extensor tendon by the probe were performed attentively to achieve an optimal and consistent color coding shown on the sonography screen. The force applied to the tendon was adjusted appropriately according to the visual indicator seen on the US display. The visual indicator is a bar scale of 1–7 that showed optimal strain at
the region of interest. The radiologist evaluated the images having adequate compression when the bar scale was 5–7. Each RTSE scan was repeated by compression and relaxa-tion of the scan area several times (at least three compres-sion–decompression cycles) until the findings were con-firmed to be reproducible as defined by De Zordo et al. [17]. RTSE and B-mode US images were simultaneously displayed as a two-panel image. All the RTSE images were recorded by the ultrasound device digitally and also sent to the local picture archiving and communication system (PACS) for later evaluation and statistical analysis. RTSE images were evaluated 1 month later by two radiologists (AK and DTH) individually to investigate the interobserver agreement. Both radiologists had 10-year experience in ultrasound and 2-year experience in RTSE. The radiolo-gists were blinded to the involved side of the patient during evaluation. Both researchers evaluated the color scale and calculated strain ratios on recorded images.
For the qualitative color scaling, a visual grading in which the relative stiffness of the tissues ranged from red (soft) to blue (stiff) was used [18]. Blue color represented stiff areas. Green or green-yellow and red or orange-red colors represented moderately and severely softened areas, respectively.
Strain ratio was calculated using the ratio of the strain in the small circular region of interest (ROI) in the adjacent subcutaneous tissue (E2) to that of the target area (common extensor tendon [E1]). The selection of the reference ROI is a factor that can have a significant impact on the strain ratio measurements [19]. We selected the reference ROI at the subcutaneous fat tissue near the common extensor ten-don origin. Because the muscle was more distant from the target area, it was more likely to be influenced by uneven compression from the transducer, considering the curved surface of the lateral elbow. In contrast, the nearby fat was more likely to be compressed with the same strength and in the same direction as the target structure. We expected this method of ROI selection would compensate for une-ven compression provided by the operator in part. The mean strain ratio (E2/E1) was computed by the software. A higher strain ratio indicated decreased stiffness in the affected common extensor tendon (Figs. 1, 2).
Statistical analysis
Standard descriptive statistics was used to summarize char-acteristics of the participants including means and standard deviations (SD) of all continuous variables and counts and percentages for the categorical variables. A paired sample
t test was used to compare objective outcomes. We calcu-lated the area under the ROC curve for RTSE, B-mode US and color Doppler US findings. The area under the ROC curve was categorized as follows: <0.6: worthless, 0.0–0.7:
poor, 0.71–0.80: fair, 0.81–0.9: good, and 0.91–1: excel-lent [20]. Spearman correlation coefficient (rho) was used to compare color scaling and strain ratio with age, gender, symptom duration, VAS, and Quick DASH score. Cohen’s kappa (κ) coefficient was used to evaluate interobserver
agreement for color scaling of RTSE images. Interclass cor-relation coefficient (ICC) was used to assess interobserver agreement for the strain ratio measurements. Interobserver agreement was categorized as follows: 0–0.20, poor; 0.21– 0.40, fair; 0.41–0.60, moderate; 0.61–0.80, substantial;
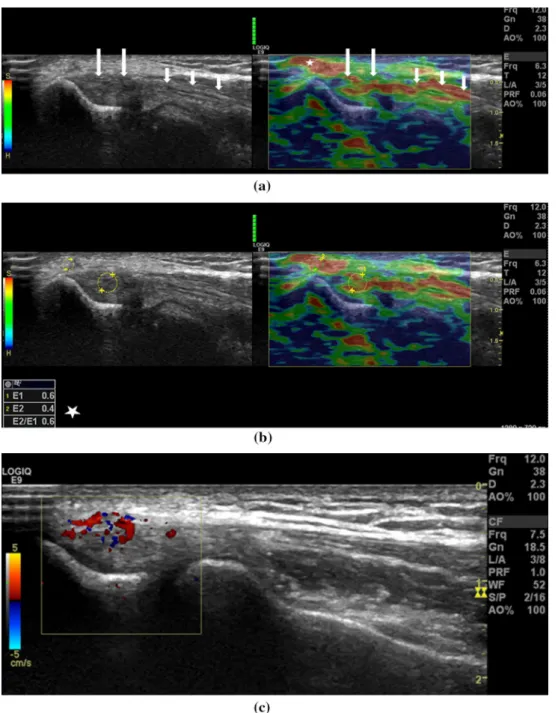
Fig. 1 a Thirty-six-year-old man with lateral elbow pain. On the left
side B-mode sonography image and on the right side elastography image seen together. Real-time sonoelastography shows focal red-coded areas (long arrows) in symptomatic common extensor tendon. Subcutaneous fat is coded red to bright green color (asterisk), and the distal portion of the tendon is in red to green color (short arrows). Artifacts are shown as red and green areas inside the bone and are present on all real-time sonoelastographic images. b The elasto-graphic ratio is also calculated by selection of two regions of interest
(ROIs) on elastography image. First ROI is placed on the tendon and includes red-coded area (marked as 1). Second ROI is placed on sub-cutis, above common extensor tendon as reference area (marked as 2). Mean elastographic ratio (E2/E1) is instantly computed and dis-played on the bottom left side of the screen (asterisk). In this symp-tomatic tendon, the mean elastographic ratio was 0.6. c Color Dop-pler sonography image demonstrates vascularisation of the common extensor tendon of the same patient
and 0.81–1.00, almost perfect [21]. A p value <0.05 was considered statistically significant. Statistical analysis was performed with SPSS software, release 21.0 (SPSS Inc., an IBM Company, and Chicago, IL, USA).
Results
Of the 17 participants, 10 were males (55 %) and 7 were females (44 %). The mean age was 47.8 ± 10.6 years (range 35–69 years). Other demographic parameters are shown in Table 1. The mean symptom duration was 89 ± 77 days (range 5–240 days).
The mean VAS for pain was 50 ± 23 mm (range 5–81 mm); the mean Quick DASH score was 33.2 ± 19.8 points (range 7.5–75). The mean NHP physical activity
score was 11.9 ± 11.7 (0–31.29), and the mean NHP total score was 150.06 ± 100.83 (12.01–333.32).
In healthy elbows, LCL involvement was detected in one elbow (5.9 %) as swelling. B-mode US findings and color Doppler US findings were in normal range. The overlying fascia was not involved in any of the healthy elbows. None of the elbows had calcification.
In elbows with lateral epicondylitis, 35.3 % (6/17) of tendon thirds were normal, 41.2 % (7/17) had one focal lesion, 17.6 % (2/17) had two focal lesions, and 5.9 % (1/17) had more than two focal lesions on B-mode US. Symptomatic LCL involvement was found in 29.4 % (5/17) of the elbows with lateral epicondylitis. The color Doppler US documented intratendinous hyperemia in 41.7 % (7/17) of the involved elbows. Calcification was present in 5.9 % (1/17) of the patients.
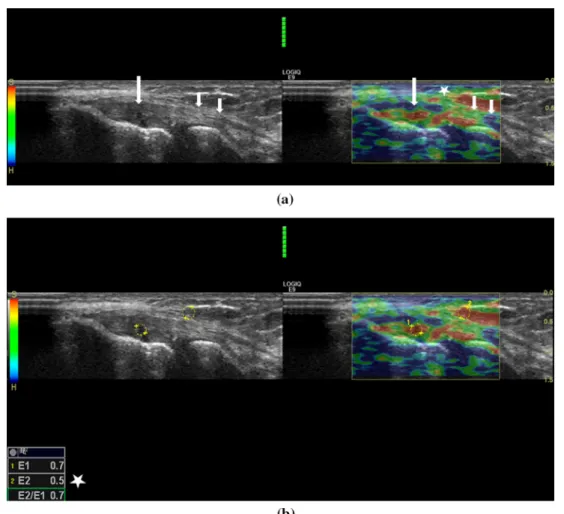
Fig. 2 a Forty-two-year-old woman with lateral elbow pain. On the
left side B-mode sonography image and the right side elastography image seen side by side. Real-time sonoelastography shows focal red-coded areas (long arrows) in symptomatic common extensor ten-don. Subcutaneous fat is coded red to bright green color (asterisk), and the distal portion of the tendon is in green to blue color (short arrows). Artifacts are shown as red and green areas inside the bone and are present on all real-time sonoelastographic images. b The
elas-tographic ratio is also calculated by selection of two regions of inter-est (ROIs) on elastography image. First ROI is placed on the tendon and includes red-coded area (marked as 1). Second ROI is placed on subcutis, above common extensor tendon as reference area (marked as 2). Mean elastographic ratio (E2/E1) is instantly computed and displayed on the bottom left the side of the screen (asterisk). In this symptomatic tendon, mean elastographic ratio was 0.7
In healthy elbows, RTSE showed stiff tendon structures, corresponding to blue coloring, in 74.5 % (39/51) of com-mon extensor tendon thirds (Fig. 3). Green or green-yellow color scaling was detected in 17.6 % (9/51), and red or orange-red colors were present in 5.8 % of the tendon sec-tions (3/51).
The area under an ROC curve quantifies the overall ability of the test to discriminate between those individu-als with the disease and those without the disease. The area under the ROC curve analysis was as follows: medial portion of tendon color scaling: 0.933 medial portion of tendon strain ratio: 0.917, middle portion of tendon color scaling: 0.903 middle portion of tendon strain ratio: 0.843 lateral portion of tendon color scaling: 0.884 lateral portion of tendon strain ratio: 0.863 B-mode US: 0.735 color Dop-pler US: 0.794.
The interobserver agreement was substantial for both color scaling (κ = 0.74, p = 0.001) and strain ratio (ICC = 0.61, p = 0.031) measurement. We used data reported by AK in statistical analysis. Green or green-yellow color scaling was detected in 15.7 % (8/51), and red or orange-red colors were present in 74.6 % of the tendon sections (39/51). At RTSE, the mean strain ratios in the affected elbow and healthy elbow are presented in Table 2. Statistical analysis of RTSE color scales
(p < 0.001) and strain ratios (p < 0.001) showed a signifi-cant difference between the involved and healthy elbows (Table 2).
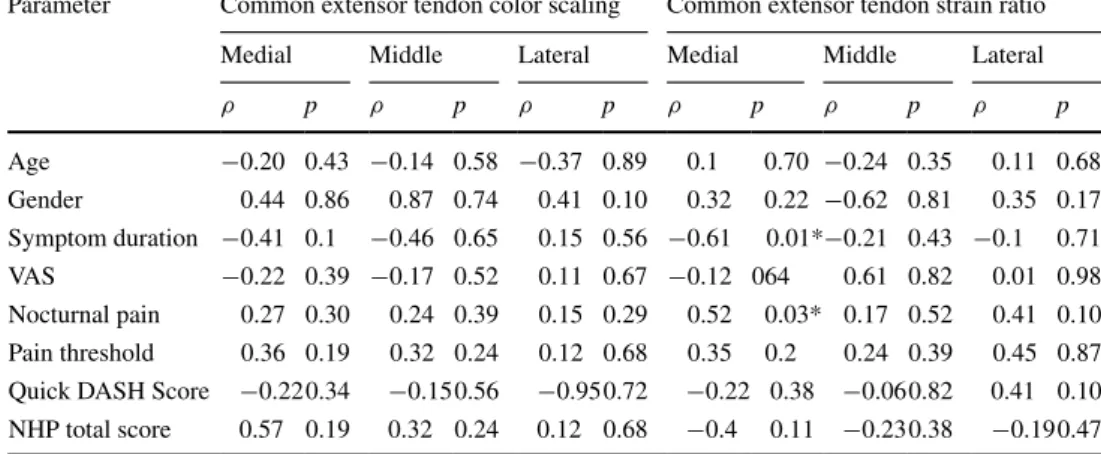
Regarding Spearman analysis for color scales and func-tional test scores, VAS, and nocturnal pain, no association between color scales and VAS, and Quick DASH score was found. When Spearman analysis for strain ratio and functional test score, VAS, and nocturnal pain was per-formed, there was a moderate association between strain ratio of medial portion of the extensor tendon and noctur-nal pain (rho = 0.522, p = 0.031) and symptom duration (rho = −0.61 p = 0.010) (Table 3).
Interobserver agreement for color scale evaluation was rated as substantial (κ = 0.74, p = 0.001). Interobserver agreement for strain ratio measurement was also rated as substantial (ICC = 0.61, p = 0.001).
Discussion
Our RTSE results show significantly decreased elasticity and increased strain ratios in elbows with lateral epicondy-litis compared to healthy elbows. Strain ratio of the medial compartment of common extensor tendon was significantly correlated with nocturnal pain and symptom duration in our study.
Lateral epicondylitis is the most commonly diagnosed tendinous elbow disorder with prevalence ranging from 1 to 3 % in the general population. However, the preva-lence can be as high as 40 % in tennis players. Anatomi-cally, the normal common extensor origin is composed of longitudinal fibrils bound closely, with the extensor carpi radialis brevis (ECRB) constituting most of the deep fibers and the extensor digitorum making up the superficial part. The accepted cause is tendon injury often secondary to minor and/or repetitive and even unrecognized trauma. This causes disruption of the internal structure of the tendon and degeneration of the cells and matrix, which ultimately leads to macroscopic tears and tendon failure.
Diagnosis of lateral epicondylitis is often made clini-cally, depending on the history and physical examina-tion findings [9]. When the symptoms are confounding or refractory, imaging is often used to confirm the diagnosis and exclude other entities [21]. MRI has been shown to be sensitive for tendon lesions; however, ultrasound, with superior spatial resolution, is increasingly used as an alter-native to MRI [16, 22, 23]. Ultrasound can also assess severity with a progression suggested from hypoechogenic-ity (representing fibroblastic degeneration) to intrasub-stance tears and partial-thickness tears.
Focal or diffuse areas of low echogenicity, increased thickness and outward bowing of the tendon, the presence of peri tendinous fluid, intratendinous calcifications, and
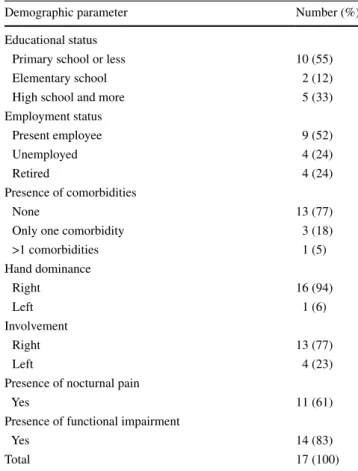
Table 1 Demographic and clinical parameters of the study group
Demographic parameter Number (%)
Educational status
Primary school or less 10 (55)
Elementary school 2 (12)
High school and more 5 (33)
Employment status Present employee 9 (52) Unemployed 4 (24) Retired 4 (24) Presence of comorbidities None 13 (77)
Only one comorbidity 3 (18)
>1 comorbidities 1 (5) Hand dominance Right 16 (94) Left 1 (6) Involvement Right 13 (77) Left 4 (23)
Presence of nocturnal pain
Yes 11 (61)
Presence of functional impairment
Yes 14 (83)
Fig. 3 a Forty-seven-year-old woman with a normal elbow. On the
left side B-mode sonography image and the right side elastography image seen together. Real-time sonoelastography shows blue to green color (long arrows) in normal common extensor tendon. Subcutane-ous fat is coded red to bright green color, and the distal portion of the tendon is in green to blue color (short arrows). Artifacts are shown as red and green areas inside the bone and are present on all real-time
sonoelastographic images. b The elastographic ratio is also calculated by selection of two regions of interest (ROIs) on elastography image. First, ROI is placed on the normal tendon (marked as 1). Second ROI is placed on subcutis, above common extensor tendon as refer-ence area (marked as 2). Mean elastographic ratio (E2/E1) is instantly computed and displayed on the bottom left side of the screen (aster-isk). In this normal tendon, the mean elastographic ratio was 0.1
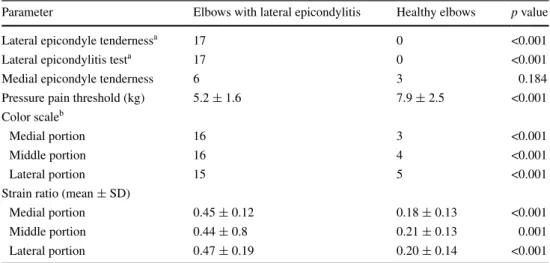
Table 2 Physical examination
and imaging findings of the involved and healthy elbow
SD Standard deviation
a Presented as number of patients with positive physical examination finding/test result b Presented as number of patients with affected color scale (green, yellow, red)
Parameter Elbows with lateral epicondylitis Healthy elbows p value
Lateral epicondyle tendernessa 17 0 <0.001
Lateral epicondylitis testa 17 0 <0.001
Medial epicondyle tenderness 6 3 0.184
Pressure pain threshold (kg) 5.2 ± 1.6 7.9 ± 2.5 <0.001
Color scaleb
Medial portion 16 3 <0.001
Middle portion 16 4 <0.001
Lateral portion 15 5 <0.001
Strain ratio (mean ± SD)
Medial portion 0.45 ± 0.12 0.18 ± 0.13 <0.001
Middle portion 0.44 ± 0.8 0.21 ± 0.13 0.001
adjacent bone irregularities, LCL tears have been reported as various sonographic findings in lateral epicondylitis [4,
16, 24]. In the current study, focal hypoechogenicity of the tendon was the most common finding, followed by swell-ing, with calcification being least frequent.
Khoury et al. [25] defined increased tendon compress-ibility indicative of tendon softening as a new sonographic sign of common extensor tendinopathy. In this regard, esti-mation of tissue softening can be a useful tool for char-acterization of an intratendinous pathologic finding such as tendinosis. De Zordo et al. [7] reported RTSE findings in lateral epicondylitis. Their results showed that RTSE facilitates differentiation between healthy and symptomatic extensor tendon origins with excellent sensitivity.
Elastography is the estimation of tissue strain. MRI and US can be used for elastography. RTSE produces rapid results in real time. Moreover, recent studies reported mod-erate to substantial interobserver agreement [8]. However, only the semiquantitative strain ratio can be measured, which requires a reference ROI. We used the subcutaneous tissue as a reference ROI in our study.
Qualitative color scaling or semiquantitative strain ratio can be used when interpreting RTSE findings, former being a more preferred method. Strain ratio values have been reported in various previous studies. Lyshchik et al. [26, 27] described the strain ratio of the thyroid gland to the tumor and the strain ratio of the neck muscle to a cervical lymph node. Drakonaki et al. [28] measured the strain ratio of the normal Achilles tendon using the Kager fat pad as a reference. Kocyigit et al. [29] reported increased strain ratio in a patient with plantar fasciitis. They suggested that sonoelastographic strain ratio may document the early structural changes that occurred in the affected tissue before findings can be detectable by con-ventional imaging in the early diagnosis of plantar fasciitis. Ahn et al. [8] used the subcutaneous fat tissue as a reference
in patients with lateral epicondylitis. However, instead of measuring the value on the selected static images, they meas-ured the temporally averaged strain ratio to decrease selection bias and time consumption for best-fit image selection. We evaluated RTSE images by using both color scaling and strain ratio measurement. We documented that both color scal-ing and the semiquantitative strain ratio reliably differentiate the affected elbows from healthy counterparts in lateral epi-condylitis. Furthermore, we conducted area under the ROC curve analysis. We documented that both color scaling and strain ratios of the investigated tendon parts were superior to B-mode US and color Doppler US findings in discriminating healthy from involved elbows in patients with LE.
The literature is scarce about the association of RTSE findings with clinical and functional scores. To the best of our knowledge, our study is the first to investigate this asso-ciation in patients with LE. We did not observe an associa-tion between color scales and funcassocia-tional test scores, VAS, and nocturnal pain. Strain ratio was not correlated with VAS and functional scores either. However, the presence of noc-turnal pain and symptom duration was moderately associated with strain ratio of the medial portion of the tendon. In clini-cal practice, the presence of nocturnal pain is accepted as a sign of severe involvement. The severity and chronicity of the disease seem to affect the stiffness of the tendon accord-ing to our results. The impairment in functional scores might not be associated with radiological findings as reported for disk herniation and osteoarthritis before [30, 31].
The strain ratios and color scales of medial, middle, and lateral tendon portions were similar in our study. However, strain ratio of a medial part of the common extensor ten-don was significantly correlated with symptom duration and nocturnal pain. Connell et al. [16] reported more com-mon involvement of medial part of the comcom-mon extensor tendon than lateral and middle portions. Despite the lack
Table 3 Correlation analysis
results between strain index, color scaling and clinical and demographic parameters
ρ, Spearman’s correlation coefficient; p, p value, VAS visual analog scale, DASH disabilities of arm shoul-der and hand, NHP Nottingham heath profile
* p < 0.05 was accepted statistically significant
Parameter Common extensor tendon color scaling Common extensor tendon strain ratio
Medial Middle Lateral Medial Middle Lateral
ρ p ρ p ρ p ρ p ρ p ρ p Age −0.20 0.43 −0.14 0.58 −0.37 0.89 0.1 0.70 −0.24 0.35 0.11 0.68 Gender 0.44 0.86 0.87 0.74 0.41 0.10 0.32 0.22 −0.62 0.81 0.35 0.17 Symptom duration −0.41 0.1 −0.46 0.65 0.15 0.56 −0.61 0.01*−0.21 0.43 −0.1 0.71 VAS −0.22 0.39 −0.17 0.52 0.11 0.67 −0.12 064 0.61 0.82 0.01 0.98 Nocturnal pain 0.27 0.30 0.24 0.39 0.15 0.29 0.52 0.03* 0.17 0.52 0.41 0.10 Pain threshold 0.36 0.19 0.32 0.24 0.12 0.68 0.35 0.2 0.24 0.39 0.45 0.87 Quick DASH Score −0.220.34 −0.150.56 −0.950.72 −0.22 0.38 −0.060.82 0.41 0.10 NHP total score 0.57 0.19 0.32 0.24 0.12 0.68 −0.4 0.11 −0.230.38 −0.190.47
of histopathologic studies investigating the involvement of different tendon portions in patients with LE, the medial part of the tendon might be the first affected part. This may be an explanation for the association of strain ratio of the medial portion and symptom duration.
RTSE is individually performed, usually by freehand technique. Moreover, even with the same elastographic image, variable interpretations are possible among per-formers because of ROI selection. The size and location of the selected ROIs may be inconsistent despite precautions for standard measurement [8]. Therefore, interobserver variability is inevitable, and many previous studies have described the situation as a limitation of RTSE. Recent pre-vious studies reported fair to moderate interobserver agree-ment for both color scaling and strain ratio measureagree-ment [8, 32]. We also detected substantial interobserver agree-ment for both color scaling and strain ratio calculation.
Acquisition of images by only one radiologist is a limitation of our study. However, it would be unethical to examine a painful patient twice with an imaging method lasting about 45 min. Therefore, one radiologist performed the examinations, and the recorded images were evaluated 1 month later separately by two radiologists.
In conclusion, our study revealed that strain ratio and color scaling are significantly different in affected elbows when compared to healthy counterparts. RTSE findings were superior to B-mode US and color Doppler US find-ings in discriminating healthy and involved elbows. Noc-turnal pain and symptom duration was correlated with the strain ratio of the medial portion of the tendon. No other associations were present between RTSE findings and clin-ical or functional parameters. Our results show that RTSE could be a feasible, simple and quick diagnostic method in patients with lateral epicondylitis with substantial interob-server agreement.
Compliance with ethical standards
No funding or grant or equipment was provided for the project from any source. The study was approved by Pamukkale University Non-invasive Research Ethical Committee. Study number: 60116787-020/1008. Each participant gave written informed consent.
Conflict of interest The authors declare that there are no conflicts
of interest.
References
1. Shiri R, Viikari-Juntura E, Varonen H, Heliövaara M (2006) Prevalence and determinants of lateral and medial epicondylitis: a population study. Am J Epidemiol 164:1065–1074
2. Field LD, Savoie FH (1998) Common elbow injuries in sport. Sports Med 26:193–205
3. Tosti R, Jennings J, Sewards JM (2013) Lateral epicondylitis of the elbow. Am J Med. doi:10.1016/j.amjmed.2012.09.018
4. Levin D, Nazarian LN, Miller TT, O’Kane PL, Feld RI, Parker L, McShane JM (2005) Lateral epicondylitis of the elbow: US findings. Radiology 237:230–234
5. Sampath SC, Sampath SC, Bredella M (2013) Magnetic reso-nance imaging of the elbow: a structured approach. Sports Health. doi:10.1177/1941738112467941
6. Ooi CC, Malliaras P, Schneider ME, Connell DA (2014) “Soft, hard, or just right?” Applications and limitations of axial-strain sonoelastography and shear-wave elastography in the assessment of tendon injuries. Skelet Radiol 43:1–12
7. De Zordo T, Lill SR, Fink C, Feuchtner GM, Jaschke W, Bell-mann-Weiler R, Klauser A (2009) Real-time sonoelastography of lateral epicondylitis: comparison of findings between patients and healthy volunteers. AJR. doi:10.2214/AJR.08.2020
8. Ahn KS, Kang CH, Hong SJ, Jeong WK (2014) Ultrasound elas-tography of lateral epicondylosis: clinical feasibility of quan-titative elastographic measurements. AJR Am J Roentgenol. doi:10.2214/AJR.13.11003
9. Clarke AW, Ahmad M, Curtis M, Connell DA (2010) Lat-eral elbow tendinopathy: correlation of ultrasound find-ings with pain and functional disability. Am J Sports Med. doi:10.1177/0363546509359066
10. Gummesson C, Ward MM, Atroshi I (2006) The shortened dis-abilities of the arm, shoulder and hand questionnaire (Quick DASH): validity and reliability based on responses within the full-length DASH. BMC Musculoskelet Disord 44:1–7
11. Imaeda T, Toh S, Wada T, Uchiyama S, Okinaga S, Kusunose K, Sawaizumi T (2006) Reliability of a visual analog version of the Quick DASH. J Bone Jt Surg Am 88:1782–1787
12. Koldas S, Ay S, Evcik D, Baser O (2011) Adaptation of Turkish version of the questionnaire quick disability of the arm, shoul-der, and hand (Quick DASH) in patients with carpal tunnel syn-drome. Clin Rheumatol. doi:10.1007/s10067-010-1470-y
13. The European group for quality of life assessment and health measurement (1993) European guide to the Nottingham Health Profile. Brookwood-Surrey Medical Publications, Brookwood, pp 1–16
14. Küçükdevecı AA, McKenna S, Kutlay S, Gürsel Y, Whalley D, Arasıl T (2000) The development and psychometric assessment of the Turkish version of the Nottingham Health Profile. Int J Rehabil Res 23:31–38
15. Breidahl WH, Newman JS, Taljanovic MS, Adler RS (1996) Power doppler sonography in the assessment of musculoskeletal fluid collections. AJR 166:1443–1446
16. Connell D, Burke F, Coombes P, McNealy S, Freeman D, Pryde D, Hoy G (2001) Sonographic examination of lateral epicondyli-tis. AJR 176:777–782
17. De Zordo T, Chhem R, Smekal V, Feuchtner G, Reindl M, Fink C, Faschingbauer R, Jaschke W, Klauser AS (2010) Real-time sonoelastography: findings in patients with symptomatic Achil-les tendons and comparison to healthy volunteers. Ultraschall Med. doi:10.1055/s-0028-1109809
18. Koçyiğit F, Koçyiğit A, Karabulut N (2015) Color scaling in sonoelastography. Am J Phys Med Rehabil. doi:10.1097/ PHM.0000000000000333
19. Havre RF, Waage JR, Gilja OH, Odegaard S, Nesje LB (2011) Real-time elastography: strain ratio measurements are influenced by the position of the reference area. Ultraschall Med. doi:10.10 55/s-0031-1273247
20. Karimollah HT (2013) Receiver operating characteristic (ROC) curve analysis for medical diagnostic test evaluation. Caspian J Intern Med 4:627–635
21. Landis JR, Koch GG (1977) The measurement of observer agreement for categorical data. Biometrics 33:159–174
22. Walz DM, Newman JS, Konin GP, Ross G (2010) Epicon-dylitis: pathogenesis, imaging, and treatment. Radiographics 30:167–184
23. Kotnis NA, Chiavaras MM, Harish S (2012) Lateral epi-condyli-tis and beyond: imaging of lateral elbow pain with clinical-radio-logic correlation. Skeletal Radiol 41:369–386
24. Miller TT, Shapiro MA, Schultz E, Kalish PE (2002) Compari-son of Compari-sonography and MRI for diagnosing epicondylitis. J Clin Ultrasound 30:193–202
25. Khoury V, Cardinal E (2009) “Tenomalacia”: a new sono-graphic sign of tendinopathy? Eur Radiol. doi:10.1007/ s00330-008-1112-9
26. Lyshchik A, Higashi T, Asato R, Tanaka S, Ito J, Mai JJ, Pellot-Barakat C, Insana MF, Brill AB, Saga T, Hiraoka M, Togashi K (2005) Thyroid gland tumor diagnosis at US elastography. Radi-ology 237:202–211
27. Lyshchik A, Higashi T, Asato R, Tanaka S, Ito J, Hiraoka M, Insana MF, Brill AB, Saga T, Togashi K (2007) Cervical lymph node metastases: diagnosis at sonoelastography—initial experi-ence. Radiology 243:258–267
28. Drakonaki EE, Allen GM, Wilson DJ (2009) Real-time ultra-sound elastography of the normal Achilles tendon: reproducibil-ity and pattern description. Clin Radiol 64:1196–1202
29. Kocyigit F, Kuyucu E, Kocyigit A, Karabulut N (2015) Sonoelas-tographic strain index in the early diagnosis of plantar fasciitis. Clin Imaing. doi:10.1016/j.clinimag.2015.06.004
30. Hunter DJ, Guermazi A, Roemer F, Zhang Y, Neogi T (2013) Structural correlates of pain in joints with osteoarthritis. Osteoar-thr Cartil 21:1170–1178
31. Steffens D, Hancock MJ, Maher CG, Williams C, Jensen TS, Latimer J (2014) Does magnetic resonance imaging pre-dict future low back pain? A systematic review. Eur J Pain 18:7557–7565
32. Havre RF, Elde E, Gilja OH, Odegaard S, Eide GE, Matre K, Nesje LB (2008) Freehand realtime elastography: impact of scanning parameters on image quality and in vitro intra- and interobserver validations. Ultrasound Med Biol 34:1638–1650