__________________________________________________________________________________
PressAcademia Procedia49
2nd World Conference on Technology, Innovation and Entrepreneurship,
May 12 - 14, 2017, Istanbul, Turkey.
Editted by Sefer Şener
A NOVEL BUSINESS MODEL FRAME FOR INNOVATIVE STARTUPS
DOI: 10.17261/Pressacademia.2016… Dante Jorge Dorantes-Gonzalez Department of Mechanical Engineering, Faculty of Engineering, MEF University, Ayazağa Cad. No.4, 34396 Maslak, Sarıyer, İstanbul, Turkey, [email protected]ABSTRACT
The business model canvas has been used in business and entrepreneurship to sketch and frame the key points behind the development of a startup, and it was meant to strategically analyze and develop startups or documenting existing businesses. The business model canvas describes the firm’s value proposition, partners, resources, activities, customer relationships, distribution channels, customers, revenue streams and cost structure. However, when it comes to innovative startups, this template does not explicitly include innovation measures, no problem/opportunity formulation, or even such a basic component of a business model, as the profit formula. The present paper proposes a novel business model frame to visually and concisely sketch, besides accurately state traditional business concepts, key innovation concepts that any startup should integrate to be a game-changer in a competitive market. This new model is based on a combination of key principles of the theory of inventive problem solving (TRIZ) applied to business and management, such as multi-screen analysis of value-conflict mapping, trends of ideality of business system evolution positioning, among others; but also intellectual property, disruptive strategies, and open innovation, as well as startup metrics to describe the business differentiation and attractiveness to potential investors, incubators and accelerators. Keywords: Business model, innovation, TRIZ, open innovation, intellectual property JEL Codes:1.
INTRODUCTION
For many accelerators such as Silicon Valley’s Y Combinator, in order to get into their support, they do not require a business plan; but investors are also increasingly becoming less interested in business plans (Altman, 2014). These professionals spend more time working on the business idea, on the product, and talking to users. For Bill Gross, the founder of Idealab, an incubator of inventions and businesses, the main five success factors across more than 200 companies are: Idea’s timing and readiness fort he clients (42%), team & execution talent (32%), the idea itself (28%), business model (24%), and funding (14%) (Oppong, 2015). Since the business model also includes the business idea itself, then the business model can be considered as the 52%. Therefore, the business model is a key component in the creation and justification of a startup, overcoming even the creation of a business plan, and the present paper is meant to enhance the business model with innovation aspects.
__________________________________________________________________________________
PressAcademia Procedia50
2. BUSINESS MODEL DEFINITION
2.1. The Business Model Concept
On one hand, a business model consists of three steps: 1) Success starts by thinking about the opportunity to satisfy a real customer who needs a job done. 2) Sketch how the company will fulfill the need at a profit. 3) Compare that model to an existing model to see how much we have to change it to capture the opportunity. On the other hand, a business model consists of four building blocks that create value of any business: Customer value proposition, profit formula, key resources, and key processes (Johnson et al., 2008):• Customer value proposition (CVP). This is the most important component, related to the way how to create value for customers, how to get an important job done (problem that needs a solution or need to be fulfilled). “The more important the job is to the customer the lower the level of customer satisfaction with current options for getting the job done, the better your solution is than existing alternatives at getting the job done and, the lower the price, the greater the customer value proposition”. Key questions to this point are: How important is the job to the customer? How perfectly does the offering fit the job? Does the offering eliminate one or some of the most common barriers keeping people from getting particular jobs done: Insufficient wealth, access, skills, or time? To this regard, Bevis (2014) recommends to entrepreneurs: Start with a business idea that not only fulfills specific customer needs, but has enough market demand. Identify your target audiences, understand what motivates them to act and learn how to grow long-term relationships with your customers. • Profit formula. How the company creates value for itself and to the customer. It consists of: 1) Revenue model (price per volume). 2) Cost structure (assets, direct, indirect costs; economies of scale). 3) Margin model (contribution from each transaction to achieve desired profits). 4) Resource velocity (how well resources (inventory, assets) should be utilized to support expected volume and achieve profits).
• Key resources. Only the key assets such as people, technology, products, facilities, equipment, information, channels, partnerships, and brand, that create value and competitive differentiation for the customer and the company, and the way how those elements interact. Develop an organization and management structure so your company is poised for growth, networking and learning from other successful entrepreneurs (Bevis, 2014).
• Key processes. This refers to the operational and managerial processes such as hiring, training, design, development, sourcing, manufacturing, marketing, budgeting, planning, sales, service, rules, metrics, and norms, that allow to deliver value in such a way that they can successfully increase in scale.
2.2. The Business Model Canvas and the Lean Canvas
To effectively map out business models, Alexander Osterwalder created the Business Model Canvas (Osterwalder, 2004), then, Ash Maurya generated the Lean Canvas (Maurya, 2010 & 2012). These schemes are the most important models that sketch the main business model concepts. Both focus on problems, top priorities, solutions, key metrics and competitive advantages, as well as capture the information of a traditional business plan in a single page.
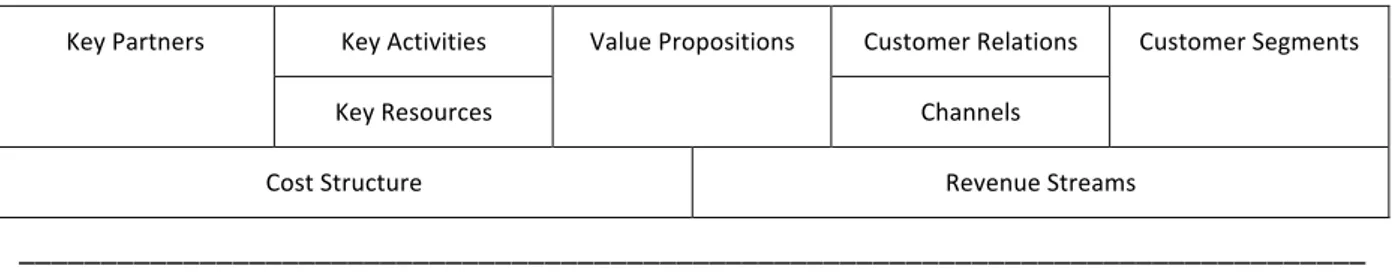
The Business Model Canvas is a single page model that includes the following items: Key partners, key activities, key resources, value propositions, customer relations, channels, customer segments, cost structure and revenue streams (Fig. 1).
Figure 1: The Business Model Canvas Frame
Key Partners Key Activities Value Propositions Customer Relations Customer Segments
Key Resources Channels
__________________________________________________________________________________
PressAcademia Procedia51
Unlike the Business Model Canvas, the Lean Canvas includes the “Unfair Advantage”, which means a quality that can’t be easily copied or bought; “Key Metrics” refers to the key activities; the rest of the items are similar to the ones of the Business Model Canvas (Fig. 2). The left half of the frame relates to the product, and the right half to the market. Figure 2: The Lean Canvas Frame
Problem Solution Unique Value
Propositions Unfair Advantage Customer Segments
Key Metrics Distribution Channels
Cost Structure Revenue streams
The advantages of both schemes are that after their completion, the riskiest parts of the business can be quickly identified, so that one can collecting data about those areas to test most fundamental aspects of the model, so to be able to return to the model and update it over and over based on new findings, and finally, help coming up with the key things that matter most (Merrill, 2015).
2. ENHANCING THE BUSINESS MODEL WITH INNOVATION
Being critical to the the Business Model Canvas and the Lean Canvas, both models do not refer to some important aspects of startups that usually matter to investors, incubators and accelerators (Dorantes-Gonzalez
et al., 2015) such as:
1. Open Innovation Approaches 2. Disruption Strategy
3. Startup Metrics
In the present paper, besides reafirming the previous three items in a frame based on the Business Model Canvas, to add:
1. A refinement of the statement of the unique value proposition
2. Introducing Theory of Inventive Problem Solving (TIPS or TRIZ in its Russian transliteration) tools.
2.1. Open Innovation Approaches
The benefits of open innovation were known even before the term Open Innovation was coined in 2003 (Steiner, 2014): Dupont’s TechnologyBank™ eased spreading its own technology licences to become industry standards; IBM’s Ventures in Collaboration program helped entrepreneurs to adopt its patented technology, as well as supplied its software in open source license with the interest of linking the enterprises to IBM technologies; Intel has relayed on the extensive use of external knowledge with universities, labs, and venture capital; Procter & Gamble opened internal research to outside participants to improve internal collaboration and to detect and adapt patented technologies from external actors, this way, doubling its rate of innovation success and decreasing costs.
Open innovation is “the use of purposive inflows and outflows of knowledge to accelerate internal innovation and to expand the markets for external use of innovation, respectively” (Chesbrough et al., 2006). Open innovation is usually contrasted with closed innovation, supposedly its predecessor, where companies generate their own innovation ideas, and then develop, build, market, distribute, service, finance, and support them on their own (Chesbrough, 2003).
Chesbrough enabled both academics and practitioners to rethink the design of innovation strategies in a networked world, coinciding with the current interest for outsourcing, core competences, collaboration, and
__________________________________________________________________________________
PressAcademia Procedia
52
the internet. He also connected the processes of acquiring external knowledge and exploiting internal knowledge externally by placing them both under the open innovation umbrella.
Open innovation comes in many forms based on the openness of both the process and the outcome of innovation as shown in Table 1 (Huizingh, 2011):
Table 1: Forms of Open and Closed Innovation
Closed innovation outcome
(proprietary intellectual property) Open innovation outcome (give away outcome for free)
Open innovation process (from external partners inputs or by externally exploiting an internally developed innovation)
Private open innovation (Huston and Sakkab, 2006)
Open source innovation (von Hippel, 2010)
Closed innovation process (available to others) In-house closed innovation
(Chesbrough, 2003) Public innovation (von Hippel and von Krogh, 2006)
2.2. Disruption Strategy
Regarding the disruption approaches, that often require business model change into an unknown market and business model territories, Johnson (2008) pointed out five strategies:
1. Democratize products in emerging markets at the “Bottom of the Pyramid”. Address through disruptive innovation the needs of large potential customer groups who are shut out of a market entirely because existing solutions are too expensive or complicated for them.
2. Capitalize on a brand-new technology by deploying a new business model around it or leverage a tested technology by bringing it to a whole new market.
3. Fulfilling an entirely unmet customer service where that does not yet exist, especially in markets where existing products tend to increase commoditization over time, by integrating its key processes and resources in a vastly more efficient way.
4. The need to fend off low-end disrupters, such as the Indian cheap car Nano threatening other automobile makers.
5. The need to respond to a shifting basis of competition over time, leading core market segments to commoditize, such as Hilti’s aproach turning products into a service: Rather than sell tools at lower and lower prices, sell a “just-the-tool-you-need-when-you-need-it, no-repair-or-storage-hassles” service.
Of course, this list is not comprehensive, but it can be extended to many other creative approaches.
2.3. Startup Metrics
When raising capital from investors, it is significant to demonstrate a quick and clear executive evaluation of the startup’s performance for the venture capitalists or stakeholders, since they just accept or reject the proposal without a clear understanding of the factors that influenced the decision. Metrics are very informative about the various dimensions of a startup's performance. Even though metrics are not usually sufficient to guarantee an outcome, they are necessary to successfully fundraise. At the end of the day, investors want to know why it is safer to invest in a product. A venture capital investor guide of the most important metrics analyzed when judging an early-stage startup is divided in five groups: financial, user, acquisition, sales, and marketing (Crichton, 2014).
1. Financial Metrics: Monthly Revenue Growth, Revenue Run Rate, Gross/Net Margins, Burn Rate and Runaway.
2. User Metrics: Daily Active Users / Monthly Active Users, K-value (virality), Proportion of Mobile Traffic, Cohort Analysis and Churn.
__________________________________________________________________________________
PressAcademia Procedia
53
3. User Acquisition and Marketing Metrics: Cost of Acquiring a Customer and Payback (paid and free channels), Net Promoter Score
4. Sales Metrics: Magic Number, Basket Size (Average Sales Price) and Order Velocity, Average Sales Cycle, Long Term Value. 5. Market Metrics: Total Addressable Market, Average Wallet Size. Table 2 shows a more detailed explanation and form of computation for these metrics. Table 2: Startup Metrics Financial metrics Computation Comments Monthly revenue growth
Take the current month’s revenue, subtract last month’s revenue, and then divide by last month’s revenue
It is used more by founders than venture capitalists. A growth rate of 40 percent per month is very good. A growth rate below 40 percent can be considered good if you can convince an investor that additional capital placed in sales and marketing will drive the growth rate higher
Revenue run rate
Take the revenues recognized in the most recent month and multiply by 1
VCs often talk about the current revenue run rate as well as the projected run rate in 12 months. For example, the company may be currently at a $2 million run rate, but will be $10 million by the end of the year. So when evaluating a startup, VCs are thinking about where the business has to be in 18–24 months when the next fundraise will happen
Gross/net margins
Gross margin is calculated as total revenue minus the “cost of goods sold” divided by the revenue. Net margin is similar, except we also subtract the total expenses of the business as well (except for taxes and a handful of other accounting line items)
Margins are important because they show the ability of your startup to spend venture capital and get significant return. Investigate what is the margin for your particular business. For example, services companies can reach margins of 90%, software businesses of 70%, and hardware companies often struggle to get above 40%. Margins become tighter when competition is greater, so successful businesses must develop strategies to avoid margin compression from new entrants, and lead startups to fail to receive funding
Burn rate and runaway
This is the operating loss per month. To calculate runway, take the amount of available capital and divide by the monthly burn rate to get the number of months until your start-up runs out of cash
These numbers show the efficiency of a business, the timeline for fundraising, and the need for capital. While startups are often run quite cheaply until their first fundraise, VCs will want to understand how you will increase your expenses to grow the business more quickly with any new infusion of capital. Lest anyone get the wrong impression, most investors expect their entire investment to be spent within 18–30 months. So if you’re asking for a fundraise of $10 million, but your monthly burn rate is $100,000, you must develop a very clear plan on how the burn rate is going to increase, and how that will propel the growth of the business
User metrics
Daily Active Users / Monthly Active Users
Are well-known metrics, but a couple of other metrics provide keen insight into a startup’s quality
K-value
(virality) Choose a time frame, such as one week. Take the number of users at the beginning of the week as a base. Now, track all invites that these users make to other people (for example, using an “Invite Your Friends” link). Aggregate the number of new users entering through this channel and then calculate the ratio of new users to old users and add 1. So, if you start with 1,000 users, and they bring on board 200 new users, we have a ratio of .2 + 1 (our base population) and that leads to a k-value of 1.2
The k-value is a measure of virality, and is borrowed from epidemiological studies of disease progression. This number is exponential, and defines the magnitude of the user growth rate by word of mouth (as opposed to paid acquisition). For social media startups, this is often the only metric that matters (the other is retention). A value less than 1 means that the population is dying and will cease to exist. A value of 1 means that the population is stable. A value of 1.2 is strong, and a value of over 1.4 means incredible growth. If you start with 1,000 users and have a k-value of 1.2 per week, after 30 weeks you will have about 200,000 users. But if you have a k-value of 1.4, you will have more than 17 million users within the same period. Growing at such a speed usually doesn’t last long, since old users are not as likely as new ones to bring additional users to the product (they already invited everyone!). However, some companies like Facebook and Snapchat have exhibited extremely high growth like this for an extended period of time, so it is certainly possible
Proportion of Mobile Traffic
Take the number of visits from mobile and divide by the total number of visits to your product
This is a simple ratio, but an important one in a world where more and more of our time is spent on mobile. Nearly every company that targets consumers and talks to an investor today will have to discuss their mobile strategy. Data today shows that people are potentially spending a majority of their computer usage on mobile devices. Engaging such users is crucial today
Cohort Analysis and Churn
Take all of the users who joined a product in a given time frame (usually a week). Then calculate how many of these users engaged
Cohort analysis is a metric by which we see the decay in user engagement. Users leave even the stickiest products for any number of reasons. For instance, small and medium businesses may leave your product because they are shutting down operation. VCs really like to see cohort-analysis tables, because they give us a
__________________________________________________________________________________
PressAcademia Procedia
54
with the product over every successive week. Churn is slightly different and is calculated by taking the number of users who leave and dividing by the number of total users (regardless of start time)
perspective on when users are leaving the platform.
First-week retention is probably the most immediately interesting number. For social media, 80 percent one-week churn is very high, 40 percent is good, and only 20 percent is phenomenal. For paid products like SaaS, churn and other conversion metrics tend to make more impact here rather than pure cohort analysis. SaaS churn in the low single digits (1–3 percent) is strong.
Seasonality can be an important component to elucidating cohort analysis. Education startups often see their users return at the beginning of the school year as people think through their software choices. Be sure your story includes all facets of your cohort analysis
User acquisition and marketing metrics
Cost of Acquiring a Customer and Payback (paid and free channels)
Take the amount spent on all forms of user acquisition (search
engine marketing, content
marketing, public relations, etc.) and divide by the number of new users within a given period. Thus, if we spent a total of $100,000 acquiring users, and we have 100 new users, we just paid $1000 per user (fully-blended)
Free acquisition is what it sounds like – someone started using a product without seeing an advertisement, perhaps through word of mouth, or maybe reading about it in the press. In contrast, paid acquisition is generally synonymous with advertising. If you spend $60 on Google AdWords and get one customer, you had a CAC of $60. We often express the number of free versus paid acquisitions as a ratio, since this can show if the growth of the user base is primarily organic. In general, the higher the average revenue per user (ARPU), the higher the cost of acquiring a customer can be. In social media, this number needs to be as low as possible (and can be near zero if growth is purely viral). In e-commerce, great CAC prices are around $30–$60 per user. Acquisition prices above that are not uncommon, but they do require more diligence. Prices above $200 are pretty rare in successful online businesses. Then again, financial services often have CACs in the upper hundreds, so, as always, there are exceptions
Net promoter score
Run a survey among your customers asking how likely it is that they will recommend (i.e. promote) your product to other people on a 1 to 10 scale. Promoters are those who give an answer of 9 or 10, and detractors are those that respond with a 1 or 2. Calculate the proportion of both groups as a total of the
survey population. The net
promoter score is the proportion of promoters minus the proportion of detractors. Thus, if 50 percent of your customers are promoters and 10 percent are detractors, your net score is 40
This is one of my favorite metrics. It shows how satisfied your customers are
with your product and your overall experience. NPSs of 50 are considered
excellent, and companies like Amazon and Google generally hover around such numbers. However, scores as high as 80 or even 90 are possible. Businesses that inculcate such fervency in its customers are highly valuable, and should raise capital easily
Sales metrics
Magic number Take the net growth of subscription revenue over two quarters, multiply by 4, and then divide by the total spend on sales and marketing. So if in Q1 we had $200,000 in subscription revenue, and in Q2 we have $400,000, and we spent $300,000 in sales and marketing in Q1, we would have
$400,000-$200,000, which is
$200,000 net growth, multiplying by 4, we have $800,000, and dividing by our expenses, we have a ratio of 2.66
This is arguably the best-named metric here, and a favorite of Scale Venture Partners, which popularized it. Essentially what this metric calculates is our return
on investment of spending a dollar on sales and marketing. For each dollar we
spend, we get the magic number back in additional revenue. A magic number above 1 means that a company has found a way to scale sales and marketing to build sustainable profit growth. A number below 1 isn’t necessarily terrible, but it also means that the company is not scaling as efficiently as other companies
Basket Size (Average Sales Price) and Order Velocity
The average sales price (ASP) is the price of a typical order. Order velocity is the time it takes for a customer to make a repeat purchase
For e-commerce businesses, these are among the most important metrics to calculate. ASP often drives the rest of a startup’s fundamentals, and so like run rate, acts as a clustering algorithm to quickly assess a startup’s business model for VCs. A high ASP generally means wealthier customers, fewer repeat purchases, more flexibility on the cost of acquiring a customer, etc. Order velocity also is influenced by ASP. For instance, Uber is a low ASP, high-velocity e-commerce business, whereas One Kings Lane tends toward a high ASP but low-velocity business. There is no “best” answer regarding these metrics, but generally, the lower the ASP, the higher the velocity of sales needs to be to compensate
Average Sales Cycle
Take the date that a customer is first contacted, and then the date that they make their first purchase. The difference is the
Like ASP, the average sales cycle often determines a lot of the fundamentals of a startup’s business, and therefore tells us about how to think about a company rather than its performance. We tend to use average sales cycle for enterprise and subscription sales, whereas we use order velocity for e-commerce and other
__________________________________________________________________________________
PressAcademia Procedia
55
sales cycle. Average across all customers
repeatable purchases. Sales to government and education institutions generally have the longest cycles, possibly two years or even longer. Sales to Fortune 500 businesses are shorter, generally 6–18 months depending on the product (for instance, software is easier to purchase than storage infrastructure). Converting a customer in a freemium model can take 18 months or more, but generally a cycle below one year is good
Long Term Value
This is the total value of a customer over the life of that customer’s relationship with the company
This metric is really well-known, so I won’t cover it in-depth. It works hand-in-hand with churn, since the length of the relationship is inversely proportional to the churn. Calculating this value tends to be really hard, and getting to a number that is actually comparable across companies is challenging. VCs often have to substitute more objective metrics like ASP to get to values that are more easily measurable. Nonetheless, this number is crucially important, particularly as a company scales for the long-term
Market metrics
Total Addressable Market
This is the total amount of money
spent in a startup’s defined space While incredibly important, there is a huge amount of fuzziness in any sort of market analysis. Startups may want to define themselves a certain way, and venture capitalists may have an entirely different market in mind when they analyze a startup. Generally speaking, markets greater than $1 billion are good, and any market definition that uses the word “trillion” is likely to get a laugh from a venture capitalist. Often, describing the TAM is more an opportunity for a founder to demonstrate an understanding of their startup’s market than it is about actually getting a quantitative figure
Average Wallet Size
This is a key metric for a lot of businesses, particularly enterprise companies. Average wallet size is the total amount that a single customer can spend in a given period of time for a category of services (i.e. its budget). This metric is important because it gives a sense of the financial capabilities of your customers, and it allows a VC to judge how expensive your product is relative to a customer’s appetite. This number cuts both ways. Startups that charge small amounts compared to the average wallet size are just as risky as those that charge a very high proportion of the wallet size as their product’s price. You don’t generally want to be insignificant, nor do you want to be so large that you knock out an entire budget
2.4. Further Improvement of the Unique Value Proposition
The unique value proposition is a differentiating factor that would compel a prospect to choose a specific company over a competitor. This item is central, and it is insufficiently stated. Some tips for identifying a unique value proposition and for standing out in a competitive market were pointed out by Lord (2014): 1. Critical focus and features. Why it’s so critical for the prospects, and how focused the company is on this. 2. Partnerships and platform integrations. Show off how convenient and powerful a platform is when
integrated with other products of value to prospects. 3. Customer service. If competitors are standing on low prices as their unique value proposition, invest in a customer-service team, which can be a great way to stand out. 4. Design, user interface and user experience. Make the experience of discovery, comparison, decision, easy use and understanding, and ongoing user experience stunning. People are willing to pay for quality and a beautiful design. 5. Focus on the “why” of the Golden Circle Theory. His premise is based on that the best companies focus on “why” they do what they do, getting at the heart of introducing prospects to the core values and motivations for building this product and sharing it with the world. Innovative enterprises think and act by communicating from inside out, by explaining what their beliefs, purpose, inspiration and cause are; hence inspiring, building trust, loyalty, so justifying why we should care (Sinek, 2014). For Sinek, “Why” means “what is your purpose and believe? Why does your organization exist? Why should everybody care? Why is what we trust, are loyal to, our cause, purpose and believe in challenging the status quo (Murphy, 2013). 6. Spin your price in your favor. If you cost more, then it costs more because it comes with account
management, development cost, scales better, more reliable, or better customer service? Whatever the reason, put it front and center and explain that price delta.
__________________________________________________________________________________
PressAcademia Procedia
56
2.5. Applying Theory of Inventive Problem Solving’s Tools to Business Model Definition
The Theory of Inventive Problem Solving (TIPS or, from Russian, TRIZ-Teoriya Resheniya Izobretatelskikh Zadach) is becoming one of the leading practices at large and small industrial companies in the world to support innovation and intellectual property by solving inventive problems and generate breakthrough ideas. In its origins, TRIZ was created for technical systems (Altshuller, 1988), however, it has been successfully applied in arts (Murashkovsky, 2007), advertisement (Vikentiev, 2007), social problems (Altshuller, 1994), business and management (Souchkov, 1998; Mann, 1999). Even though TRIZ has been used specifically for business model innovation (Ishida, 2003; Gomila, 2009), both papers dealt with a vague definition of a business model. Only Souchkov (2010) has proposed a more structured approach based on business modelling: • Ideality/Value formula in Business Models. 𝐷𝑒𝑔𝑟𝑒𝑒 𝑜𝑓 𝐼𝑑𝑒𝑎𝑙𝑖𝑡𝑦 =𝑉𝑎𝑙𝑢𝑒 𝐶𝑟𝑒𝑎𝑡𝑜𝑟𝑠 𝑜𝑓 𝑡ℎ𝑒 𝑉𝑎𝑙𝑢𝑒 𝑃𝑟𝑜𝑝𝑜𝑠𝑖𝑡𝑖𝑜𝑛 − 𝑉𝑎𝑙𝑢𝑒 𝑅𝑒𝑑𝑢𝑐𝑒𝑟𝑠 𝐶𝑜𝑠𝑡𝑠 The higher the degree of Ideality of a specific Value Proposition within a certain market segment is, the more competitive this Value Proposition will be.
• Contradictions and Value-Conflict Mapping. These are contraditions between growing market and customer demands that impose limits on value propositions. TRIZ provides a number of tools to help overcoming identified contradictions and the psychological inertia by using the available resources of time, space, material, energy, structure, supersystem, and so forth. Such tools are: o Root Conflict Analysis, RCA, (Souchkov, 2007) o TRIZ-based Function Analysis (Mann, 2004; Souchkov, 2009) o Multi-Screen or the 9-window Analysis to get a "big picture" of key driving contradictions across several system levels (Souchkov, 2009) o Special version of the Contradiction Matrix and 40 Inventive Principles developed for business and management applications (Mann, 2004) o 7 generic principles of conflicts elimination (Souchkov, 2009) o The adapted version of Inventive Standards and the Trends of Business Systems Evolution can be used for more complex cases (Souchkov, 2009) • Trends of Business Systems Evolution. Some trends of business evolution can be applied to building block of a business model, such as the Trend of Increasing the Degree of Dynamics, while some other trends address more specific building blocks, such as the trend of Customer Purchase Focus Evolution, addressing the Value Proposition and Revenue Streams (Mann, 2004; Souchkov, 2009). • Building Block Patterns. Each building block has its own content, depending on the type of business, product, service etc. At the same time, each building block can include generic patterns which can be reused across different business domains. For instance, in (Osterwalder, Pigneur, 2010) the following patterns are identified for the "customer relationship" building block: Personal assistance, dedicated personal assistance, self-service, automated service, communities, co-creation.
As a contribution to the application of TRIZ in Business Model, the author also recommends to use the following TRIZ tools: • Ideal Final Result • Dynamization and Adaptivity Increase • Trend of Functionality Increase İn the following section, these key aspects will be integrated in the design of a new business model frame.
3. DESİGN OF A NEW BUSİNESS MODEL FRAME
On the basis of the business model canvas, aforementioned topics can be integrated into it. The new proposals are heighlited in red color in Fig. 3. This frame represents an improvement to the frame presented in (Dorantes-Gonzalez, 2015).
__________________________________________________________________________________
PressAcademia Procedia57
Figure 3: The Proposed Business Model Frame • Key Partners • Crowdsource • Intellectual Property (IP) Policy • Type of Open Innovation • Product formulation and inventive problem solving: • Situation Analysis (needs, demands, expectations of business owners/executives) • Problem/opportunity/constraint formulation • Ideality/Value formula • TRIZ Function Value Analysis • Multi-Screen or the 9 window Analysis of Value-Conflict Mapping • Contradiction Matrix and 40 Inventive Principles for business & managt. • 7 generic principles of conflicts elimination • Inventive Standards and Trends of ideality of business system evolution • Dynamization and Adaptivity Increase • Trend of Functionality Increase • Ideal Final Result • Value Propositions • Critical focus and features • Partnerships and platform integrations • Customer service • Design, user interface and user experience • Focus on the “why” of the Golden Circle Theory • Spin the price in our favor • Others • Customer Relations • User Experience Feedback • User Metrics: Daily Active Users / Monthly Active Users, K-value (virality), Proportion of Mobile Traffic, Cohort Analysis and Churn • Customer Segments • Market Metrics: Total Addressable Market, Average Wallet Size
• Key Activities • Dısruptıon strategy: • Democratize products in at the Bottom of the Pyramid • New business model around a new technology or tested technology on a new market • Fulfilling an unmet customer service where that does not yet exist • Fend off low-end disrupters • Leading core market segments to commoditize (turning products into a service) • Others • Distribution Channels • Sales & Marketing Strategies • Sales Metrics: Magic Number, Basket Size (Average Sales Price) and Order Velocity, Average Sales Cycle, Long Term Value • User Acquisition and Marketing Metrics: Cost of Acquiring a Customer and Payback (paid and free channels), Net Promoter Score • Key Resources • IP policies for own patents Cost Structure • Revenue Streams • Profit Formula • IP Policy benefits • Financial Metrics: Monthly Revenue Growth, Revenue Run Rate, Gross/Net Margins, Burn Rate and Runaway
There are two new building blocks created within this frame related to “Product formulation and inventive problem solving” and “Disruption Strategy”, which is shaded in red color. Besides, new key items were added to most of the building blocks to enhace the frame.
__________________________________________________________________________________
PressAcademia Procedia
58
The entrepreneur designing his/her own startup should be able to justify if not all, most of the items to be able to demonstrate the idea strengths. And regarding both building blocks “Product Formulation and Inventive Problem Solving” and “Product formulation and inventive problem solving”, certain training should be necessary to fiil in these blanks. But the learning is worthwhile.
4. CONCLUSION
Current business model frames such as the Business Model Canvas and the Lean Canvas do not address aspects of open innovation, problem definition, innovative problem solving, business metrics and disruptive strategies; therefore, a novel business model frame is introduced to cover these aspects. This new frame is addressed to startup entrepreneurs, incubators, accelerators and investors interested in supporting these new companies. Besides Open Innovation Approaches, Disruption Strategy, Startup Metrics, the new business model frame adds a refinement of the statement of the unique value proposition, and introduces tools of the Theory of Inventive Problem Solving.The entrepreneur designing his/her own startup should be able to justify if not all, most of the items to be able to demonstrate the idea strengths. And regarding both building blocks “Product Formulation and Inventive Problem Solving” and “Product formulation and inventive problem solving”, certain training should be necessary to fiil in these blanks. But the learning is worthwhile.