INVESTIGATION OF SPATIAL ACCURACY OF HIGH-RESOLUTION (50cm) WORLDVIEW-2 SATALLITE IMAGES
1Ömer MUTLUOĞLU, 2Murat YAKAR, 3Hacı Murat YILMAZ
1 School of Technical Science, Architecture and Urban Planning, Selcuk University, Konya, Turkey
1Selcuk University, Engineering Faculty, Department of Geomatics Engineering, Konya, Turkey,
3Aksaray University, Engineering Faculty, Geodesy and Photogrammetry Department, Aksaray, Turkey
1[email protected],2[email protected], 3[email protected]
(Geliş/Received: 22.08.2016; Kabul/Accepted in Revised Form: 25.10.2016)
ABSTRACT: Nowadays, Very High Resolution Satellite (VHRS) images have been used for many
applications intensively. Using of the digital satellite images in relevant approaches may give more accurate ideas about the researched fields. Besides, different methods could be used for geospatial informations from relevant digital data in many disciplines. The most importance reason of using the maps, which are derived from VHRS images, is accuracy of data. To obtain maps from VHRS images or use VHRS images as map, the VHRS images require rectification. For an accurate rectification process, Ground Control Points (GCPs) must be marked in the field. In this study, spatial accuracy of the stereo WorldView-2 satellite image (0.5 m resolution) was investigated at a test area. For this, 31 GCP points were established. These points were used as controls and check point. Block adjustment was made using a different number of control and check points. The impact of the number of control points upon the adjustment results was also investigated. As a result of adjustment using a 5-point control and 26 check points; root mean square error in the 53 cm x direction, 17 cm y direction, 63 cm in z-direction for control points have been obtained. For check points, 55 cm x direction, 26 cm y direction and z direction 65 cm root mean square error were found. Also coordinates obtained from the stereo model and the field determined by the geodetic methods coordinates of points were compared. The average position error of a point is 48 cm according to comparison results.
Key Words: WorldView-2, Ground control point, Check Point, Rectification, Resolution, VHRS
WORLDVIEW-2 ( 50 cm ) Uydu Görüntüsünün Konumsal Doğruluğunun Araştırılması ÖZ: Günümüzde çok yüksek çözünürlüklü uydu görüntüleri pek çok uygulamada yoğun bir şekilde
kullanılmaktadır. Amaca uygun yaklaşımlarla sayısal uydu görüntüleri kullanımı, araştırılan alan hakkında çok doğru fikirler verebilir. Bunlara ilave olarak, birçok disiplin konumsal bilgi için ilgili sayısal verleri kullanmada farklı yöntemler kullanabilir. Yüksek çözünürlüklü uydu görüntülerinden üretilen haritaların kullanılmasının en önemli sebebi verinin doğruluğudur. Yüksek çözünürlüklü uydu görüntülerinden haritaları elde etmek ya da yüksek çözünürlüklü uydu görüntülerini harita gibi kullanmak için yüksek çözünürlüklü uydu görüntüleri düzeltme gerektirir. Doğru düzeltme işlemi için arazide yer kontrol noktaları işaretlenmelidir. Bu çalışmada; bir test alanında stereo Göktürk-2 uydu görüntüsünün ( 0.5 m çözünürlüklü ) konumsal doğruluğu araştırılmıştır. Bunun için 31 yer konrol noktası işaretlenmiştir. Bu noktalar kontrol ve denetleme noktası olarak kullanılmıştır. Farklı sayıda kontrol ve denetleme noktası kullanılarak blok dengeleme yapılmıştır. Kontrol nokta sayısının dengeleme sonuçlarına etkisi de araştırılmıştır. 5 kontrol noktası ve 26 denetleme noktası kullanılarak yapılan dengeleme sonucunda; kontrol noktaları için x yönünde 53 cm, y yönünde 17 cm, z yönünde 63
cm karesel ortalama hatalar elde edilmiştir. Denetleme noktaları için x yönünde 55 cm, y yönünde 26 cm ve z yönünde 65 cm karesel ortalama hatalar bulunmuştur. Ayrıca, stereo modelden okunan koordinatlarla ve jeodezik yöntemle elde edilen nokta koordinatları karşılaştırılmıştır. Karşılaştırma sonuçlarına göre bir noktanın ortalama konum hatası 48 cm’dir.
Anahtar Kelimeler: WorldView-2, Yer control noktası, Denetleme noktası, Rektifikasyon, Çözünürlük, Çok
Yüksek Çözünürlüklü Uydu Görüntüsü
INTRODUCTION
High resolution satellite images, as less than 1 m. resolution are used in many fields such as updating existing maps, land use mapping, urban planning, disaster monitoring, and so on. To use high resolution satellite images in such fields, they have to be rectified. Rectification process is done by points whose coordinates are known in both land and image. These determined points may be the marked points in the field or visible points in images may be measured in the field. Sometimes, these points may represent; road cross, painting objects, etc. Points which are set up in the field are either acquired from existing maps or from image matching the research site or geodetic surveys.
In this study, the spatial accuracy of the stereo WorldView-2 satellite image established on a test area was investigated. High-resolution satellite images (IKONOS, QuickBird, GeoEye-1, WorldView-1-2, etc.) spatial correction, adjustment blocks in the rectification process of the used model and GCP have been investigated in many publications.
Acquisition of ground control points (GCPs) is particularly importance for spatial correction of high resolution satellite images. The commercial high resolution satellite image can be accurately rectified using the combination of bias-corrected rational polynomial coefficients (RPCs) and ground control points (GCPs). With a few precisely measured GCPs accurate three dimensional measurements can be made from the base level Ikonos data product. However, the accuracy of the results is dependent on the precision of the GCPs (Dare et.al, 2002).
In the article of Grodecki and Dial (2003), detailed information about the block adjustment of high-resolution satellite imagery use of the RPC model can be found.
The control points could be acquired by three different methods for spatial correction in two and three dimensional of high resolution satellite images. These are GCPs from existing maps, GCPs set up in land, GCPs from image matching.
Kadota and Takagi (2002) had used above mentioned methods in acquisition of GCPs for spatial correction of high resolution satellite image. They had achieved best result with surveyed GCPs.
Dial and Grodecki (2003) had tested Ikonos stereo accuracy without ground control point. They had achieved absolute accuracy at 6.2 m. horizontal, 10.1 m. vertical, and found out the most relative accuracy results for points more than 3 meters.
Hanley and Fraser (2001) had used ground surveyed GPS points and ground control measured from the orthomosaic for two dimensional spatial correction of high resolution satellite images. They had achieved similar results from both surveyed GPS points and orthomosaic points.
Dare et. al. (2002) had used ground measured from GPS points and orthomosaic GCPs for three dimensional correction of high resolution satellite images. They had also achieved similar results from both surveyed GPS points and orthomosaic points. The spatial corrections by using GCPs surveying in land may give most accurate results.
WorldView-2 satellite image geo-referencing accuracy of the impact point of the analysis and distribution were studied (Wang and Gruen, 2012). Ke (2006) has made the experimental study of the process of orthorectification accuracy in the analysis of images VHRS. GCP properties (shapes, distribution, the accuracy, number of GCPs) were examined. Yilmaz et al. (2004) have researched available GCPs dimensions for IKONOS satellite imagery.
Mutluoglu et al. (2012) carried out a study about the appropriate sizes of GCPs on woldview-2 satellite images.
The effect of distribution of control points at the terrain has seen to be more effective than the effect of number of control points upon the adjustment results (Mutluoglu et al. 2014).
Yakar et al. (2006) have investigated to determine registration outside areas of via satellite images.
WORLDVIEW-2 SATELLITE
The WorldView-2 (WV-2) satellite, launched by DigitalGlobe on Oct 8 2009 represents the first commercial imaging satellite to collect very high spatial resolution data in 8 spectral bands (Padwick et al. 2010). The images provided by the satellite can be used for applications such as mapping, land planning, disaster relief, exploration, defense and intelligence, visualization and simulation of environments and classification. Worldview- 2 can operate at an altitude of 770km with an inclination of 97.2° for a maximum orbital period of 100 minutes. WorldView-2’s large-area collection capabilities and rapid retargeting are two important features of the satellite. WorldView-2’s advanced geopositional technology provides significant improvements in accuracy. The accuracy specification has been tightened to 6.5m CE90 directly right off the satellite, meaning no processing, no elevation model and no ground control, and measured accuracy is expected to be approximately 4m CE90.
WorldView-2 panchromatic resolution is 46cm and multispectral resolution is 1.8m. Distribution and use of imagery better than 0.50m GSD pan and 2.0m GSD multispectral is subject to prior approval by the U.S. Government. As the first high-resolution commercial satellite to provide eight spectral bands, WorldView-2 offers imagery with a high degree of detail, unlocking a finer level of analytical discernment that enables improved decision-making. In addition to industry-standard blue, green, red and near-infrared, WorldView-2 includes four previously unavailable bands, collected at 1.8m resolution: coastal blue, yellow, red edge and near-infrared 2. These bands offer a range of benefits to analysts, who will be able to identify a broader range of classification, (e.g. more varieties of vegetation or water-penetrated objects), to extract more features (e.g. cotton-based camouflage from natural ground cover), to view a truer representation of colors that match natural human vision, and to track coastal changes and infractions (Cheng and Chaapel, 2010, URL1).
MATERIAL AND METHOD
Test Area
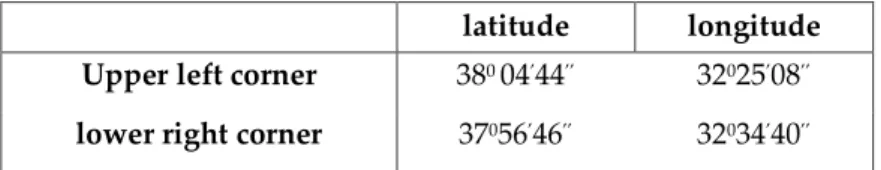
A (15kmx14km) test area has created at surround of Konya Selcuk University Alaeddin Keykubad campus area. Application area of South and South East parts consist of the plains, Northern, North Eastern and North Western part consists of mountainous terrain. In the test area, outside the residential areas of land consist of agricultural areas and bare land. There is not height vegetation (height trees, forest). In the test area, the elevations are changing between 1000 m. and 1700 m. Frame area remain among the following geographic latitude and longitude are given in Table 1.
Table 1. Geographic coordinates of test area
latitude longitude
Upper left corner 380 04’44’’ 32025’08’’ lower right corner 37056’46’’ 32034’40’’
WorldView-2 Data
In this study, dated July 9, 2013, stereo woldview-2 (WV-2) satellite pansharpened images are used. With images (Rational Polynomial Coefficients) RPCs files are also obtained.
RPC metadata files contain orbital parameters of the satellites (orientation, height, etc.). RPC metadata files have provided model data of cameras and used in most software packages for 3D photogrammetric production of detail, digital elevation models and orthorectified imagery. Satellite image of the test area in Figure 1 is seen. The technical characteristics of WV-2 image taken are given in Table 2.
a b
Figure. 1. a) first image, b) second image Table 2. The technical characteristics of WV-2 image taken
Parameters WV-2
First scene
WV-2 Second scene imageDescriptor StereoOR2A StereoOR2A
productType Stereo Stereo
bitsPerPixel 16 16
outputFormat GeoTIFF GeoTIFF
scanDirection Forward Forward
firstLineTime 09.07.2013 09.07.2013
08:59:11.22850 09:00:16.428479
meanSunAz 138.2 (degree) 138.8 (degree)
meanSunEl 70.4 70.5 meanSatAz 46.8 157.7 meanSatEl 68.4 68.8 MeanInTrack ViewAngle 15.3 15.7 MeanCrossTrack ViewAngle 11.9 10.2 MeanOffNadir ViewAngle 19.3 18.6 cloudCover 0 0 productGSD 0.50m 0.50m
Office and Field Studies
First of all; location of GCPs have been selected on the 1/25000 scaled map. Nonresidental places have been selected for GCP. The aim of this is prevent of GCP from the destroying and, secondly to use for other different studies. Steel Frame has been made for the GCPs. Selected GCPs have been set up using of steel frame poured concrete on the field. GCPs have been painted white and black according to measurements below (Figure 2). GCPs and satellite images which are marked in the field of view are given in Figure 3.
Figure 2. Dimensions of GCP
a b
Figure 3. a) The GCP on the field, b) The GCP on the image
In addition, GCPs are marked with calcareous at difficult to reach areas and certain details are selected at settled areas. GCPs coordinates were measured by the method of CORS-TR.
Dual frequency Ashtech Promark 500 GNSS receiver was used at measurements. Sub 10 cm position accuracy with dual-frequency receiver can be obtained. Measurements are made in the two sessions and average values are calculated. Obtained coordinates are at ITRF system. The details of CORS-TR can be found in the articles of Yıldırım et al. (2007) and Kahveci (2009).
Erdas LPS software was used for the evaluation of satellite image. 31 GCPs were used at block adjustment. For the suitable purpose of the study, first of all, suitable numbers and suitable distributed GCPs are used, then the number of suitable distributed points was reduced and reduced GCPs were transformed into check points.
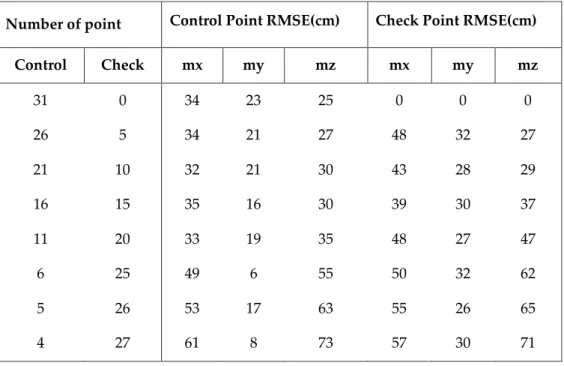
The average error according to the results of block adjustment were given in Table 3. Initially, 31 GCP points were used at adjustment as a control points. Then, adjustment was made using different number of control points. The other reduced points were accepted as a check points. The average errors in the
control points changed from 32 cm to 61 cm, in x direction errors from 6 cm to 23 cm in y direction errors, from 25 cm to 73 cm in z direction errors. The average errors in the check points changed from 39 cm to 57 cm in x direction errors, from 26 cm to 32 cm in y direction errors, from 27 cm to 71 cm in z direction errors.
Table 3. Calculated average errors according to x,y,z directions using different numbers
control and check points
Number of point Control Point RMSE(cm) Check Point RMSE(cm)
Control Check mx my mz mx my mz 31 0 34 23 25 0 0 0 26 5 34 21 27 48 32 27 21 10 32 21 30 43 28 29 16 15 35 16 30 39 30 37 11 20 33 19 35 48 27 47 6 25 49 6 55 50 32 62 5 26 53 17 63 55 26 65 4 27 61 8 73 57 30 71
When the 31 control points on the image were used at block adjustment, mxy = 41 cm was obtained and when 5 control points were used at block adjustment, mxy = 56 cm was obtained. According to the results here, the use of too many control points did not affect internal accuracy. Establishing too much points to working field meaned an increase in cost and time loss. Namely the establishment of 5 control points at an appropriate distribution and making the exterior orientation process according to these five points appeared to be sufficient (Mutluoğlu et al. 2014). In another study carried out, with 10 GCPs spatial correction of WorldView-2 satellite image has been conducted and root mean square errors has been calculated as 45 cm in x direction , 66 cm in y direction (Hobi and Ginzler, 2012).
Figure 4. Manuel measurement of feature point coordinates.
The coordinates of the same point determined by geodetic methods and comparisons have been made. In comparison, the coordinates determined with geodetic method were used as a reference. The following formulas used in the comparison, and the results are given in Table 4.
Y G K X G K
V
Y
Y
V
X
X
(1)
X X
xV V
m
n
(2)
Y Y
YV V
m
n
(3)
X X Y Y
pV V
V V
m
n
(4) In this equations;,
K KY
X
: reference coordinates which are measured geodetic methods,
G G
Y X
: Manually measured coordinates from stereo modelx
m
: X rmsey
m
: Y rmsep
m
: Average positioning errorTable 4: Comparing the results obtained from stereo model coordinates and
geodetic method coordinates
position Comparative results (cm) Vy min Vy max Vx min Vx max My Mx Mp Point number feature -56 84 57 109 32 36 48 48 CONCLUSION
In this study dated in 9 July, 2013 0.5 resolution, stereo WoldView-2 pansharpened images have been used. One of the widely used areas of VHRS is producing and updating of maps. For this , well-distributed GCPs have been established and coordinates have been measured with CORS-TR. To use as a map of VHRS images, spatial correction should be done certainly. Rectification process can be done without GCPs but using GCPs increases the accuracy of rectification. Numbers, distribution, shape and spatial accuracy of GCPs have an effect on the rectification accuracy.
Time, cost and accuracy are important factors at map production. If GCPs are marked more than needed, it means it increases time and cost. This study has shown that rectification can be achieved at high accuracy with RPCs model and using suitable distribution of GCPs (4 or 5 GCPs).
Before taking satellite images, it is always useful to establish GCP at field in appropriate distribution and appropriate sizes. If GCP establishment is not done previously, it is difficult to determine GCP especially non-residential areas on image. At the end of this study, average position accuracy has been calculated as 48 cm. This calculated average positioning accuracy is near drawing accuracy in 1/2500 scaled-map accuracy. WorldView-2 satellite image whose spatial correction was made can be used in updating many maps, following the changes in the GIS, in the study of land-use planning and so forth. For a definitive decision about the geometrical accuracy of the WorldView-2 satellite image, studies should be made on the terrains having different features (residential, mountains, plains, etc.).
ACKNOWLEDGMENT
The authors wish to acknowledge for the cooperation and the financial assistance given by the Scientific Research Found (BAP) of Selcuk University.
REFERENCES
Cheng, P., Chaapel, C., 2010, “Pan-sharpening and Geometric Correction WorldView-2 Satellite”, GEOInformatic June 2010, pp. 30-33.
Dare, P., Pendlebury, N., Frase, C., “Digital Orthomosaics as a Source of Control for Geometrically Correction High Resolution Satellite Imagery”, Proceedings of the 23rd Asian Conference on Remote Sensing, Kathmoandu, Nepal, No. 173, 25-29 November 2002.
Dial, G. and Grodecki J., "Ikonos Stereo Accuracy Without Ground Control”, ASPRS 2003 Annual Conference Procedings, Anchorage, Alaska, May 2003.
Grodecki.,J., Dial, G., 2003, “Block Adjustment of High-Resolution Satellite Images Described by Rational Polynomials”, Photogrammetric Engineering & Remote Sensing, Vol.69 (1), pp.59-68, January 2003.
Hanley, H. B. And Fraser C. S., 2001, “Geopositioning Accuracy of Ikonos Imagery; Indications from 2D Transformations”, Photogrammetric Record, Vol. 17 (98), pp. 317-329.
Hobi, L.M., Ginzler., C., 2012, “Accuracy Assessment of Digital Surface Models Based on WorldView-2 and ADS80 Stereo Remote Sensing Data”, Sensors, Vol. 12 (5), pp. 6347-6368.
Kadota, T. and Takagi, M., "Acquisition Method of Ground Control Points For High-Resolution Satellite Imagery", Proceedings of the 23rd Asian Conference on Remote Sensing, Kathmoandu, Nepal, No. 173, 25-29 November 2002.
Kahveci, M., 2009, “Gerçek Zamanlı Ulusal Sabit GNSS (CORS) Ağları ve Düşündürdükleri”, HKM Jeodezi, Jeoinformasyon ve Arazi Yönetimi Dergisi, Vol. 2009/1 Sayı 100, pp.13-20.
Ke L. C., 2006, “Orthorectification Accuracies of VHRS Imagery Under the Characteristics of Ground Control Points”, International Symposium on Geoinformatics for Spatial Infractructure Development in Earth and Allied Sciences (GIS-IDEAS) 2006, Ho Chi Minh City, Vietnam. 9-11 November 2006.
Mutluoglu, O., Yakar, M., Yilmaz, H.M, 2014, “Investigation Of Spatial Accuracy Of High-Resolution (50cm) WORLVIEW-2 Satellite Images”, Scientific Research Found (BAP) of Selcuk University (poject number 10401092).
Mutluoglu,O., Yakar,M., Yılmaz,H.,M., 2012, The Most Suitable Sizes Of Ground Control Points (Gcps) For World View2” FIG Working Week 2012 Knowing To Manage The Territory, Protetect The Environment, Evaluate The Cultural Heritage Rome, Italy, 6-10 May 2012.
Mutluoglu, O., Yakar, M,.Yilmaz, H.M., 2015, “Investigation of Effect of The Number of Ground Control Points and Distribution on Adjustment at WorldView-2 Stereo Images” International Journal of Applied Mathematics, Electronics and Computers, IJAMEC, 2015, Vol. 3(1), pp. 37–41 Advanced Technology and Science ISSN: 2147-82282147-6799 www.atscience.org/IJAMEC. Padwick, C., Deskevich, M., Pacifici, F., Smallwood S., “WorldView-2 Pan-sharpening”, ASPRS Annual
Conference 2010, San Diego, California, 26-30 April 2010.
URL1: www. DigitalGlobe.com_Core_Imagery_Product_Guide (Acces April, 2010 ).
Wang.,T, Gruen., A., “Georeferencing Accuracy Analysis of WorldView-2 and IKONOS Images of Singapore Based on RPFs”, The 33 rd Asian Conference on Remote Sensing, ACRS 2012, Pattaya, Thailand, 26-30 November 2012.
Yakar., M., Mutluoğlu., Ö., Çay., T., İşcan., F., Yıldız.,F., Yılmaz., H.M., “Inspection of Outside- Registration-Areas Via Ikonos Satellite Images”, Fifth Intenational Symposium Turkish-German Joint Geodetic Days, Berlin , 28-31 March 2006.
Yıldırım, Ö., Bakıcı, S. Cingöz, A., Erkan, Y., Gülal, E. Dindar, A. A., 2007, “TUSAGA-AKTİF (CORS TR) Projesi ve Ülkemize Katkıları”, TMMOB Harita ve Kadastro Mühendisleri Odası, Ulusal Coğrafi Bilgi Sistemleri Kongresi, KTÜ, Trabzon, 30 Ekim –02 Kasım 2007.
Yilmaz, H.M., Yakar. , M. Mutluoglu, O. Yildiz, F., “Selection of The Most Suitable Sizes of Ground Control Points in The Satellite Images”, ISPRS Congress Istanbul, 12-13 July 2004.