199
A DFT STUDY ON MOLECULAR STRUCTURE AND POSSIBLE CONFORMERS OF TARTARIC ACID
Yavuz EKİNCİOĞLU1,*, Hamdi Şükür KILIÇ1, Ömer DERELİ2
1
Department of Physics, Faculty of Science, Selçuk University, Konya Turkey
2
Faculty of A. Keleşoğlu Education, University of Konya Necmettin Erbakan, Konya Turkey
*[email protected], [email protected], [email protected]
Abstract
In order to determine molecular structure, a conformational analysis of tartaric acid was performed and eight stable conformers were determined. The conformational space of the tartaric acid was scanned using molecular mechanic calculations performed by courtesy of the Spartan08 program. In addition, the most stable structure of tartaric acid that has the lowest energy structure is determined. Geometry optimizations were performed with Becke’s three-parameter hybrid-exchange functional combined with the Lee–Yang–Parr correlation functional (B3LYP) method and the standard 6-311++G (d,p) basis set. The calculated molecular geometry parameters, HOMO-LUMO energies, molecular electrostatic potentials (MEPs) and some thermodynamic parameters were also given for further studies. All these calculations carried out by using Gaussian03W package program.
Keywords: DFT, Conformational Analysis, Tartaric Acid, Molecular Thermodynamics
TARTARİK ASİTİN MOLEKÜLER YAPİSİ VE OLASİ KONFERMERLERİ HAKKİNDA DFT ÇALİŞMASİ
Özet
Tartarik asitin moleküler yapısını belirlemek için konformasyon analizi uygulanmış ve sekiz kararlı konformere sahip olduğu belirlenmiştir. Tararik asitin konformasyonel uzayı Spartan08 programıyla moleküler mekanik hesaplama ile taranmıştır. Ayrıca, tartarik asit molekülünün en düşük enerjili kararlı yapısı belirlenmiştir. Lee-Yang-Parr korelasyon fonksiyonelli 3 parametreli Becke karma modeli (B3LYP) ve 6-311++G(d,p) baz seti kullanılarak geometri optimizasyonları
200
gerçekleştirilmiştir. Hesaplanan moleküler geometri parametreleri, HOMO-LUMO enerjileri, moleküler elektrostatik potansiyel (MEPs) ve bazı termodinamik parametreler de ileri çalışmalar için verilmiştir. Tüm hesaplamalar Gaussian03W paket programı kullanılarak gerçekleştirilmiştir.
Anahtar Kelimeler: DFT, Konformasyon Analizi, Tartarik Asit, Moleküler Termodinamik
1. Introduction
Recently, multi-disciplinary studies involving both theoretical and experimental methods in the fields of chemistry, physics and engineering have become very important for manufacturing new technological tools, for example; development of organic non-linear optical (NLO) materials. Furthermore, Density Functional Theory (DFT) is a widely accepted framework for calculating the properties of ground/excited electronic states in molecules, clusters and solids. In this work, some structural properties of the tartaric acid will be determined.
Tartaric acid has a crystalline structure, colorless organic acid and it has a natural abundance in plants. This acid is used in various industries, especially in the food industry. Also, during the fermentation of the wine potassium, one of the most important organic acids is tartaric acid which provides the taste of juice and wine, as well as supply the low Ph environment needed to prevent microbial deterioration during wine production. The most abundant acid in grape seeds and wine is tartaric acid [1]. By using a high-output UHPLC MS/MS method, tartaric acid has been determined that it exists in grape wine in a high concentration [2]. Tartaric acid is obtained as a by-product. It is commonly used in sodas, as a sweetener in gelatin, for polishing surface of metals and for the reason of cleaning of the paintings and fabrics [3]. Its consumption is estimated approximately 50.000 to 70.000 tons per year, all over the world markets [4]. Optically active form of tartaric acid has been determined by Patterson and Fourier methods [5]. The hydrogen bonding in the crystal structure of D-tartaric acid determined by using X-Ray diffraction and neutron diffraction methods [6]. Conformational calculations of tartaric acid were carried out by using Ab-initio methods [7]. Experimental studies and Ab-initio calculations of the optical/vibrational/Raman properties of the tartaric acid was studied in some details [8]. The theoretical
201
vibrational frequencies and Potential Energy Distribution (PED) of the L-lysine tartaric acid were calculated by using Density Functional Theory (DFT) method. Beside the calculated frequencies were compared to that of experimentally obtained IR spectra [9]. Theoretical calculations of vibrational frequencies and potential energy distribution (PDE) for L-lysine×tartaric acid were calculated by B3LYP method. Calculated frequencies were compared to experimentally measured IR spectra. Also, the time-dependent Hartree-Fock calculation of nonlinear optical (NLO) properties and dipole moments were performed too [9].
Because the most of physical and chemical properties of a molecule depend on the molecular structure and several medicinal effects, especially for biologically active molecules, depend on conformational behavior, information about molecular structure and conformational behavior of a compound are very important [10]. DFT is widely used on molecular structural studies nowadays [11-18]. Due to author knowledge, there is no comprehensive DFT study on molecular structure and conformational behavior of tartaric acid in literature.
In this study, firstly conformational analysis of tartaric acid was performed and then, as a result, eight conformers were determined. Secondly, geometry parameters, Molecules Electrostatic Potentials (MEPs), HOMO-LUMO energies and some thermodynamic properties of the most stable conformer were also presented.
2. Computational Details
In order to establish the stable possible conformations, the conformational space of the tartaric acid was scanned using molecular mechanic calculations performed by courtesy of the Spartan08 program [19]. In the second step, geometry optimizations of the all possible conformers were performed by B3LYP functional with 6-311++G(d,p) basis set. After the determination of the most stable conformer of interested compound, optimized structural parameters of this conformer were used for the further calculations. Optimizations and frequency calculations were performed by the same level of DFT. In this step, all the calculations were performed using Gaussian03W [20] package program.
202 3. Results and Discussion
3.1 Conformational Analysis and Molecular Structure
In order to determine the stable conformations of tartaric acid, the combined molecular mechanic and DFT calculations with the B3LYP/6-311++G(d,p) basis set have been used. Firstly, conformational space of tartaric acid was scanned with molecular mechanic calculations. Then, geometry optimizations of these conformers were performed with B3LYP/6-311++G(d,p) level of DFT. The obtained values of these calculations helps us to find the most stable structure. Energy values and dipole moments are shown in Table 1.
Table 1. Conformer energies and dipole moment values of tartaric acid molecule
Conformations Energies (Hartree)
Dipole Moment
(D)
Conformations Energies (Hartree)
Dipole Moment (D) Conf1 -607.6037915 3.3503 Conf5 -607.5969547 1.7204 Conf2 -607.5981469 3.2322 Conf6 -607.5951956 2.1695 Conf3 -607.5973040 2.7556 Conf7 -607.5933786 3.7670 Conf4 -607.5971055 1.6151 Conf8 -607.5871529 4.3422
As it is seen in Table 1, the most stable conformer of tartaric acid is the conformer 1 which has a minimum energy (-607.6037915 Hartree). Obtained structures of conformations of tartaric acid are shown in Figure 1.
Figure 1. Possible conformers of tartaric acid molecule
Figure 1. Possible conformers of Tartaric acid molecule
Conformation 1 Conformation 2
Conformation 3 Conformation 4
Conformation 5 Conformation 6
Conformation 7 Conformation 8
Figure 1. Possible conformers of Tartaric acid molecule
Conformation 1 Conformation 2
Conformation 3 Conformation 4
Conformation 5 Conformation 6
Conformation 7 Conformation 8
Figure 1. Possible conformers of Tartaric acid molecule
Conformation 1 Conformation 2
Conformation 3 Conformation 4
Conformation 5 Conformation 6
Conformation 7 Conformation 8
Figure 1. Possible conformers of Tartaric acid molecule
Conformation 1 Conformation 2
Conformation 3 Conformation 4
Conformation 5 Conformation 6
Conformation 7 Conformation 8
Figure 1. Possible conformers of Tartaric acid molecule
Conformation 1 Conformation 2
Conformation 3 Conformation 4
Conformation 5 Conformation 6
Conformation 7 Conformation 8
Figure 1. Possible conformers of Tartaric acid molecule
Conformation 1 Conformation 2
Conformation 3 Conformation 4
Conformation 5 Conformation 6
Conformation 7 Conformation 8
Figure 1. Possible conformers of Tartaric acid molecule
Conformation 1 Conformation 2
Conformation 3 Conformation 4
Conformation 5 Conformation 6
Conformation 7 Conformation 8
Figure 1. Possible conformers of Tartaric acid molecule
Conformation 1 Conformation 2
Conformation 3 Conformation 4
Conformation 5 Conformation 6
203
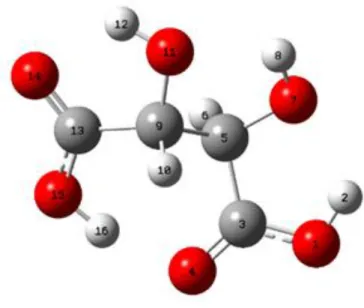
Figure 2. The most stable structure of tartaric acid molecule
The most stable structure and the atom numbering scheme are shown in Figure 2.
3.2 Molecular Electrostatic Potentials
The molecular electrostatic potentials (MEPs) are regard as the most significant electrostatic feature to study relation between structure and activity of a molecule. Also, it is an important tool for chemistry to describe different physical and chemical properties.
MEPs were used for investigation of non-covalent interactions (sites with intra and intermolecular interaction) in tartaric acid. In the Figure 3, green parts represent the regions of zero potential while red and blue parts represent the regions of positive and negative electrostatic potential, respectively.
204
Figure 3. MEPs of the tartaric acid molecule
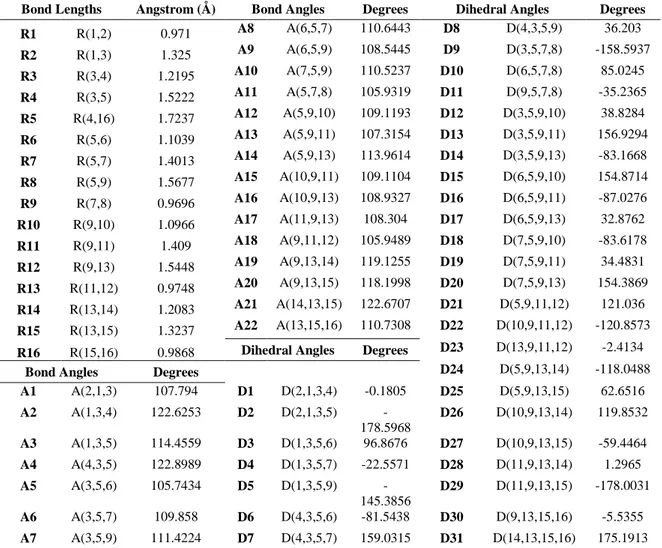
Computed bond lengths, bond angles and dihedral angles of the molecule are given in Table 2.
Table 2. Geometrical parameters of tartaric acid molecule (R= Bond Length, A= Bond Angles, D= Dihedral Angles)
Bond Lengths Angstrom (Å) Bond Angles Degrees Dihedral Angles Degrees R1 R(1,2) 0.971 A8 A(6,5,7) 110.6443 D8 D(4,3,5,9) 36.203 R2 R(1,3) 1.325 A9 A(6,5,9) 108.5445 D9 D(3,5,7,8) -158.5937 R3 R(3,4) 1.2195 A10 A(7,5,9) 110.5237 D10 D(6,5,7,8) 85.0245 R4 R(3,5) 1.5222 A11 A(5,7,8) 105.9319 D11 D(9,5,7,8) -35.2365 R5 R(4,16) 1.7237 A12 A(5,9,10) 109.1193 D12 D(3,5,9,10) 38.8284 R6 R(5,6) 1.1039 A13 A(5,9,11) 107.3154 D13 D(3,5,9,11) 156.9294 R7 R(5,7) 1.4013 A14 A(5,9,13) 113.9614 D14 D(3,5,9,13) -83.1668 R8 R(5,9) 1.5677 A15 A(10,9,11) 109.1104 D15 D(6,5,9,10) 154.8714 R9 R(7,8) 0.9696 A16 A(10,9,13) 108.9327 D16 D(6,5,9,11) -87.0276 R10 R(9,10) 1.0966 A17 A(11,9,13) 108.304 D17 D(6,5,9,13) 32.8762 R11 R(9,11) 1.409 A18 A(9,11,12) 105.9489 D18 D(7,5,9,10) -83.6178 R12 R(9,13) 1.5448 A19 A(9,13,14) 119.1255 D19 D(7,5,9,11) 34.4831 R13 R(11,12) 0.9748 A20 A(9,13,15) 118.1998 D20 D(7,5,9,13) 154.3869 R14 R(13,14) 1.2083 A21 A(14,13,15) 122.6707 D21 D(5,9,11,12) 121.036 R15 R(13,15) 1.3237 A22 A(13,15,16) 110.7308 D22 D(10,9,11,12) -120.8573 R16 R(15,16) 0.9868 Dihedral Angles Degrees D23 D(13,9,11,12) -2.4134
Bond Angles Degrees D24 D(5,9,13,14) -118.0488 A1 A(2,1,3) 107.794 D1 D(2,1,3,4) -0.1805 D25 D(5,9,13,15) 62.6516 A2 A(1,3,4) 122.6253 D2 D(2,1,3,5) -178.5968 D26 D(10,9,13,14) 119.8532 A3 A(1,3,5) 114.4559 D3 D(1,3,5,6) 96.8676 D27 D(10,9,13,15) -59.4464 A4 A(4,3,5) 122.8989 D4 D(1,3,5,7) -22.5571 D28 D(11,9,13,14) 1.2965 A5 A(3,5,6) 105.7434 D5 D(1,3,5,9) -145.3856 D29 D(11,9,13,15) -178.0031 A6 A(3,5,7) 109.858 D6 D(4,3,5,6) -81.5438 D30 D(9,13,15,16) -5.5355 A7 A(3,5,9) 111.4224 D7 D(4,3,5,7) 159.0315 D31 D(14,13,15,16) 175.1913 3.3 HOMO-LUMO Analysis
The HOMO (Highest Occupied Molecular Orbital) and LUMO (Lowest Unoccupied Molecular Orbital), which are the main orbitals taking part in chemical reaction, are called as the Frontier Molecule Orbitals (FMOs) [21]. Therefore, HOMO represents the outermost molecule orbital filled by electrons and behaves as an electron donor, while LUMO can be implies as the first empty innermost molecular orbital unfilled by electrons and behaves as an electron acceptor. The energy gap formed between HOMO and LUMO indicates the molecular chemical stability [22]. The energy gap between HOMO and LUMO is a critical parameter to determine molecular
205
electrical transport properties. By using HOMO and LUMO energy values of a molecule, some molecular properties such as the chemical reactivity, kinetic stability, optical polarizability, chemical hardness and softness and electronegativity can be found. The soft molecules are more polarizable than the hard ones. Therefore, for soft molecules to be excites, a small portion of excitation energy is required, whereas for hard ones to be excited, a large amount of excitation energy is required [21]. In this study, using B3LYP/6-311++G(d,p) level of theory HOMO-LUMO energies of structure molecule interest in this work were calculated and shape of these orbitals were drawn, as it is seen in Figure 4, by Gausswiev.
(a) E(HOMO) = −0.31657 (b) E(LUMO) = −0.05223
Figure 4. (a) HOMO and (b)-LUMO energies of the tartaric acid Some thermodynamic properties of tartaric acid were given in Table 3.
Table 3. Thermodynamic parameters of tartaric acid molecule
Thermal energy, E (kcal/mol) Entropy, S (cal/mol K)
Electronic 0.000 Electronic 0.000
Translational 0.889 Translational 40.927
Rotational 0.889 Rotational 29.656
Vibrational 76.950 Vibrational 24.278
Total 78.728 Total 94.861
Heat capacity, Cv (cal/mol K)
Electronic 0.000
Translational 2.981 Zero-point vibrational energy (kcal/mol) 72.89054 Rotational 2.981 Sum of electronic and zero-point energies
(Hartree/Particle)
-607.487633 Vibrational 28.434 Sum of electronic and thermal free energies
(Hartree/Particle)
206
Total 34.395
4. Conclusion
DFT calculations on molecular structure and conformational analysis of Tartaric acid were performed for the first time in this study. The calculated energies and dipole moments of eight different conformers and the molecular structural parameters of the most stable conformer were given. The most stable structures energy and dipole moment values were -607.6037915 Hartree and 3.3503 D, respectively. Relationship between structure and activity of the tartaric acid molecule can be studied in terms of MEPs. Besides, non-covalent interactions were studied by MEPs. As seen in the Fig. 3, the negative region is mainly localized on the O14 atom. However, positive region is localized on the H2 and H8 atoms. Thus, we can conclude that these regions are the sites correspond to the hydrogen bondings of tartaric acid. Parameters needed to be known, such as chemical reactivity, kinetic stability, optical polarizability, chemical hardness or softness and electronegativity, can be found by using HOMO-LUMO energies. HOMO and LUMO energy values have been found −0.31657, −0.05223 Hartree and 8.61437 eV and 1.41126 eV respectively that corresponds to 7.19311 eV band gap value. Some thermodynamic parameters have been given for further researchers in this study.
References
[1] Ruffner, H. P. "Metabolism of tartaric and malic acids in Vitis: a review. B." Vitis (1982).
[2] Higginson, E. G., et al. "A high‐throughput UHPLC MS/MS method for evaluation of tartaric and malic acid concentration in individual grapevine berries." Australian Journal of Grape and Wine Research 22.1 (2016): 16-23.
[3] Kontogiannopoulos KN, Patsios SI, Karabelas AJ. Tartaric acid recovery from winery lees using cation exchange resin: Optimization by Response Surface Methodology. Separation and Purification Technology. 2016; 165:32-41.
[4] Berger RG. Flavours and fragrances: chemistry, bioprocessing and sustainability: Springer Science & Business Media; 2007.
[5] Stern Ft, Beevers C. The crystal structure of tartaric acid. Acta Crystallographica. 1950; 3 (5):341-6.
207
[6] Okaya Y, Stemple Nt, Kay M. Refinement of the structure of D-tartaric acid by X-ray and neutron diffraction. Acta Crystallographica. 1966; 21 (2):237-43.
[7] Polavarapu P, Ewig C, Chandramouly T. Conformations of tartaric acid and its esters. Journal of the American Chemical Society. 1987; 109 (24):7382-6.
[8] Barron L, Gargaro A, Hecht L, Polavarapu P, Sugeta H. Experimental and ab initio theoretical vibrational Raman optical activity of tartaric acid. Spectrochimica Acta Part A: Molecular Spectroscopy. 1992; 48 (8):1051-66.
[9] Drozd M, Marchewka M. The structure, vibrational spectra and nonlinear optical properties of the l-lysine× tartaric acid complex—Theoretical studies. Spectrochimica Acta Part A: Molecular and Biomolecular Spectroscopy. 2006; 64 (1):6-23.
[10] Sarıkaya, E. Karakaş, and Ö. Dereli. "Study on molecular structure and vibrational spectra of 5, 7-dimethoxycoumarin using DFT: A combined experimental and quantum chemical approach." Optics and Spectroscopy117.2 (2014): 240-249.
[11] Gökce, H., & Bahçeli, S. (2010). Analysis of molecular structure and vibrational spectra of 1 (2H)-phthalazinone. Journal of Molecular Structure, 967(1), 42-46. [12] Gökce, H., & Bahçeli, S. (2011). Quantum chemical computations of 1,
3-phenylenediacetic acid. Spectrochimica Acta Part A: Molecular and Biomolecular Spectroscopy, 78(2), 803-808.
[13] Gökce, H., & Bahçeli, S. (2011). Analysis of molecular structure and vibrational spectra of 2-(2′-thienyl) pyridine. Journal of Molecular Structure, 1005(1), 100-106. [14] Tanak, H., Koçak, F., & Ağar, E. (2016). A combined experimental (XRD, FT-IR, and UV–Vis) and DFT computational studies on (E)-N-[4-bromo-2-(trifluromethoxy) phenyl]-1-(5-nitrothiophen-2-yl) methanimine. Molecular Physics, 114(2), 197-212.
[15] Tanak, H. (2014). Molecular structure, spectroscopic (FT-IR and UV-Vis) and DFT quantum-chemical studies on 2-[(2, 4-Dimethylphenyl) iminomethyl]-6-methylphenol. Molecular Physics, 112(11), 1553-1565.Y. Erdogdu, Spectrochim. Acta Part A 106 (2013) 25e33.
208
[16] Erdogdu, Y. (2013). Investigations of FT-IR, FT-Raman, FT-NMR spectra and quantum chemical computations of Esculetin molecule. Spectrochimica Acta Part A: Molecular and Biomolecular Spectroscopy, 106, 25-33.
[17] Erdogdu, Y., Eskioǧlu, B., & Güllüoǧlu, M. T. (2012). Theoretical investigations on the molecular structure and vibrational spectral analysis of 4-methyl 2-phenylimidazole. Optics and Spectroscopy, 113(6), 596-606.
[18] Erdogdu, Y., Drozd, M., & Marchewka, M. K. (2012). Structural, calorimetric and vibrational investigations of 2, 3 and 4-hydroxyanilinium perchlorate: A theoretical and experimental study. Vibrational Spectroscopy, 58, 169-180.
[19] Spartan 08, Wavefunction Inc., Irvine, CA 92612, USA, 2008.
[20] Gaussian 03, Revision E.01, M.J. Frisch, G.W. Trucks, H.B. Schlegel, G.E. Scuseria,M.A. Robb, J.R. Cheeseman, J.A. Montgomery, Jr., T. Vreven, K.N. Kudin, J.C.Burant, J.M. Millam, S.S. Iyengar, J. Tomasi, V. Barone, B. Mennucci, M. Cossi, G.Scalmani, N. Rega,G.A. Petersson, H. Nakatsuji, M. Hada, M. Ehara, K. Toyota, R.Fukuda, J. asegawa, M. Ishida, T. Nakajima, Y. Honda, O. Kitao, H. Nakai, M.Klene, X. Li, J.E. Knox, H. P. Hratchian, J.B. Cross, C. Adamo, J. Jaramillo, R.Gomperts, R.E. Stratmann, O. Yazyev,A.J. Austin, R. Cammi, C. Pomelli, J.W.Ochterski, P.Y. Ayala, K. Morokuma, G.A. Voth, P. Salvador, J.J. Dannenberg, V.G.Zakrzewski, S. Dapprich, A.D. Daniels, M.C. Strain, O. Farkas, D.K. Malick, A.D.Rabuck, K. Raghavachari, J.B. Foresman, J.V. Ortiz, Q. Cui, A.G. Baboul, S.Clifford, J. ioslowski, B.B. Stefanov, G. Liu, A. Liashenko, P. Piskorz, I. Komaromi,R.L. Martin, D.J. Fox, T. Keith, M.A. Al-Laham, C.Y. Peng, A. Nanayakkara, M.Challacombe, P.M.W. Gill, B. Johnson, W. Chen, M.W. Wong, C. Gonzalez, J.A.Pople, Gaussian, Inc., Pittsburgh, PA, 2003.
[21] Gökce, H., & Bahçeli, S. (2013). FT-IR, Micro-Raman and UV–vis spectroscopic and quantum chemical investigations of free 2, 2′-dithiodipyridine and its metal (Co, Cu and Zn) halide complexes. Spectrochimica Acta Part A: Molecular and Biomolecular Spectroscopy, 114, 61-73.K. Fukui, Science 218 (4574) (1982) 747–754.
[22] Fukui, K. (1982). The role of frontier orbitals in chemical reactions (Nobel Lecture). Angewandte Chemie International Edition in English, 21(11), 801-809.