JHEP07(2013)032
Published for SISSA by SpringerReceived: April 26, 2013 Accepted: June 8, 2013 Published: July 5, 2013
Measurement of the production cross section of jets
in association with a Z boson in pp collisions at
√
s = 7 TeV with the ATLAS detector
The ATLAS collaboration
E-mail:
[email protected]
Abstract: Measurements of the production of jets of particles in association with a Z
bo-son in pp collisions at
√
s = 7 TeV are presented, using data corresponding to an integrated
luminosity of 4.6 fb
−1collected by the ATLAS experiment at the Large Hadron Collider.
Inclusive and differential jet cross sections in Z events, with Z decaying into electron or
muon pairs, are measured for jets with transverse momentum p
T> 30 GeV and rapidity
|y| < 4.4. The results are compared to next-to-leading-order perturbative QCD
calcula-tions, and to predictions from different Monte Carlo generators based on leading-order and
next-to-leading-order matrix elements supplemented by parton showers.
JHEP07(2013)032
Contents
1
Introduction
1
2
Experimental setup
2
3
Monte Carlo simulation
4
4
Event selection
4
5
Background estimation
6
6
Detector-level results
7
7
Correction for detector effects and combination of channels
8
8
Systematic uncertainties
10
9
Theoretical predictions
12
10 Results and discussion
13
10.1 Jet multiplicities
14
10.2 Jet transverse momentum
17
10.3 Angular distributions
20
10.4 Distributions after VBF preselection
21
10.5 Inclusive quantities
22
11 Conclusions
24
The ATLAS collaboration
35
1
Introduction
The production of jets of particles in association with a Z boson
1at hadron colliders
provides an important test of perturbative quantum chromodynamics (pQCD). Such events
also constitute a non-negligible background for studies of the Higgs boson candidate [
1
,
2
]
and searches for new phenomena. In these searches, the multiplicity and kinematics of
jets in Z + jets events are exploited to achieve a separation of signal from background.
This procedure often introduces scales larger than the mass of the Z boson, resulting in
large logarithmic contributions in the calculation of higher-order QCD corrections to the
predicted Z + jets cross section [
3
,
4
]. The measured Z + jets cross section can be compared
1The notation Z refers to the complete Z/γ∗
JHEP07(2013)032
directly to fixed-order predictions at next-to-leading-order (NLO) in pQCD [
5
–
7
] and to
Monte Carlo (MC) generators based on next-to-leading-order or leading-order (LO) matrix
elements supplemented by parton showers [
8
–
10
]. The simulations based on LO matrix
elements are affected by large uncertainties in the factorization and renormalization scales
and need to be tuned and validated using data.
Measurements of the Z + jets cross section have been reported for lower jet
ener-gies and lower jet multiplicities in proton-antiproton collisions at a center-of-mass
en-ergy of
√
s = 1.96 TeV [
11
–
13
] and in proton-proton collisions based on a data set of
0.036 fb
−1collected at
√
s = 7 TeV [
14
,
15
]. This article extends these measurements,
us-ing 4.6 fb
−1of proton-proton collision data collected by the ATLAS experiment in 2011 at
√
s = 7 TeV. Complementary measurements in Z + jets final states in proton-proton
colli-sions at
√
s = 7 TeV have been reported in ref. [
16
].
The large data set allows cross sections to be measured for the production of up to
seven jets in association with a Z boson. Differential jet cross sections are accessible for
large jet multiplicities and for energy regimes up to 1 TeV, which allows the modelling
of the Z + jets process to be probed for typical phase-space regimes expected from new
phenomena and from Higgs boson production, for example via vector-boson-fusion (VBF).
Selected events contain a Z boson decaying into a pair of electrons or muons.
As-sociated jets are identified in a rapidity (y
jet) range of |y
jet| < 4.4 and with transverse
momentum (p
jetT) of p
jetT> 30 GeV. The measurements comprise inclusive and exclusive
jet multiplicities for different phase-space constraints and differential jet cross sections as
a function of the transverse momentum and the rapidity of the four jets with the largest
transverse momentum (‘leading jets’). Cross sections for events with at least two jets in
the final state are measured as a function of the invariant mass (m
jj) and the angular
separation of the two leading jets. Differential cross sections in events with at least one jet
are measured as a function of the scalar p
Tsum of the jets (S
T), of the scalar p
Tsum of
the leptons and jets (HT), and the transverse momentum of the Z boson candidate (p
``T).
The results of the measurements are unfolded for detector effects and quoted at the
par-ticle (hadron) level, where they are compared to predictions from fixed-order NLO pQCD
programs and from several MC generators.
The paper is organized as follows. The detector and the data sample are described in
the next section. Section 3 provides details of the simulations used in the measurements,
while section 4 describes the lepton and jet reconstruction and the event selection. The
estimation of background contributions is described in section 5 and selected uncorrected
distributions are presented in section 6. The procedures used to unfold the measurements
for detector effects and to combine electron and muon channels are detailed in section
7. Systematic uncertainties are discussed in section 8. The NLO pQCD predictions are
described in section 9. Measured cross sections are presented in section 10 and compared
to generator and NLO pQCD predictions. Finally, section 11 provides a summary.
2
Experimental setup
The ATLAS detector [
17
] at the LHC covers nearly the entire solid angle around the
colli-sion point. It consists of an inner tracking detector surrounded by a thin superconducting
JHEP07(2013)032
solenoid, followed by electromagnetic and hadronic calorimeters and a muon spectrometer
incorporating three large superconducting toroid magnets (each with eight coils). The
in-ner detector (ID) is immersed in a 2 T axial magnetic field and provides charged-particle
tracking in the pseudorapidity
2range |η| < 2.5. The high-granularity silicon pixel detector
covers the vertex region and typically provides three measurements per track, the first hit
being normally in the innermost layer. It is followed by the silicon microstrip tracker,
which provides typically eight measurements (four space-points) per track. These silicon
detectors are complemented by the transition radiation tracker, which covers a region up
to |η| = 2.0. The transition radiation tracker also provides electron identification
infor-mation based on the fraction of hits above a high energy-deposit threshold corresponding
to transition radiation. The calorimeter system covers the pseudorapidity range |η| < 4.9.
Within the region |η| < 3.2, electromagnetic calorimetry is provided by barrel and endcap
high-granularity lead/liquid-argon (LAr) calorimeters. An additional thin LAr
presam-pler covers |η| < 1.8 to correct for energy loss in material upstream of the calorimeters.
Hadronic calorimetry is provided by a steel/scintillating-tile calorimeter, segmented
radi-ally into three barrel structures within |η| < 1.7, and two copper/LAr hadronic endcap
calorimeters, that cover the region 1.5 < |η| < 3.2. The solid angle coverage is completed
in the region of 3.1 < |η| < 4.9 with forward copper/LAr and tungsten/LAr
calorime-ter modules optimized for electromagnetic and hadronic measurements respectively. The
muon spectrometer (MS) comprises separate trigger and high-precision tracking chambers
measuring the deflection of muons in a magnetic field generated by superconducting
air-core toroids. The precision chamber system covers the region |η| < 2.7 with three layers
of monitored drift tubes, complemented by cathode strip chambers in the forward region,
where the background is highest. The muon trigger system covers the range |η| < 2.4 with
resistive plate chambers in the barrel, and thin gap chambers in the endcap regions. A
three-level trigger system is used to select interesting events. The Level-1 trigger is
imple-mented in hardware and uses a subset of detector information to reduce the event rate to a
design value of at most 75 kHz. This is followed by two software-based trigger levels which
together reduce the event rate to about 400 Hz.
The analysis is based on a sample of proton-proton collisions at
√
s = 7 TeV, collected
in 2011 during periods of stable beam operation. Di-electron final states are selected with
a trigger requiring at least two electrons of p
T> 12 GeV, using an electron identification
similar to the one used in offline selection. Di-muon final states are selected with a trigger
requiring at least one muon of p
T> 18 GeV, using a higher-level trigger algorithm similar
to the one used in the offline selection. The integrated luminosity used in both channels is
4.64±0.08 fb
−1[
18
].
2ATLAS uses a right-handed coordinate system with its origin at the nominal interaction point (IP) in
the centre of the detector and the z-axis along the beam pipe. The x-axis points from the IP to the centre of the LHC ring, and the y-axis points upward. Cylindrical coordinates (r, φ) are used in the transverse plane, φ being the azimuthal angle around the beam pipe. The pseudorapidity is defined in terms of the polar angle θ as η = − ln tan(θ/2).
JHEP07(2013)032
3
Monte Carlo simulation
Monte Carlo event samples are used to determine background contributions, correct the
measurements for detector effects, correct the theory calculations for non-perturbative
effects, calculate acceptance corrections, and estimate systematic uncertainties on the final
results.
Signal events (Z (→ µµ) + jets and Z (→ ee) + jets) are generated using ALPGEN v2.13
[
8
] interfaced to HERWIG v6.520 [
19
] for parton shower and fragmentation and to JIMMY
v4.31 [
20
] for modelling interactions of the proton remnants, referred to as ‘underlying
event’ in the following, using the AUET2-CTEQ61L tune [
21
]. In the following sections,
the expression ‘ALPGEN’ refers to this version unless stated otherwise. Similar samples
are produced with ALPGEN v2.14 interfaced to PYTHIA v6.425 [
22
] using the
PERU-GIA2011C [
23
] tune.
For both ALPGEN samples, CTEQ61L [
24
] parton distribution
functions (PDFs) are employed. Signal samples are also generated with SHERPA v1.4.1
using the MEnloPS approach [
10
] and with MC@NLO v4.01 [
25
], interfaced to HERWIG,
both using the CT10 [
26
] PDF set. The program PHOTOS [
27
] is used to simulate QED
final state radiation (FSR) in the ALPGEN samples. QED-FSR simulation in SHERPA
is based on the YFS method [
28
]. ALPGEN and SHERPA matrix elements are generated
for up to five partons. The signal samples do not include Z + jets events produced via
VBF. Based on generator-level studies, the expected contribution of these events to the
measured cross sections is at the per-mille to per-cent level for the selections and kinematic
ranges explored in this paper and always significantly below the statistical and systematic
precision of the measurement.
Background samples from W + jets and Z (→ τ τ ) + jets final states are generated
sim-ilarly to the signal samples, using ALPGEN interfaced to HERWIG. The W + jets and
Z + jets samples are normalized globally to next-to-next-to-leading-order (NNLO) pQCD
inclusive Drell-Yan predictions as determined by the FEWZ [
29
] program using the
MSTW2008NNLO PDF set [
30
]. The uncertainties of about 5% are taken from an
en-velope of predictions using different PDF sets and factorization and renormalization scales,
as described in ref. [
31
]. Single-top-quark events are produced with AcerMC [
32
],
inter-faced to PYTHIA, using CTEQ61L PDFs. Diboson processes (W W , W Z and ZZ) are
simulated with HERWIG using the AUET2-LO* tune [
21
]. Reference cross sections for
single-top-quark and diboson processes are calculated using the MC@NLO generator with
the MSTW2008 PDF set [
30
]. The t¯
t samples used for the relative normalization of final
states in top-quark pair-production are generated with MC@NLO interfaced to HERWIG
and with POWHEG [
33
,
34
] interfaced to PYTHIA, both using the CT10 PDF set.
All samples are processed through the GEANT4-based simulation [
35
,
36
] of the
AT-LAS detector. The simulation includes the modelling of additional pp interactions in the
same and neighbouring bunch crossings (pile-up), with an average of nine interactions per
crossing, that matches the distribution of interactions per crossing measured in data.
4
Event selection
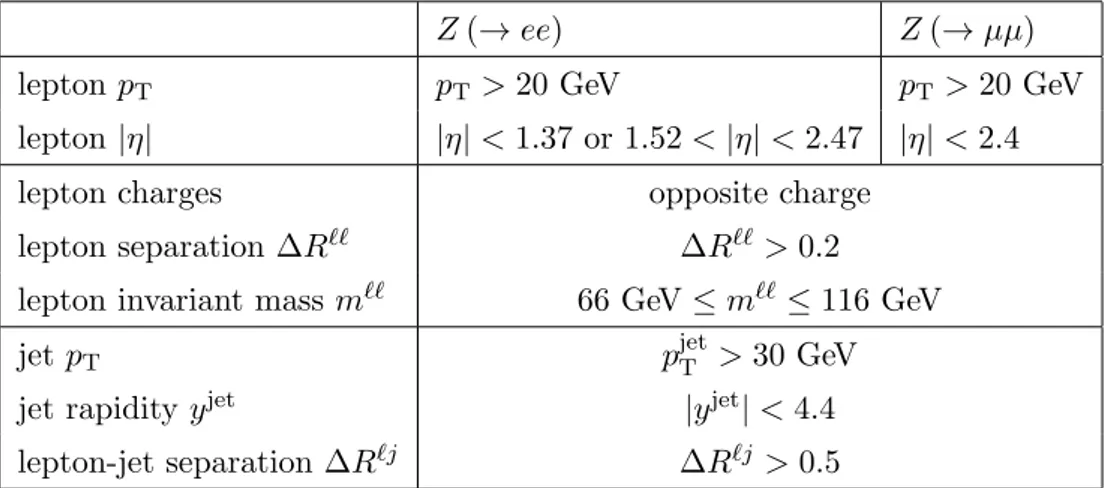
Table
1
summarizes the kinematic regions in which Z bosons and jets are selected. They
are defined to provide a good experimental coverage for the reconstruction of electrons,
JHEP07(2013)032
Z (→ ee)
Z (→ µµ)
lepton pT
pT
> 20 GeV
pT
> 20 GeV
lepton |η|
|η| < 1.37 or 1.52 < |η| < 2.47
|η| < 2.4
lepton charges
opposite charge
lepton separation ∆R
``∆R
``> 0.2
lepton invariant mass m
``66 GeV ≤ m
``≤ 116 GeV
jet p
Tp
jetT> 30 GeV
jet rapidity y
jet|y
jet| < 4.4
lepton-jet separation ∆R
`j∆R
`j> 0.5
Table 1. Summary of Z (→ ``) and jet selection criteria.
muons and jets in the event. Events with less than three tracks associated to the hard
scattering vertex, defined as the vertex with the highest p
Tsum of its associated tracks,
are discarded.
Electrons are reconstructed from clusters of energy in the electromagnetic calorimeter
matched to inner detector tracks. The electron candidates must have p
T> 20 GeV and
|η| < 2.47, excluding the transition region 1.37 < |η| < 1.52 between barrel and endcap
electromagnetic calorimeter sections, and pass the ‘medium’ identification criteria described
in ref. [
37
], re-optimized for 2011 conditions. No additional isolation requirement is applied,
since non-isolated electron candidates are already suppressed by the identification criteria.
Muon candidates are identified as tracks in the inner detector matched and combined with
track segments in the muon spectrometer [
38
]. They are required to have p
T> 20 GeV
and |η| < 2.4. In order to achieve a sufficient rejection of multi-jet events, muons are
required to be isolated: the scalar sum of the transverse momenta of tracks within a
cone of ∆R ≡
p(∆φ)
2+ (∆η)
2= 0.2 around the muon candidate must be less than
10% of the transverse momentum of the muon. All lepton pairs are required to have a
separation of ∆R
``> 0.2. The Z candidates are selected by requiring exactly two oppositely
charged leptons of the same flavour. Their invariant mass (m
``) must be within the range
66 GeV ≤ m
``≤ 116 GeV. With this selection, 1228767 Z (→ ee) and 1678500 Z (→ µµ)
candidate events are identified.
Jets are reconstructed using the anti-k
talgorithm [
39
] with a distance parameter
R = 0.4. The inputs to the jet algorithm are topological clusters of energy in the
calorime-ter [
40
]. The energies and directions of reconstructed jets in data and simulated events are
corrected for the presence of additional proton-proton interactions, the position of the
pri-mary interaction vertex, the measurement biases induced by calorimeter non-compensation,
additional dead material, and out-of-cone effects, using detector simulation and a
combi-nation of in-situ methods [
40
,
41
]. Jets are required to have a transverse momentum above
30 GeV and a rapidity of |y
jet| < 4.4. Jets closer than 0.5 in ∆R to a selected lepton are
removed. In order to reject jets from additional proton-proton interactions, the ‘jet vertex
fraction’ is used. This is defined as the p
Tsum of the tracks associated to the jet which
JHEP07(2013)032
are consistent with originating from the primary vertex divided by the p
Tsum of all tracks
associated to the jet. The jet vertex fraction is required to be greater than 0.75 for jets with
|η| < 2.4. The residual impact of additional proton-proton interactions on the distribution
of the jet observables has been checked to be correctly simulated such that the unfolded
cross sections are expected to be independent of the number of additional interactions.
With this definition, 191566 Z (→ ee) and 257169 Z (→ µµ) candidate events are selected
with at least one jet in the final state.
5
Background estimation
The selected data sample is expected to contain background events with two isolated leptons
(t¯
t, diboson and Z (→ τ τ ) events), with one isolated lepton (W → eν, W → µν and
single-top-quark production) and without isolated leptons (multi-jet events). The total
expected background fraction increases with the jet multiplicity (N
jet) from 2% (N
jet≥ 1)
to 20% (Njet
≥ 6). It is dominated by multi-jet processes, t¯
t and diboson events for
Z (+ ≤ 1 jet) and by t¯
t for larger jet multiplicities. The background is estimated using
simulated samples, with the exception of the multi-jet and t¯
t background contributions,
which are derived from data. For these data-driven background estimates, the shape of the
background contribution to each of the measured distributions is derived from a dedicated
background-enriched sample in data. The background-enriched samples have been selected
and normalized as described below.
The multi-jet background contribution in the Z (→ ee) + jets channel is estimated using
a multi-jet enriched data template with two electron candidates which both pass a ‘loose’
selection but fail to pass the medium identification requirements [
37
]. The dedicated trigger
used for the selection of this sample requires two clusters of energy in the electromagnetic
calorimeter with p
T> 20 GeV. This sample is dominated by jets misidentified as electrons
in the final state. The normalization of this sample to the multi-jet background expected
with medium requirements is extracted from a template fit in the invariant mass
distri-bution for medium electrons (m
ee) as follows: a single combined fit is performed of the
multi-jet template and the standard simulated signal and non-multi-jet background
tem-plates to the measured spectrum of the invariant mass for medium electrons in the extended
mass range 50 GeV < m
ee< 150 GeV in the inclusive selection. Systematic uncertainties
are assessed by varying the mass range and the binning in the fit, by using a different
generator (SHERPA instead of ALPGEN) for the signal template, by varying the electron
energy scale and resolution in the simulation and by allowing for a modification of the
shape of the mass distribution in the multi-jet enriched sample. The multi-jet background
to the measured inclusive jet multiplicities varies between (0.65 ± 0.23)% for Njet
≥ 1 and
(1.20 ± 0.44)% for N
jet≥ 6.
In the Z (→ µµ) + jets channel, heavy flavour production (with muons originating from
b- and c-quark decays) and decays-in-flight of pions and kaons are the primary source of
the multi-jet background, which is highly suppressed by the isolation requirement applied
to the muon candidates. The multi-jet template is derived from a data sample where both
muons fail the isolation requirement. The normalization factor is obtained by fitting the
JHEP07(2013)032
multi-jet template together with a template composed of the simulated signal and the
non-multijet background events that pass the signal selection to the spectrum of the invariant
mass of isolated muons (m
µµ) measured in data in the range 40 GeV < m
µµ< 150 GeV. In
contrast to the Z (→ ee) + jets channel, the creation of the template and the normalization
is performed separately for Njet
≥ 0, N
jet≥ 1 and N
jet≥ 2. The normalization factor
derived for N
jet≥ 2 is used for all higher jet multiplicities. The systematic uncertainty is
assessed by replacing the multi-jet template with one formed from muons passing a loose
isolation cut but failing the tight cut used to select signal muons. Multi-jet fractions vary
between (0.25 ± 0.04)% for N
jet≥ 1 and (2.2 ± 2.2)% for N
jet≥ 6.
The t¯
t background contributions in the Z (→ ``) + jets samples are dominated by events
where both W bosons decay leptonically. Since the kinematic properties of the jets in the
final state are independent of the flavours of the two leptons, final states with one
elec-tron and one muon can be used to model the t¯
t background contributions to Z (→ ee)
and Z (→ µµ) selections. The t¯
t-enriched sample is selected from data in the e
±µ
∓final
state with kinematic requirements analogous to the Z (→ ``) + jets selection. The
dedi-cated trigger used for the selection of this sample requires an electron with p
T> 10 GeV
and a muon with p
T> 6 GeV.
For each of the observables, the number of W + jets,
Z + jets and diboson events expected from simulation in the t¯
t-enriched sample is
sub-tracted. The normalization from the e
±µ
∓to the e
+e
−and µ
+µ
−final states is calculated
from t¯
t samples generated with MC@NLO+HERWIG and with POWHEG+PYTHIA,
sep-arately for each jet multiplicity. Systematic uncertainties on the normalization arise from
the choice of the generator, uncertainty on the lepton trigger, reconstruction and
iden-tification efficiency (see section
8
) and on the electroweak background subtraction. The
t¯
t fractions vary between (0.80 ± 0.05)% for Z (→ ee) + ≥ 1 jet and (18.6 ± 7.0)% for
Z (→ ee) + ≥ 6 jets and between (0.74 ± 0.03)% for Z (→ µµ) + ≥ 1 jet and (18.1 ± 5.3)%
for Z (→ µµ) + ≥ 6 jets.
6
Detector-level results
Measured and expected distributions of the jet observables have been compared at the
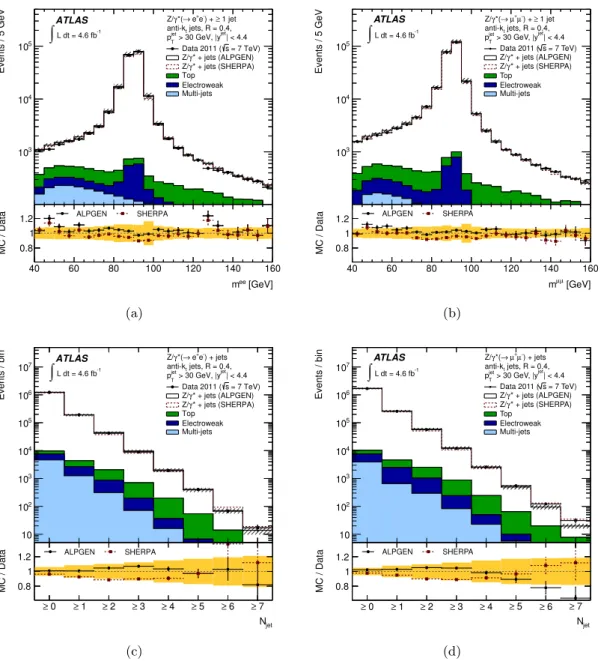
re-construction level, separately in the electron and muon channels. As an example, figure
1
shows the dilepton invariant mass in events with at least one jet in the final state, as well as
the inclusive jet multiplicity. For the signal, both ALPGEN and SHERPA expectations are
shown. In this figure, W → eν, Z (→ τ τ ) and diboson processes are summarized as
‘elec-troweak’ background and t¯
t and single-top processes are referred to as ‘top’ background.
For figures
1
(a) and
1
(b), the selection has exceptionally been extended beyond the
fidu-cial invariant mass range, in order to demonstrate in addition the reasonable agreement
between data and expectations for dilepton mass sideband regimes with larger background
fractions. Table
2
shows, for the electron and muon channels separately, the observed
num-ber of events for the different jet multiplicities in the final state compared to expectations
for signal (ALPGEN) and background processes. The combined statistical and systematic
uncertainties on the total expectation increases from 6% to 30% with increasing jet
multi-plicity. The data are consistent with predictions by the generators ALPGEN and SHERPA,
JHEP07(2013)032
Z (→ ee) channel≥ 0 jets ≥ 1 jet ≥ 2 jets ≥ 3 jets ≥ 4 jets ≥ 5 jets ≥ 6 jets ≥ 7 jets Z (→ ee) 1229000 188000 42300 8900 1810 339 56 9.2 W → eν 450 135 36.4 9.5 0.52 < 0.5 < 0.5 < 0.5 Z (→ τ τ ) 648 106 24.4 5.6 1.41 0.19 < 0.1 < 0.1 diboson 1830 1164 492 109 18.5 3.0 0.27 0.03 t¯t, single top 2120 1670 1187 508 163 48 13.0 4.4 multi-jet 6400 1250 310 71 16.1 3.5 0.81 0.3 total expected 1239000 193000 44300 9600 2010 393 70 13.9 data (4.6 fb−1) 1228767 191566 42358 8941 1941 404 68 17 Z (→ µµ) channel
≥ 0 jets ≥ 1 jet ≥ 2 jets ≥ 3 jets ≥ 4 jets ≥ 5 jets ≥ 6 jets ≥ 7 jets Z (→ µµ) 1710000 260000 56800 11700 2300 430 75 12.1 W → µν 123 42.1 12.0 3.2 < 0.5 < 0.5 < 0.5 < 0.5 Z (→ τ τ ) 1069 152 36.1 7.5 1.56 0.29 0.09 0.09 diboson 2440 1620 682 149 25.8 3.9 0.41 0.10 t¯t, single top 2690 2130 1500 639 194 54 17.2 7.3 multi-jet 3900 650 295 83 23 5.7 2.1 0.18 total expected 1720000 265000 59400 12600 2540 490 95 19.8 data (4.6 fb−1) 1678500 257169 56506 12019 2587 552 122 31 Table 2. Numbers of events expected and observed in data that pass the Z (→ ee) + jets and Z (→ µµ) + jets selections as a function of the inclusive jet multiplicity. The expected numbers are rounded according to the combined statistical and systematic uncertainty. ALPGEN has been used to simulate the signal events.
which gives confidence that the simulated samples, which are used in the unfolding, provide
a reasonable description of the event kinematics and of the detector response.
7
Correction for detector effects and combination of channels
The cross sections in this article are quoted at the particle level, which corresponds to
‘dressed’ muons and electrons, calculated using final-state leptons from the Z decay for
which collinear radiation in a cone of ∆R < 0.1 is added to the lepton four-momentum.
Particle jets are clustered from all final-state particles (decay length cτ > 10 mm) excluding
the dressed Z decay products.
The phase-space requirements are the same as in the
selection at reconstruction level (see table
1
).
After subtracting the expected background contributions, the data distributions in
each channel are unfolded to the particle level using an iterative technique [
42
]. Response
matrices are calculated for each observable, using Z + jets samples generated with
ALP-GEN. Before entering the iterative process, the data are corrected for the fraction of
recon-structed events in the ALPGEN sample which do not match to a particle-level equivalent.
The number of iterations, typically two or three, is optimized for each observable using a
χ
2comparison of generated and unfolded reconstructed Z + jets events from the generators
SHERPA and MC@NLO.
JHEP07(2013)032
[GeV] ee m 40 60 80 100 120 140 160 Events / 5 GeV 3 10 4 10 5 10 ATLAS -1 L dt = 4.6 fb∫
1 jet ≥ ) + -e + e → *( γ Z/ jets, R = 0.4, t anti-k | < 4.4 jet > 30 GeV, |y jet T p = 7 TeV) s Data 2011 ( * + jets (ALPGEN) γ Z/ * + jets (SHERPA) γ Z/ Top Electroweak Multi-jets [GeV] ee m 40 60 80 100 120 140 160 MC / Data 0.8 1 1.2 ALPGEN SHERPA (a) [GeV] µ µ m 40 60 80 100 120 140 160 Events / 5 GeV 3 10 4 10 5 10 -1 L dt = 4.6 fb∫
1 jet ≥ ) + -µ + µ → *( γ Z/ jets, R = 0.4, t anti-k | < 4.4 jet > 30 GeV, |y jet T p = 7 TeV) s Data 2011 ( * + jets (ALPGEN) γ Z/ * + jets (SHERPA) γ Z/ Top Electroweak Multi-jets ATLAS [GeV] µ µ m 40 60 80 100 120 140 160 MC / Data 0.8 1 1.2 ALPGEN SHERPA (b) jet N ≥ 0 ≥ ≥ 1 ≥ 2 ≥ 3 ≥ 4 ≥ 5 ≥ 6 ≥ 7 Events / bin 10 2 10 3 10 4 10 5 10 6 10 7 10∫
L dt = 4.6 fbATLAS -1 ) + jets -e + e → *( γ Z/ jets, R = 0.4, t anti-k | < 4.4 jet > 30 GeV, |y jet T p = 7 TeV) s Data 2011 ( * + jets (ALPGEN) γ Z/ * + jets (SHERPA) γ Z/ Top Electroweak Multi-jets jet N 0 ≥ ≥ 1 ≥ 2 ≥ 3 ≥ 4 ≥ 5 ≥ 6 ≥ 7 MC / Data 0.8 1 1.2 ALPGEN SHERPA (c) jet N 0 ≥ ≥ 1 ≥ 2 ≥ 3 ≥ 4 ≥ 5 ≥ 6 ≥ 7 Events / bin 10 2 10 3 10 4 10 5 10 6 10 7 10∫
L dt = 4.6 fb-1 ) + jets -µ + µ → *( γ Z/ jets, R = 0.4, t anti-k | < 4.4 jet > 30 GeV, |y jet T p = 7 TeV) s Data 2011 ( * + jets (ALPGEN) γ Z/ * + jets (SHERPA) γ Z/ Top Electroweak Multi-jets ATLAS jet N 0 ≥ ≥ 1 ≥ 2 ≥ 3 ≥ 4 ≥ 5 ≥ 6 ≥ 7 MC / Data 0.8 1 1.2 ALPGEN SHERPA (d)Figure 1. Numbers of events observed in data and predicted in simulation that pass the Z (→ ee) + jets and Z (→ µµ) + jets selection as a function of the invariant mass of the Z can-didate, (a) mee and (b) mµµ, for events with at least one jet with pjetT > 30 GeV and |yjet| < 4.4, and as a function of the inclusive jet multiplicity, Njet, in (c) di-electron and (d) di-muon events.
The individual contributions of the various backgrounds are also shown, as detailed in the legend. The hatched band corresponds to the combined statistical and systematic uncertainty on the pre-diction, obtained using ALPGEN to model the Z + jets process. The error bars on each data point show the statistical uncertainty. The bottom panel shows the corresponding MC/data ratio. The shaded band corresponds to the total systematic uncertainty and the error bars to the statistical uncertainty on the MC/data ratio.
The uncertainties from the limited number of events in data are propagated into
pseudo-JHEP07(2013)032
experimental spectra are generated by fluctuating the content of each bin according to
the statistical uncertainty. The unfolding procedure is applied to each pseudo-experiment,
and the r.m.s. of the results is taken as the statistical uncertainty. Systematic
uncertain-ties arising from the unfolding procedure are estimated by comparing with an iterative
unfolding based on response matrices and corrections derived from SHERPA. The
statisti-cal uncertainties of the response matrices are propagated into systematic uncertainties on
the unfolded cross sections using pseudo-experiments.
The cross sections measured in the electron and muon channels are extrapolated to a
common phase-space region, derived from table
1
by extending the η range of the leptons
to |η
lep| < 2.5, using global acceptance corrections derived from ALPGEN Z + jets Monte
Carlo samples, reweighted to the CT10 PDF set. The corrections are of the order of
14% and 5% for the electron and muon channel, respectively. Systematic uncertainties
are estimated by comparing with corrections obtained using the corresponding SHERPA
Z + jets sample and the original ALPGEN sample. Total uncertainties on the corrections
are calculated as the quadratic sum of the statistical and systematic uncertainties and
amount to 0.2–0.3%. The extrapolated cross sections measured in the electron and muon
channels are in agreement.
For each observable, the extrapolated cross sections are combined using the averaging
procedure introduced in ref. [
43
], which accounts for systematic uncertainties (bin-to-bin
correlated and uncorrelated) proportional to the central values of the respective cross
sec-tions. The weights of the individual cross-section measurements (µ
ik
) in channel k (ee or
µµ) and bin i in the combined cross sections (m
i) are derived by minimizing the following
χ
2function [
43
]:
χ
2(m, b) =
X
k,i[m
i−
P
jγ
j,kim
ib
j− µ
ik]
2(δ
stat,ki)
2µ
i k(m
i−
P
jγ
j,kim
ibj
) + (δ
iuncor,km
i)
2+
X
jb
2j,
(7.1)
where b
jdenote the shift introduced by a correlated systematic error source j normalized
to its respective standard deviation. The relative statistical and uncorrelated systematic
uncertainties on µ
ikare denoted by δ
istat,kand δ
iuncor,kand the variable γ
j,kiquantifies the
influence of the correlated systematic error source j on the measurement i in the channel k.
The following bin-to-bin correlated systematic sources are taken into account:
nor-malization of the multi-jet background, lepton energy scale and resolution, lepton
recon-struction, identification and trigger efficiencies and normalization of t¯
t, electroweak and
single-top background contributions, the latter three treated as correlated between the
channels. Bin-to-bin correlated systematic sources which have the same impact in both
channels do not enter in the combination procedure. These are the individual components
of the jet energy scale, the jet energy resolution, the luminosity, the unfolding procedure,
and the extrapolation factor. The uncertainties from these sources on the combined result
are taken as the weighted average of the corresponding uncertainties on the electron and
muon measurements.
8
Systematic uncertainties
The kinematic ranges and the binning are chosen such that the statistical uncertainty of
the measurement is comparable to or smaller than the systematic uncertainty. The relative
JHEP07(2013)032
systematic uncertainties on the cross sections measured in each channel are derived for each
observable by propagating systematic shifts from a set of independent sources through the
response matrices and the subtracted background contributions into the unfolded data.
The resulting systematic uncertainties for each source in each channel are symmetrized in
order to mitigate the impact of statistical fluctuations and are combined in the averaging
procedure.
The uncertainty on the jet energy scale (JES), determined from the combination of
methods based on MC and in-situ techniques used to determine the scale, constitutes
the dominant component of the total systematic uncertainty. It is propagated through the
analysis using 14 independent components fully correlated in p
jetT[
40
,
41
]. They account for
uncertainties on the different in-situ measurements which enter the jet calibration, on the
jet flavour and on the impact of pile-up and close-by jets. The uncertainty on the jet energy
resolution, derived from a comparison of the resolution obtained in data and in simulated
dijet events, is propagated into the final cross section by varying the energy resolution of
the simulated jets. Uncertainties on the normalization of the background expectations, for
simulated and data-driven background contributions respectively, are treated as correlated
between bins and are propagated to the measured cross sections by unfolding the data
distributions after the subtraction of the systematically shifted background. The statistical
uncertainties of the background contributions are added quadratically to the statistical
uncertainties of the data. The uncertainty from the unfolding process is derived from
the different components discussed in section
7
, which are considered to be uncorrelated.
Systematic uncertainties on electron and muon trigger efficiencies, energy scale, resolution,
reconstruction and identification efficiencies are derived from the comparison of
tag-and-probe results in data and simulated events [
37
,
38
].
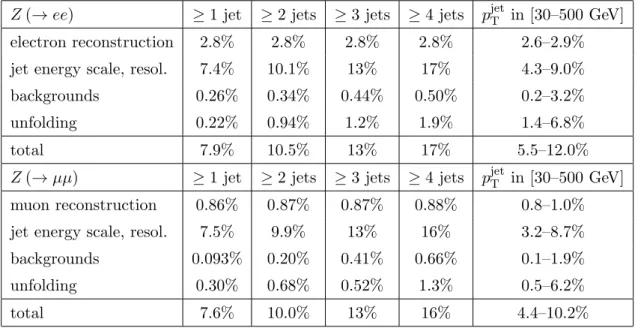
Table
3
summarizes the systematic uncertainties on the Z + jets cross sections as a
function of the inclusive jet multiplicity and of p
jetTof the leading jet separately for the
electron and muon channels. The uncertainty on the integrated luminosity of 1.8%
trans-lates into comparable uncertainties on the measured cross sections. The total uncertainties
on the inclusive jet cross sections range from 8% for Njet
≥ 1 to 16–17% for N
jet≥ 4,
dominated by the JES uncertainty.
The uncertainty on cross-section ratios, R≥(n+1)/≥n,
3for successive jet multiplicities
n is significantly reduced due to the strong correlations between the lepton and jet
recon-struction and calibration uncertainties in neighbouring jet bins and amounts to a total of
3–4% for R
≥2/≥1and higher multiplicities, which are of interest in this article, dominated
by the residual JES uncertainty. The large JES uncertainties in the forward region
prop-agate into uncertainties on the unfolded cross sections at the level of 20% (30%) for jet
rapidities of |y
jet| = 3.0 (4.0). This is reflected in large jet energy scale uncertainties on
the cross section for events with large rapidity distance (|∆y
jj|) between the leading jets,
which combine with the unfolding uncertainties to total uncertainties of 20% (50%) for
|∆y
jj| = 3.0 (4.0).
3For simplicity, n is used in the subscript instead of N jet.
JHEP07(2013)032
Z (→ ee)
≥ 1 jet
≥ 2 jets
≥ 3 jets
≥ 4 jets
p
jetTin [30–500 GeV]
electron reconstruction
2.8%
2.8%
2.8%
2.8%
2.6–2.9%
jet energy scale, resol.
7.4%
10.1%
13%
17%
4.3–9.0%
backgrounds
0.26%
0.34%
0.44%
0.50%
0.2–3.2%
unfolding
0.22%
0.94%
1.2%
1.9%
1.4–6.8%
total
7.9%
10.5%
13%
17%
5.5–12.0%
Z (→ µµ)
≥ 1 jet
≥ 2 jets
≥ 3 jets
≥ 4 jets
p
jetTin [30–500 GeV]
muon reconstruction
0.86%
0.87%
0.87%
0.88%
0.8–1.0%
jet energy scale, resol.
7.5%
9.9%
13%
16%
3.2–8.7%
backgrounds
0.093%
0.20%
0.41%
0.66%
0.1–1.9%
unfolding
0.30%
0.68%
0.52%
1.3%
0.5–6.2%
total
7.6%
10.0%
13%
16%
4.4–10.2%
Table 3. Systematic uncertainties on the cross sections for Z (→ ee) + jets and Z (→ µµ) + jets as a function of the inclusive jet multiplicity and as a function of the transverse momentum, pjetT , of the leading jet for events with at least one jet with pjetT > 30 GeV and |yjet| < 4.4. The rows labelled
‘electron reconstruction’ and ‘muon reconstruction’ include uncertainties on trigger, reconstruction and identification, energy scale and resolution.
9
Theoretical predictions
Five sets of fixed-order calculations at NLO pQCD for the production of Z (+ ≥ 0 jets)
up to Z (+ ≥ 4 jets) are computed using the BlackHat+SHERPA program [
5
–
7
]. CT10
PDFs [
26
] are employed and renormalization and factorization scales are set to H
T/2, where
HT
is defined event-by-event as the scalar sum of the pT
of all stable particles/partons. The
anti-k
talgorithm with R = 0.4 is used to reconstruct jets at the parton level. Systematic
uncertainties on the predictions related to PDF uncertainties are computed from the 52
CT10 eigenvectors at 68% confidence level [
26
]. The uncertainties on the cross sections
increase from 1% for (N
jet≥ 1) to 3% for (N
jet≥ 4) and from 1% to 5% with p
jetTof
the leading jet between 30 GeV and 500 GeV. Additional changes in the PDFs due to
the variation of the input value for the strong coupling constant αs
at the Z-boson mass
scale by ±0.001 around its nominal value α
s(m
Z) = 0.118 introduce uncertainties on the
predicted cross sections in the range of 1% to 3% for Z (+ (1 − 4) jets). These are added
in quadrature to the PDF uncertainties. Scale uncertainties are estimated by variations of
the renormalization and factorization scales to one half and two times the nominal scale.
The scale uncertainties for different parton multiplicities are assumed to be uncorrelated.
For inclusive calculations, the scale variations translate into variations of the cross section
by 4% to 13% as N
jetincreases and by 2% to 18% with increasing p
jetTof the leading jet.
For exclusive final states, the scale uncertainties are calculated using the prescription of
ref. [
44
]. For comparison, the theory/data ratios presented in section
10
also show the scale
uncertainty resulting from a simple variation of the renormalization and factorization scales
JHEP07(2013)032
by a factor of two, assuming the uncertainties to be correlated for different parton
multi-plicities. The scale uncertainties constitute the dominant uncertainties in most kinematic
regions.
The NLO fixed-order calculations at the parton level are corrected to the particle level
for the underlying event and for effects of fragmentation and of QED final-state radiation
(QED-FSR). Parton-to-hadron correction factors (δ
had) approximately account for
non-perturbative contributions from the underlying event and fragmentation into particles.
For each observable, the correction factor is estimated using simulated Z + jets samples,
produced with ALPGEN with the HERWIG cluster fragmentation in which JIMMY models
the underlying event using the AUET2-CTEQ61L [
21
] tune. It is calculated as the
bin-by-bin ratio of the nominal distribution at the particle level to the one obtained by turning
off both the interactions between proton remnants and the fragmentation in the simulated
samples. The non-perturbative corrections are also computed using ALPGEN samples,
this time interfaced to PYTHIA, where the correction corresponds to the combined effect
of string fragmentation and of the underlying event predicted by the PERUGIA2011C [
23
]
tune. The difference is taken as a systematic uncertainty. The combined nominal correction
is 7% in the low p
jetTregion and decreases with increasing p
jetTtowards zero. The correction
factors for the inclusive Njet
distributions are about 3–4%. Nonperturbative corrections
for quantities calculated with several jets include implicitly the corrections for all jets. The
statistical and the symmetrized systematic uncertainties on δ
hadare added in quadrature
to the total uncertainty from the BlackHat+SHERPA calculation.
The QED-FSR correction factors (δ
QED) are determined using Z + jets samples
pro-duced with the ALPGEN generator, interfaced to PHOTOS [
27
], by calculating the
ex-pected cross sections both with the lepton four-momentum before final-state photon
radi-ation (‘Born level’), and with dressed leptons. The correction factors are about 2% for the
electron and muon channels. They do not show a significant Njet
dependence and are stable
with respect to the jet rapidity and for large jet transverse momentum. Systematic
un-certainties are derived by comparing with δ
QEDobtained using a Z + jets sample produced
with the SHERPA generator [
9
] which generates QED-FSR using the YSF method [
28
].
The differences between the two predictions are usually at the per-mille level.
When comparing the measured ratios of differential cross sections to the inclusive
Z → `` cross section to the BlackHat+SHERPA expectations, in the latter case, the
differential cross sections from the fixed-order calculations are divided by the inclusive cross
section, obtained from a separate BlackHat+SHERPA calculation of the Z (+ ≥ 0 jets)
process.
10
Results and discussion
For each observable, the spectrum measured in data is unfolded to the particle level. After
extrapolation and combination of electron and muon channels, the results are compared
with calculations from BlackHat+SHERPA, corrected to the particle level, and with
pre-dictions by ALPGEN, SHERPA and MC@NLO. The generators ALPGEN and SHERPA
employ matrix elements for up to five partons, supplemented by parton shower. Both
JHEP07(2013)032
parts of the generation process can be tuned to different extents. In contrast, MC@NLO
generates the Drell-Yan process at NLO precision, which includes the real emission of one
additional parton. Higher parton multiplicities are generated by the parton shower. Since
this generator is often used to model inclusive processes, it is of interest, to what extent
the recoil of the Z against a jet is modelled correctly. Inclusive and differential cross
sec-tions for Z (→ ``) + ≥ n jets are compared with BlackHat+SHERPA fixed-order pQCD
calculations for Z + ≥ n partons, which provide a NLO estimate for the respective parton
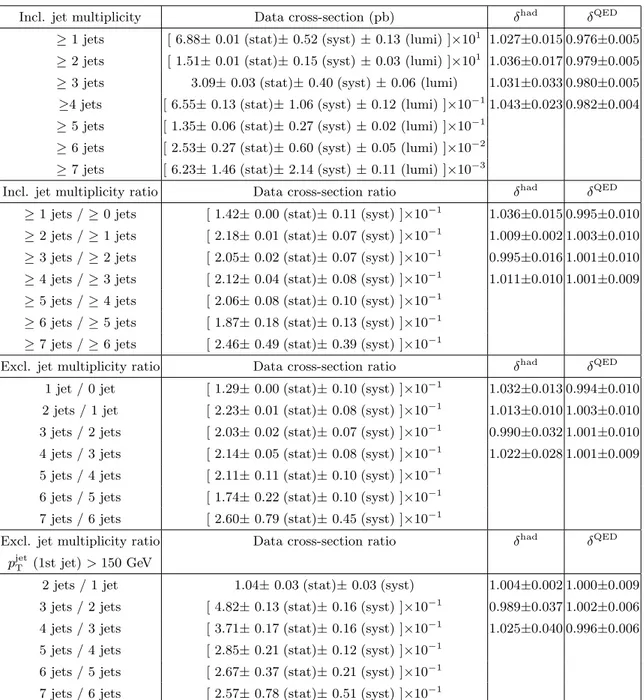
multiplicity, including the real emission of one additional parton. Measured cross sections
as a function of the jet multiplicity and their ratios are detailed in table
4
. Tabulated
values of all observed results are available in the Durham HEP database.
410.1
Jet multiplicities
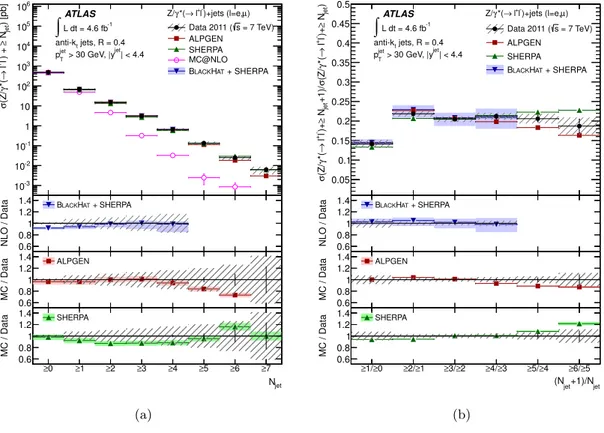
Figure
2
(a) presents the absolute cross sections for inclusive jet multiplicities for up to
seven hadronic jets in the final state. The ratios R
≥(n+1)/≥nof cross sections for two
successive multiplicities, presented in figure
2
(b), provide a more precise measurement of
the QCD process, due to the cancellation of part of the systematic uncertainty. The data are
consistent with BlackHat+SHERPA calculations and with predictions of the generators
ALPGEN and SHERPA. The MC@NLO parton shower underestimates the observed rate
for additional jet emission by a factor of two, which leads to large offsets to the data for
higher jet multiplicities. For this reason, in subsequent figures the MC@NLO predictions
are only shown for Z (→ ``) + ≥ 1 jet selections, where the parton corresponding to the
NLO real emission can be expected to yield a reasonable description of the kinematics.
Exclusive jet multiplicities at the LHC are expected to be described by means of
two benchmark patterns, ‘staircase scaling’ with R
(n+1)/nconstant and ‘Poisson scaling’
with R
(n+1)/ninversely proportional to n [
3
,
45
], which provide limiting cases for certain
kinematic conditions. While for high multiplicities a flat exclusive jet multiplicity ratio is
derived from the non-abelian nature of QCD FSR, at low multiplicity the jet multiplicity
ratio is flat due to the combined effect of a Poisson-distributed multiplicity distribution and
parton density suppression [
3
]. The emission of the first parton should be suppressed more
strongly than the subsequent parton emissions. The underlying Poisson scaling is expected
to emerge after introducing large scale differences between the core process (Z (+1 jet))
and the p
jetTof the second leading jet. Two selections are chosen to test the two benchmark
scenarios: (a) the standard Z + jets selection and (b) events where the leading jet has a
transverse momentum in excess of 150 GeV.
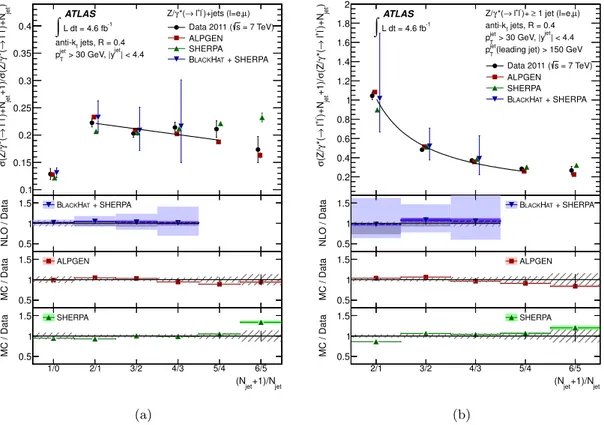
Figure
3
(a) presents the ratios R
(n+1)/nof cross sections for two successive exclusive
multiplicities for the standard Z + jets selection. The relatively large scale uncertainties on
the pQCD predictions result from the Stewart-Tackmann prescription [
44
], in which the
scale variations are assumed to be uncorrelated across the jet multiplicities, and reduce
strongly the predictive power of the theory for exclusive final states. For comparison,
the total uncertainty calculated using a naive scale variation, and a reduced uncertainty
4A complete set of tables with the full results are available at the Durham HepData repository,
JHEP07(2013)032
Incl. jet multiplicity Data cross-section (pb) δhad δQED
≥ 1 jets [ 6.88± 0.01 (stat)± 0.52 (syst) ± 0.13 (lumi) ]×101 1.027±0.015 0.976±0.005 ≥ 2 jets [ 1.51± 0.01 (stat)± 0.15 (syst) ± 0.03 (lumi) ]×101 1.036±0.017 0.979±0.005 ≥ 3 jets 3.09± 0.03 (stat)± 0.40 (syst) ± 0.06 (lumi) 1.031±0.033 0.980±0.005 ≥4 jets [ 6.55± 0.13 (stat)± 1.06 (syst) ± 0.12 (lumi) ]×10−11.043±0.023 0.982±0.004 ≥ 5 jets [ 1.35± 0.06 (stat)± 0.27 (syst) ± 0.02 (lumi) ]×10−1
≥ 6 jets [ 2.53± 0.27 (stat)± 0.60 (syst) ± 0.05 (lumi) ]×10−2 ≥ 7 jets [ 6.23± 1.46 (stat)± 2.14 (syst) ± 0.11 (lumi) ]×10−3
Incl. jet multiplicity ratio Data cross-section ratio δhad δQED ≥ 1 jets / ≥ 0 jets [ 1.42± 0.00 (stat)± 0.11 (syst) ]×10−1 1.036±0.015 0.995±0.010 ≥ 2 jets / ≥ 1 jets [ 2.18± 0.01 (stat)± 0.07 (syst) ]×10−1 1.009±0.002 1.003±0.010 ≥ 3 jets / ≥ 2 jets [ 2.05± 0.02 (stat)± 0.07 (syst) ]×10−1 0.995±0.016 1.001±0.010 ≥ 4 jets / ≥ 3 jets [ 2.12± 0.04 (stat)± 0.08 (syst) ]×10−1 1.011±0.010 1.001±0.009 ≥ 5 jets / ≥ 4 jets [ 2.06± 0.08 (stat)± 0.10 (syst) ]×10−1
≥ 6 jets / ≥ 5 jets [ 1.87± 0.18 (stat)± 0.13 (syst) ]×10−1 ≥ 7 jets / ≥ 6 jets [ 2.46± 0.49 (stat)± 0.39 (syst) ]×10−1
Excl. jet multiplicity ratio Data cross-section ratio δhad δQED
1 jet / 0 jet [ 1.29± 0.00 (stat)± 0.10 (syst) ]×10−1 1.032±0.013 0.994±0.010 2 jets / 1 jet [ 2.23± 0.01 (stat)± 0.08 (syst) ]×10−1 1.013±0.010 1.003±0.010 3 jets / 2 jets [ 2.03± 0.02 (stat)± 0.07 (syst) ]×10−1 0.990±0.032 1.001±0.010 4 jets / 3 jets [ 2.14± 0.05 (stat)± 0.08 (syst) ]×10−1 1.022±0.028 1.001±0.009 5 jets / 4 jets [ 2.11± 0.11 (stat)± 0.10 (syst) ]×10−1
6 jets / 5 jets [ 1.74± 0.22 (stat)± 0.10 (syst) ]×10−1 7 jets / 6 jets [ 2.60± 0.79 (stat)± 0.45 (syst) ]×10−1
Excl. jet multiplicity ratio Data cross-section ratio δhad δQED pjetT (1st jet) > 150 GeV
2 jets / 1 jet 1.04± 0.03 (stat)± 0.03 (syst) 1.004±0.002 1.000±0.009 3 jets / 2 jets [ 4.82± 0.13 (stat)± 0.16 (syst) ]×10−1 0.989±0.037 1.002±0.006 4 jets / 3 jets [ 3.71± 0.17 (stat)± 0.16 (syst) ]×10−1 1.025±0.040 0.996±0.006 5 jets / 4 jets [ 2.85± 0.21 (stat)± 0.12 (syst) ]×10−1
6 jets / 5 jets [ 2.67± 0.37 (stat)± 0.21 (syst) ]×10−1 7 jets / 6 jets [ 2.57± 0.78 (stat)± 0.51 (syst) ]×10−1
Table 4. Combined inclusive Z (→ ``) + jets cross sections per lepton flavour and their ratios and exclusive cross-section ratios for various preselections measured in data together with the corresponding non-perturbative corrections δhad and δQED. The cross sections are quoted with respect to a phase-space region defined by Z candidates constructed from opposite-sign leptons with pT > 20 GeV, |η| < 2.5, ∆R`` > 0.2 and 66 GeV ≤ m`` ≤ 116 GeV and for jets with
pjetT > 30 GeV, |yjet| < 4.4 and ∆R`j> 0.5.
that does not include any scale uncertainty are also shown. The data are consistent with
the central values of the BlackHat+SHERPA calculations and with predictions by the
generators ALPGEN and SHERPA. The cross-section ratios show an approximately linear
dependence on the jet multiplicity with a small slope. A linear fit R
(n+1)/n= R
0+
dRdn·
JHEP07(2013)032
) [pb] jet N ≥ ) + - l + l → *( γ (Z/ σ -3 10 -2 10 -1 10 1 10 2 10 3 10 4 10 5 10 6 10 = 7 TeV) s Data 2011 ( ALPGEN SHERPA MC@NLO + SHERPA AT H LACK BATLAS Z/γ*(→ l+l-)+jets (l=e,µ)
-1 L dt = 4.6 fb
∫
jets, R = 0.4 t anti-k | < 4.4 jet > 30 GeV, |y jet T p 0 ≥ ≥1 ≥2 ≥3 ≥4 ≥5 ≥6 ≥7 NLO / Data 0.60.8 1 1.2 1.4 BLACKHAT + SHERPA 0 ≥ ≥1 ≥2 ≥3 ≥4 ≥5 ≥6 ≥7 MC / Data 0.60.8 1 1.2 1.4 ALPGEN jet N 0 ≥ ≥1 ≥2 ≥3 ≥4 ≥5 ≥6 ≥7 MC / Data 0.60.8 1 1.2 1.4 SHERPA (a) ) jet N ≥ )+ - l + l → *( γ (Z/ σ +1)/ jet N ≥ )+ - l + l → *( γ (Z/ σ 0.05 0.1 0.15 0.2 0.25 0.3 0.35 0.4 0.45 0.5 = 7 TeV) s Data 2011 ( ALPGEN SHERPA + SHERPA AT H LACK BATLAS Z/γ*(→ l+l-)+jets (l=e,µ)
-1 L dt = 4.6 fb
∫
jets, R = 0.4 t anti-k | < 4.4 jet > 30 GeV, |y jet T p -1 ≥ 0/ ≥ ≥1/≥0 ≥2/≥1 ≥3/≥2 ≥4/≥3 ≥5/≥4 NLO / Data 0.60.8 1 1.2 1.4 BLACKHAT + SHERPA 0 ≥ 1/ ≥ ≥2/≥1 ≥3/≥2 ≥4/≥3 ≥5/≥4 ≥6/≥5 MC / Data 0.60.8 1 1.2 1.4 ALPGEN jet +1)/N jet (N 0 ≥ 1/ ≥ ≥2/≥1 ≥3/≥2 ≥4/≥3 ≥5/≥4 ≥6/≥5 MC / Data 0.60.8 1 1.2 1.4 SHERPA (b)Figure 2. (a) Measured cross section for Z (→ ``) + jets as a function of the inclusive jet multiplicity, Njet, and (b) ratio of cross sections for successive inclusive jet multiplicities. The data are compared
to NLO pQCD predictions from BlackHat+SHERPA corrected to the particle level, and the ALPGEN, SHERPA and MC@NLO event generators (see legend for details). The error bars indicate the statistical uncertainty on the data, and the hatched (shaded) bands the statistical and systematic uncertainties on data (prediction) added in quadrature.
n of the observed multiplicity ratio starting with R
2/1yields R0
= 0.232 ± 0.009 and
dR/dn = −0.011 ± 0.003. The uncertainties include a systematic contribution, derived
from a series of fits to systematic variations of the multiplicity ratio. The flat staircase
pattern provides an acceptable approximation of the observed scaling behaviour for the
standard Z + jets selection. The observation is consistent with results presented in [
15
] on
the smaller data set collected in 2010.
Figure
3
(b) presents the exclusive jet multiplicity ratio for events where the leading
jet has a transverse momentum in excess of 150 GeV. The observed ratio R
(n+1)/nis now
steeply increasing towards low jet multiplicities, a pattern described by the central values of
the BlackHat+SHERPA calculations, by the generator ALPGEN and approximately also
by SHERPA. The observed cross-section ratios have been fitted with a pattern expected
from a Poisson-distributed jet multiplicity with the expectation value ¯
n, R
(n+1)/n=
nn¯.
The Poisson scaling provides a good overall description of the jet multiplicity observed in
data for the selected kinematic regime, with ¯
n = 1.02±0.04, where the uncertainty includes
statistical and systematic components.
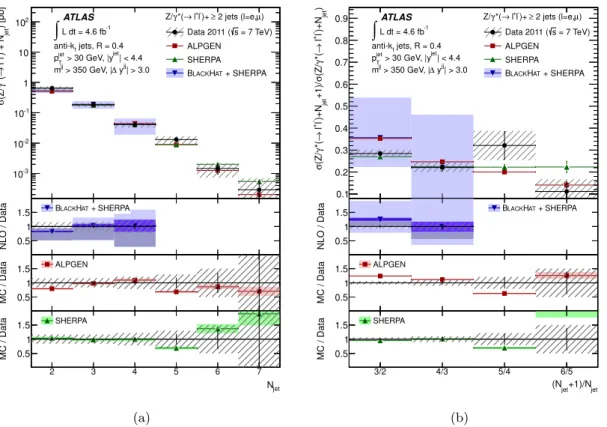
The scaling pattern is also investigated for a preselection typically employed in the
selection of particles produced via vector boson fusion (VBF). Figure
4
presents the
abso-JHEP07(2013)032
) jet )+N - l + l → *( γ (Z/ σ +1)/ jet )+N - l + l → *( γ (Z/ σ 0.1 0.15 0.2 0.25 0.3 0.35 0.4 Data 2011 (s = 7 TeV) ALPGEN SHERPA + SHERPA AT H LACK BATLAS Z/γ*(→ l+l-)+jets (l=e,µ)
-1 L dt = 4.6 fb
∫
jets, R = 0.4 t anti-k | < 4.4 jet > 30 GeV, |y jet T p 0/-1 1/0 2/1 3/2 4/3 5/4 NLO / Data 0.5 1 1.5 BLACKHAT + SHERPA 1/0 2/1 3/2 4/3 5/4 6/5 MC / Data 0.5 1 1.5 ALPGEN jet +1)/N jet (N 1/0 2/1 3/2 4/3 5/4 6/5 MC / Data 0.5 1 1.5 SHERPA (a) ) jet )+N - l + l → *( γ (Z/ σ +1)/ jet )+N - l + l → *( γ (Z/ σ 0.2 0.4 0.6 0.8 1 1.2 1.4 1.6 1.8 2 = 7 TeV) s Data 2011 ( ALPGEN SHERPA + SHERPA AT H LACK B(leading jet) > 150 GeV
jet T
p
ATLAS Z/γ*(→ l+l-)+ ≥ 1 jet (l=e,µ)
-1 L dt = 4.6 fb
∫
anti-kt jets, R = 0.4 | < 4.4 jet > 30 GeV, |y jet T p 0/-1 1/0 2/1 3/2 4/3 NLO / Data 0.5 1 1.5 BLACKHAT + SHERPA 2/1 3/2 4/3 5/4 6/5 MC / Data 0.5 1 1.5 ALPGEN jet +1)/N jet (N 2/1 3/2 4/3 5/4 6/5 MC / Data 0.5 1 1.5 SHERPA (b)Figure 3. (a) Ratio of cross sections for successive exclusive jet multiplicities, Njet, in events
selected with the standard selection and (b) in events with at least one jet with pjetT > 150 GeV and |yjet
| < 4.4. The data are compared to NLO pQCD predictions from BlackHat+SHERPA corrected to the particle level, and the ALPGEN and SHERPA event generators (see legend for details). The error bars indicate the statistical uncertainty on the data, and the hatched (shaded) bands the statistical and systematic uncertainties on data (prediction) added in quadrature. The shaded bands on the theory calculations show the systematic uncertainty excluding the scale un-certainty (dark shaded) and the total systematic uncertainties using the naive approach (medium shaded) and the nominal approach (light shaded) to derive the scale uncertainty (see section 9). The figures include (a) a linear fit R(n+1)/n = Ro+ dRdn · n in the range R2/1 < R(n+1)/n < R5/4
and (b) a Poisson fit R(n+1)/n= ¯nn to the data points, with the free parameters Ro, dRdn and ¯n.
lute cross section as a function of the exclusive jet multiplicity and R
(n+1)/nafter requiring
two jets with m
jj> 350 GeV and |∆y
jj| > 3.0, in the following referred to as ‘VBF
pre-selection’. The data are consistent with the BlackHat+SHERPA prediction. SHERPA
describes the multiplicity well whereas ALPGEN overestimates R
3/2.
10.2
Jet transverse momentum
Differential cross sections with respect to the jet transverse momentum, p
jetT, provide a
test of pQCD over a large kinematic range. In particular, when p
jetTexceeds the scale
given by the gauge boson mass, NLO/LO K-factors can be large due to the presence of
QCD corrections of the order of αs
ln
2(p
jetT/mZ) [
4
]. In addition, higher-order electroweak
corrections are expected to reduce the cross section with increasing transverse momentum
of the Z boson candidate, by 5–20% for 100 GeV < p
``JHEP07(2013)032
) [pb] jet ) + N - l + l → *( γ (Z/ σ -3 10 -2 10 -1 10 1 10 2 10 = 7 TeV) s Data 2011 ( ALPGEN SHERPA + SHERPA AT H LACK B | > 3.0 jj y ∆ > 350 GeV, | jj mATLAS Z/γ*(→ l+l-)+ ≥ 2 jets (l=e,µ)
-1 L dt = 4.6 fb
∫
jets, R = 0.4 t anti-k | < 4.4 jet > 30 GeV, |y jet T p 0 1 2 3 4 5 NLO / Data 0.5 1 1.5 BLACKHAT + SHERPA 2 3 4 5 6 7 MC / Data 0.5 1 1.5 ALPGEN jet N 2 3 4 5 6 7 MC / Data 0.5 1 1.5 SHERPA (a) ) jet )+N - l + l → *( γ (Z/ σ +1)/ jet )+N - l + l → *( γ (Z/ σ 0.1 0.2 0.3 0.4 0.5 0.6 0.7 0.8 0.9 = 7 TeV) s Data 2011 ( ALPGEN SHERPA + SHERPA AT H LACK B | > 3.0 jj y ∆ > 350 GeV, | jj mATLAS Z/γ*(→ l+l-)+ ≥ 2 jets (l=e,µ)
-1 L dt = 4.6 fb
∫
jets, R = 0.4 t anti-k | < 4.4 jet > 30 GeV, |y jet T p 0/-1 1/0 2/1 3/2 NLO / Data 0.5 1 1.5 BLACKHAT + SHERPA 3/2 4/3 5/4 6/5 MC / Data 0.5 1 1.5 ALPGEN jet +1)/N jet (N 3/2 4/3 5/4 6/5 MC / Data 0.5 1 1.5 SHERPA (b)Figure 4. (a) Measured cross section for Z (→ ``) + jets as a function of the exclusive jet multi-plicity, Njet, and (b) ratio of the cross sections for two successive multiplicities, in events passing
the VBF preselection (at least two jets with pjetT > 30 GeV and |yjet| < 4.4 and mjj > 350 GeV and
|∆yjj| > 3.0 for the two leading jets). The other details are as in figure 3.
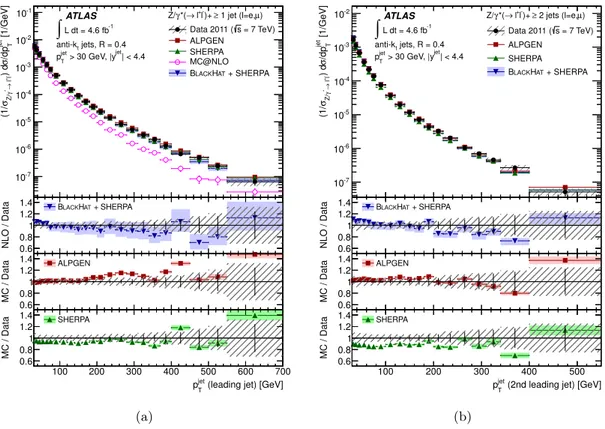
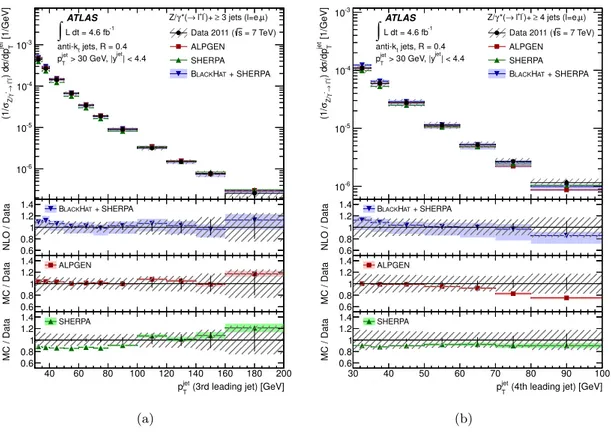
Figures
5
and
6
show the cross section as a function of p
jetTof the first, the second, the
third and the fourth leading jet (in descending order of p
jetT) for events with at least one,
two, three and four jets in the final state, respectively. The cross sections are normalized to
the inclusive Z (→ ``) cross section, which reduces the systematic uncertainties connected
to lepton identification and integrated luminosity. The fixed-order NLO predictions by
BlackHat+SHERPA are consistent with the data for all jet multiplicities.
For the leading jet, the precision of the measurement exceeds the precision of the theory
prediction. While ALPGEN predictions for the p
jetTspectrum of the second to fourth leading
jet are consistent with the data, the p
jetTspectrum of the leading jet is predicted to be too
hard for larger values of p
jetT. SHERPA is characterized by offsets to the data at the level of
5–15%, consistent with the observations presented in figure
2
(a) for the inclusive jet cross
section. MC@NLO predicts a too soft p
jetTspectrum, resulting in a discrepancy with the
data by one order of magnitude for large p
jetT. This is attributed to the fact that the fraction
of events with a second resolved jet, which in MC@NLO is modelled via the parton shower,
increases considerably with p
jetTof the leading jet (see figures
3
(a) and
3
(b) for small and
larger p
jetT(leading jet)). A too soft p
jetTspectrum of the parton shower will hence result in
an increasing discrepancy between the MC@NLO prediction and the data.
JHEP07(2013)032
[1/GeV] jet T /dp σ ) d -l + l → *γ Z/ σ (1/ -7 10 -6 10 -5 10 -4 10 -3 10 -2 10 -1 10 = 7 TeV) s Data 2011 ( ALPGEN SHERPA MC@NLO + SHERPA AT H LACK BATLAS Z/γ*(→ l+l-)+ ≥ 1 jet (l=e,µ)
-1 L dt = 4.6 fb
∫
jets, R = 0.4 t anti-k | < 4.4 jet > 30 GeV, |y jet T p 100 200 300 400 500 600 700 NLO / Data 0.60.8 1 1.2 1.4 BLACKHAT + SHERPA 100 200 300 400 500 600 700 MC / Data 0.60.8 1 1.2 1.4 ALPGEN(leading jet) [GeV] jet T p 100 200 300 400 500 600 700 MC / Data 0.60.8 1 1.2 1.4 SHERPA (a) [1/GeV] jet T /dp σ ) d -l + l → *γ Z/ σ (1/ -7 10 -6 10 -5 10 -4 10 -3 10 -2 10 = 7 TeV) s Data 2011 ( ALPGEN SHERPA + SHERPA AT H LACK B
ATLAS Z/γ*(→ l+l-)+ ≥ 2 jets (l=e,µ)
-1 L dt = 4.6 fb
∫
jets, R = 0.4 t anti-k | < 4.4 jet > 30 GeV, |y jet T p 100 200 300 400 500 NLO / Data 0.60.8 1 1.2 1.4 BLACKHAT + SHERPA 100 200 300 400 500 MC / Data 0.60.8 1 1.2 1.4 ALPGEN(2nd leading jet) [GeV] jet T p 100 200 300 400 500 MC / Data 0.60.8 1 1.2 1.4 SHERPA (b)
Figure 5. (a) Measured cross section for Z (→ ``) + jets as a function of the transverse momentum, pjetT, of the leading jet for events with at least one jet with pjetT > 30 GeV and |yjet| < 4.4 in the final state and (b) as a function of pjetT of the second leading jet for events with at least two jets. The cross sections are normalized to the inclusive Z (→ ``) cross section. The other details are as in figure2.
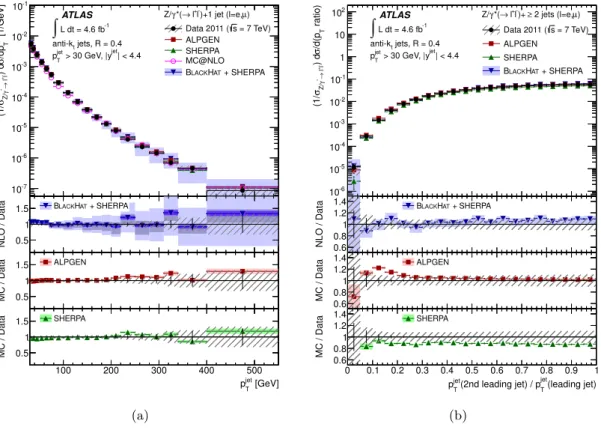
Figure
7
(a) shows the cross section as a function of p
jetTof the leading jet, normalized
to the inclusive Z (→ ``) cross section, when a veto on a second jet is applied. A better
agreement between the predicted and observed cross-sections is observed. For events with
at least two jets, figure
7
(b) shows the cross section as a function of the p
jetTratio of the two
leading jets, normalized to the inclusive Z (→ ``) cross section. ALPGEN overestimates the
cross section for events with a p
jetTratio of the leading jets in the range of 0.1–0.2. SHERPA
underestimates the cross section as a function of the p
jetTratio by ≈15%, consistent with
the results presented in figure
2
(a).
In a complementary approach, the cross section is measured as a function of the pT
of
the recoiling Z boson, reconstructed from the momenta of the two leptons. The results are
presented in figure
8
for both the inclusive and the exclusive Z (+1 jet) selection,
normal-ized to the inclusive Z (→ ``) cross section. Both ALPGEN and SHERPA predict a too
hard p
``Tspectrum, in particular in the inclusive case. The discrepancy with the data is
comparable to the expected higher-order electroweak corrections [
46
] although higher-order
QCD corrections could equally account for this. The BlackHat+SHERPA Z (+ ≥ 1 jet)
fixed-order calculation for the inclusive final state is too soft whereas for the exclusive final
JHEP07(2013)032
[1/GeV] jet T /dp σ ) d -l + l → *γ Z/ σ (1/ -6 10 -5 10 -4 10 -3 10 = 7 TeV) s Data 2011 ( ALPGEN SHERPA + SHERPA AT H LACK BATLAS Z/γ*(→ l+l-)+ ≥ 3 jets (l=e,µ)
-1 L dt = 4.6 fb
∫
jets, R = 0.4 t anti-k | < 4.4 jet > 30 GeV, |y jet T p 40 60 80 100 120 140 160 180 200 NLO / Data 0.60.8 1 1.2 1.4 BLACKHAT + SHERPA 40 60 80 100 120 140 160 180 200 MC / Data 0.60.8 1 1.2 1.4 ALPGEN(3rd leading jet) [GeV] jet T p 40 60 80 100 120 140 160 180 200 MC / Data 0.60.8 1 1.2 1.4 SHERPA (a) [1/GeV] jet T /dp σ ) d -l + l → *γ Z/ σ (1/ -6 10 -5 10 -4 10 -3 10 = 7 TeV) s Data 2011 ( ALPGEN SHERPA + SHERPA AT H LACK B
ATLAS Z/γ*(→ l+l-)+ ≥ 4 jets (l=e,µ)
-1 L dt = 4.6 fb
∫
jets, R = 0.4 t anti-k | < 4.4 jet > 30 GeV, |y jet T p 30 40 50 60 70 80 90 100 NLO / Data 0.60.8 1 1.2 1.4 BLACKHAT + SHERPA 30 40 50 60 70 80 90 100 MC / Data 0.60.8 1 1.2 1.4 ALPGEN(4th leading jet) [GeV] jet T p 30 40 50 60 70 80 90 100 MC / Data 0.60.8 1 1.2 1.4 SHERPA (b)
Figure 6. (a) Measured cross section for Z (→ ``) + jets as a function of the transverse momentum, pjetT, of the third leading jet for events with at least three jets with pjetT > 30 GeV and |yjet| < 4.4 in the final state and (b) as a function of pjetT of the fourth leading jet for events with at least four jets. The cross sections are normalized to the inclusive Z (→ ``) cross section. The other details are as in figure2.
state the central predictions are closer to the observed spectrum. This result is attributed
to missing higher jet multiplicities in the fixed-order calculation and will be discussed in
more detail in section
10.5
. The comparison with BlackHat+SHERPA yields no
indi-cation for missing higher-order electroweak corrections in the large-p
``T