© 2012 Pakistan Journal of Statistics 159 CARCASS WEIGHT ESTIMATION FROM SOME MORPHOLOGICAL TRAITS OF Capoeta capoeta capoeta (Güldenstädt, 1772) USING FACTOR
SCORES IN MULTIPLE REGRESSION ANALYSIS Ecevit Eyduran*1, Mehmet Topal2, Adem Yavuz Sonmez3
and Sıddık Keskin4
1Department of Animal Science, Faculty of Agriculture, Igdir University,
76000, Igdir-Turkey. Email: [email protected]
2Department of Animal Science, Faculty of Agriculture, Atatürk University,
25240, Erzurum-Turkey.
3Department of Aquaculture, Faculty of Agriculture, Atatürk University,
25240, Erzurum-Turkey.
4Department of Biostatistics and Medical Informatics, Faculty of Medicine,
Yuzuncu Yıl University, 65000, Van-Turkey. ABSTRACT
The aim of this study is to predict carcass weight from some morphological traits (total length, fork length, standard length, head length, body height and weight) by using jointly factor and multiple regression analyses. A total of 91 Capoeta capoeta capoeta fish was used to estimate carcass weight. The suitability of factor analysis was determined with Kaiser-Meyer-Olkin (KMO) measure of sampling adequacy (0.87) and Bartlett's test of sphericity
P0.01
. VARIMAX rotation was used to facilitate interpretation of factor loadings
Lik . Other morphological traits (total length, fork length, standard length, head length, body height, and weight) except for carcass weight were exposed to factor analysis. As a result of factor analysis, three latent variables were obtained from six morphological traits and considered as independent variables in multiple regression analysis. Additionally, carcass weight was used as a dependent variable in multiple regression analysis. The developed model was determined as0.484
CW FS1– 0.324 FS20.755 FS . The obtained results shown that, the three 3 selected factors had significant effects
P0.01
and explained 95.3% of variation in carcass weight. With using factor scores in the multiple regression analysis, carcass weight was predicted successfully by using these morphological traits.According to these results, it could be suggested that carcass weight might be increased by improving these morphological traits. The developed model might allow us to obtain beneficial clues for selection programs to be conducted on other fish species.
KEY WORDS
INTRODUCTION
Fish has been an important source of protein. In fisheries science, selection programs have been conducted to improve amount of meat per fish. Selection is a useful tool for fish breeding program. Information about the some morphological characteristics may be connected with fish meat (carcass weight) and this may be increased by a reasonable selection program. In next generations, some morphological traits (total length, fork length, standard length, head length, body height, weight) that have positive effects on carcass weight can be considered as indirect selection criteria. Determination of characteristics or traits that have favorable effect is possible with applying reliable statistical analyses for data set.
A simple way to predict carcass weight in fisheries science is the application of multiple regression analysis (MRA), consisting of a dependent variable (carcass weight) and several independent variables (various morphological measurements). However, using only MRA may lead to unreliable results in the estimation of carcass weight from a few morphological traits. Multicollinearity is a problem for MRA and jointly using factor and multiple regression analyses is necessary for removing this problem in MRA. Some authors studied on different species using both factor and multiple regression analyses (Keskin et al. (2007a), Keskin et al. (2007b), Eyduran et al. 2009, Sangun et al. 2009, Eyduran et al. 2010, Yilmaz et al. 2011). Similarly, principle component and multiple regression analyses can be jointly used.
In monitoring fish species such as Capoeta capoeta capoeta, it was reported that scientific studies had been conducted on topics such as stock estimation, condition factor, gonadosomatic index, reproduction time and location, suitable growth models, the length – age and length – weight relationships (Aras et al. 2009). Aydin et al. (2000) worked on monthly variation in blood glucose level in addition to total weight and fork length of Capoeta capoeta capoeta (Güldenstädt, 1772) living in Aras river, Turkey. Canbolat et al. (1999) studied on the age-length, age-weight, length-weight, and gender ratio of Capoeta capoeta capoeta (Güldenstädt, 1772) growing in the Lake Çıldır, Ardahan, Turkey. Elp and Karabatak (2007) investigated on the growth and reproduction of Capoeta capoeta capoeta (Güldenstädt, 1772) living in Lake Kockopru Dam, Van, Turkey. To our knowledge, there was no published report on using factor scores in MRA for predicting carcass weight from various morphological traits of Capoeta capoeta capoeta. Investigation on several morphological traits (total length, fork length, standard length, head length, body height, and weight etc.) affecting carcass weight of this species might provide valuable information to us for protecting and improving natural gene sources like this species.
The aim of this study is to develop a useful model in order to estimate carcass weight from several morphological traits (total length, fork length, standard length, head length, body height and weight) of Capoeta capoeta capoeta. Also, the developed model might provide useful information for selection programs to be maintained on other fish species in next generations.
MATERIALS AND METHODS
Capoeta capeta capoeta fish samples were caught from Hasankale watercourse, one of two systems which comprising Aras River. Hasankale watercourse is originated from Deveburnu position in the Hasankale district of Erzurum province, located in the Eastern Anatolia.
For some morphological traits, records from a total of 91 Capoeta capeta capoeta fish samples with different ages were utilized in the present study. These traits were total length (TL), fork length (FL), standard length (SL), head length (HL), body height (BH), weight (W), and carcass weight (CW).
Capoeta capeta capoeta samples were caught by throw nets that had 12 12 mm 2 openings with 6 kg. Morphological traits were measured with stringer board and electronic compass in the laboratory. Their age assignments were performed with counting age circles in scales between dorsal and lateral line. Weights were measured with digital balances to 0.01 g sensitivity.
The effects of gender and age factors on each trait were determined with General Linear Model. The effect of age for each trait was significant
P0.05
, whereas the effect of sex was insignificant. Thus, all morphological traits were standardized according to (third) age. Because, number of the fish with three age was more than number of the age groups.The suitability of factor analysis was detected with Kaiser-Meyer-Olkin (KMO) measure of sampling adequacy and Bartlett's test of sphericity (Sharma, 1996). Kaiser-Meyer-Olkin (KMO) measure of sampling adequacy is known as a measure of homogeneity of variables. High KMO value is desired for Factor analysis (Sharma, 1996). Bartlett's test of sphericity is used to determine whether the correlation matrix is an identity matrix, which illustrates that factor analysis is not suitable (Eyduran et al. 2010).
The basic factor analysis equation can be written in matrix form as follows: Z F
where Z is a p vector of variables, is a pxm matrix of factor loadings, 1 F is an mx1 vector of factors and is a p vector of error or residual factors (Sharma, 1996). 1 On account of differences in the units of variables used in factor analysis, the variables were standardized and a correlation matrix of variables was used to find eigenvalues. VARIMAX rotation was used with the aim of facilitating interpretation of factor loadings
Lik . Factor coefficients
Cik were used to achieve factor scores for selected factors. Factors that have eigenvalues greater than 1 were included in multiple regression analysis (Sharma, 1996; Tabachnick and Fidell, 2001; Johnson and Wichern, 2002). When multicollinearity problem is observed in multiple regression analysis, jointly use of Factor analysis with multiple regression analysis will be more suitable approach for removing this problem.Score values according to the chosen factors were used as independent variables for the prediction of carcass weight. The multiple regression equation for fitting standardized carcass weight and factor score values can be written as follows:
1 1 2 2 3 3
CW a b FS b FS b FS e
where a, regression constant (it is the value of intercept and its value is zero); b b and 1, 2
3
b are regression coefficients (slopes) of Factor Scores (FS). FS is factor score and e is the error term. Regression coefficients were tested by a t-statistic.
For estimating carcass weight, data were analyzed with using factor scores in multiple regression analysis. The effectiveness of multiple regression analysis were determined by criteria such as the coefficient of determination
R , Root of Mean Square Error 2
RMSE S
, and Variance Inflation Factor (VIF), as an indicator of multicollinearity, which should be less than 10. All the statistical analyses were performed with MINITAB and SPSS (2004) statistical package program (www.minitab.com).RESULTS AND DISCUSSION
Pearson’s correlation coefficients among all the biological traits are given in Table 1. Carcass weight (CW) was highly-positively correlated with all the morphological traits
P0.01
.Table 1
Pearson’s correlation coefficients among all the measurements
TL FL SL HL BH W FL 0.989** SL 0.881** 0.891** HL 0.816** 0.798** 0.711** BH 0.802** 0.790** 0.694** 0.906** W 0.908** 0.897** 0.788** 0.783** 0.789** CW 0.877** 0.862** 0.724** 0.788** 0.786** 0.977**
**P0.01 Total length (TL), fork length (FL), standard length (SL), head length (HL), body height (BH), weight (W), and carcass weight (CW).
Results of Kaiser-Meyer-Olkin (KMO) measure of sampling adequacy (0.87) and Bartlett's test of sphericity
P0.01
reflected that factor analysis can be applied to the independent variables set.Factor score coefficients, rotated factor loadings and communalities in factor analysis of independent variables are presented in Table 2. According to results of factor analysis, three factors whose eigenvalues were greater than 1 were determined among six factors. 96.7% (5.8007/6) of total variation of TL, FL, SL, HL, BH, and W variables in the factor
analysis was explained by these selected factors. Communalities for TL, FL, SL, HL, BH and W were found to be high values ranging from 0.953 to 0.980. For example, a communality value of 0.980 for SL means that 98% of variation in SL was accounted for by three factors.
36.1% (2.1649/5.8007), 32.6% (1.9561/5.8007) and 28.0% (1.6797/5.8007) of total variance in factor analysis were explained by Factor 1, Factor 2 and Factor 3, respectively. A high rotated factor loading is desired in the factor analysis. The factor loading is known as correlation between a variable and a factor. This indicates the strength of the relationship between factor and original variable. HL and BH produced highest loadings in Factor 1, and TL, FL and SL in Factor 2, while W gave the highest loading in Factor 3 (Table 2).
Table 2
Results of factor analysis
Variables
Factor Score Coefficients
cikRotated Factor Loadings
likand Communalities
Factor 1 Factor 2 Factor 3 Factor 1 Factor 2 Factor 3 Communality
TL -0.204 -0.148 0.416 0.458 -0.623 0.611 0.973 FL -0.236 -0.249 0.342 0.436 -0.650 0.598 0.970 SL -0.175 -1.335 -0.911 0.347 -0.866 0.331 0.980 HL 0.827 0.096 -0.497 0.847 -0.363 0.325 0.954 BH 0.817 0.283 -0.287 0.851 -0.315 0.360 0.953 W -0.307 0.706 1.426 0.450 -0.405 0.777 0.970 VARIANCE 2.1649 1.9561 1.6797 5.8007 % VARIANCE 0.361 0.326 0.280 0.967
Total length (TL), fork length (FL), standard length (SL), head length (HL), body height (BH), weight (W), and carcass weight (CW).
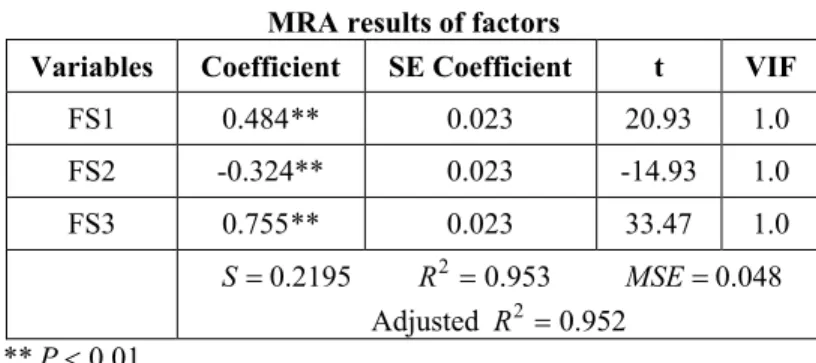
Factor score values obtained from factor score coefficients are depicted in Table 2. Results of MRA for the estimation of carcass weight with factor scores (independent variables) are illustrated in Table 3. These three factors explained 95.3% of total variation in carcass weight. Multicollinearity problem was eliminated by using factor scores as independent variables in MRA because VIF values became equal to one. This means that using factor scores for MRA gave reliable results. As seen from Table 3, all the regression coefficients (slopes) of the independent variables (factors) for the prediction of carcass weight were statistically significant at 1% level. Factor 1 and Factor 3 have positive significant effects on carcass weight, while Factor 2 was found negatively-significant. Carcass weight would be expected to progress by increasing Factor 1 and Factor 3. Fish that have higher HL and BH would tend to be higher carcass weight. Similarly, fish with higher W would be having high carcass weight. With increasing TL, FL, and SL in Factor 2, CW weight would be expected to increase. Signs (negative) of factor loadings of TL, FL, and SL in Table 2 are the same as FS2 in Table 3. Carcass weight is improved by increasing six morphological traits, TL, FL, SL, HL, BH, and W.
Table 3 MRA results of factors
Variables Coefficient SE Coefficient t VIF
FS1 0.484** 0.023 20.93 1.0 FS2 -0.324** 0.023 -14.93 1.0 FS3 0.755** 0.023 33.47 1.0 S 0.2195 R2 0.953 MSE 0.048 Adjusted R2 0.952 **P0.01
Results of some studies on jointly using factor analysis scores with a multiple regression model were mentioned below. In similar studies carried out on different species, Keskin et al. (2007a) reported that 75.4% of variation in daily milk yield in goat was explained by four selected factors. Keskin et al. (2007b) stated that three selected factors accounted 83.9% of variation in carcass weight of Akkeci kids. In an investigation by Eyduran et al. (2009) on Norduz lambs, it was stated that 80% of total variation in weaning weight was explained by three factors selected by using factor analysis. Sangun et al. (2009) conducted a study in order to predict body weight from various body measurements (total length, standard length, fork length, head length, body depth, body circuit, and body height) in Lizardfish. It was reported that three selected factors explained 98.4% of total variation in the body weight. In another study carried out by Eyduran et al. (2010) in order to estimate body weight from several biometrical traits viz. total and fork lengths, body height, head length, adipose fin width and adipose fin length of Salmo trutta fario trouts with a sample of 140 Salmo trutta fario trouts (70 male and 70 female), these authors stated that the selected three factors explained 70.3 and 55.3% of variation in body weight for male and female trouts, respectively. Coefficient of determination
R2 found by using factor scores in the current paper were higher than those reported by Keskin et al. (2007a), Keskin et al. (2007b), Eyduran et al. (2009) and Eyduran et al. (2010), but a bit lower than that of Sangun et al. (2009). Finding on elimination of multicollinearity problem in the current study was in agreement with findings of some authors, who mentioned that multicollinearity problem was removed with the use of factor score in MRA (Sharma, 1996; Keskin et al. (2007a), Keskin et al. (2007b), Eyduran et al. (2009), Sangun et al. (2009) and Eyduran et al. 2010.CONCLUSION
In the current study, one of the ways of determining multicollinearity problem and removing this problem in multiple regression analysis was discussed. Using only multiple regression analysis due to the problem may lead to insufficient and untrustworthy interpretations in biological meaning. As the problem could be eliminated with using factor and multiple regression analyses jointly, it was concluded that a trustworthy prediction of carcass weight is possible with combining these two analysis techniques. The combined approach providing elimination of indirect relationships among independent variables might contribute to a good estimation of carcass weight from the
morphological measurements. Thus, carcass weight might be improved by selection programs considering these morphological traits (total length, fork length, standard length, head length, body height and weight) in a breeding program.
REFERENCES
1. Aras M., Gunes M., Bayir A., Sirkecioglu A.N. and Haliloglu, H.I. (2009). The comparison of total fat and fatty acid profiles with some bio-ecological features of Capoeta capoeta umbla HECKEL, 1843 living in Tuzla Stream and Tercan Dam Lake. Ecology, 73, 55-64.
2. Aydın S., Yildirim A. and Erdogan, O. (2000). The monthly variations in the blood glucose level of Capoeta capoeta capoeta (Güldenstaedt, 1772) living in Aras river. Turk. J. Vet. Anim. Sci., 24, 523-528.
3. Canbolat A.F., Yerli S.V. and Caliskan, M. (1999). The Investigation of Growth parameters of Capoeta capoeta capoeta (Güldenstädt, 1772) growing in Çıldır lake (Ardahan, Kars). Turk. J. Zoology, 23(supplement 1), 225-232.
4. Elp M. and Karabatak, M. (2007). A study on Capoeta capoeta (Güldenstädt, 1772) population living in Kockopru dam lake, Van-Turkey. J. Applied Biological Sci., 1(2), 57-61.
5. Eyduran E., Karakus K., Karakus S. and Cengiz, F. (2009). Usage of factor scores for determining relationships among body weight and body measurements. Bulgarian J.
Agri. Sci., 15(4), 374-378.
6. Eyduran, E., Topal, M. and Sonmez, A.Y. (2010). Use of factor scores in multiple regression analysis for estimation of body weight by several body measurements in brown trouts (Salmo trutta fario). Int. J. Agric. Biol., 12, 611-615.
7. Johnson R.A. and Wichern, D.W. (2002). Applied multivariate statistical analysis. Prentice Hall, upper Saddle River, New Jersey. 766 pp.
8. Keskin S., Kor, A. and Karaca, S. (2007a). Use of factor analysis scores in multiple linear regression model for determining relationships between milk yield and some udder traits in Goats. J. App. Animal Res., 31, 185-188.
9. Keskin S., Daskiran, I. and Kor, A. (2007b). Factor analysis scores in a multiple linear regression model for the prediction of carcass weight in Akkeci kids. J. App. Animal Res., 31, 201-204.
10. Sangun L., Cankaya S., Kayaalp G.T. and Akar, M. (2009). Use of factor analysis scores in multiple regression models for estimation of body weight from somebody measurements in Lizardfish. J. of Animal and Veterinary Advances, 8(1), 47-50. 11. Sharma, S. (1996). Applied multivariate techniques. John Wiley and Sons, inc., New
York, 493 pp.
12. SPSS 2004. SPSS for Windows Release 13.0 SPSS Inc.
13. Tabachnick B.G. and Fidell, L.S. (2001). Using multivariate statistics. Allyn and Bacon Pearson Education Company Boston, USA, 966 pp.
14. www.minitab.com.
15. Yilmaz, I., Eyduran, E., Kaygisiz, A. and Javed, K. (2011). Estimates of genetic parameters for lactation shape parameters with multivariate statistical technique in brown swiss cattle. Int. J. Agric. Biol., 13, 174-178.