TURKISH ECONOMY COOLES DOWN
Zümrüt İmamoğlu* ve Barış Soybilgen†
Executive Summary
Betam revised its second quarter growth forecast according to new data released for May. We expect real GDP to rise 0.3 percent in the second quarter from the previous quarter, less than our previous forecast of 0.5 percent. We estimate the year on year growth in real GDP to be 6.6 percent from the same quarter of the previous year.
With the slowdown in GDP growth, we believe that there is less need for tightening policies; however, fiscal stance should remain tight because the current account deficit is still high. We expect the current account deficit to reach 9.0 percent of GDP by the end of second quarter.
Tablo1. Betam’s quarterly and annual growth forecasts and realizations
Source: Betam. *sa: seasonally and calendar day adjusted
* Dr. Zümrüt İmamoğlu, Betam, Research Associate.
† Barış Soybilgen, Betam, Research Assistant
[email protected] 2011 1. Quarter Forecast 2011 1. Quarter Realized 2011 2. Quarter Forecast Real GDP growth, %
(quarter on quarter, sa*) 1.6 1.4 0.3
Real GDP growth, %
(year on year) 10.6 11.0 6.6
Current account deficit
(% of GDP, annual) 7.9 7.9 9.0
Economic Outlook and Forecasts:
July 2011
Economy cooled down in the second quarter
Table 2 shows the monthly indicators Betam follows and their seasonally adjusted monthly and quarterly percent changes. Consumption and investment demand are decreasing but the trade deficit remains high. The good news is that imports have been decreasing since February which might help to curb the trade deficit.
Our second quarter forecast depends on April and May data plus limited amount of data for June. According to indicators that are announced so far, our real GDP QoQ forecast is 0.3 percent and YoY forecast is 6.6 percent.
Small increase in consumption
Consumption indicators gave mixed signals in May. Imports of consumption goods fell by 5 percent. Special consumption tax (SCT) revenue and automobile production decreased by 4 percent each while durable and non-durable goods production increased. Consumer confidence index fell both in April and May, but on average consumer confidence index in the second quarter is still above first quarter level. Overall, we expect a small increase in consumption in the second quarter.
Investment decreased
As of July, we have the data for capacity utilization rate (CUR) in April, May and June and industrial production index (IPI) for April and May. IPI continued its gradual downward trend in the second quarter and fell by 0.3 percent in May. CUR increased very little in June after the 1 percentage point fall in May.
Imports of investment goods increased by 7.4 percent while investment goods production decreased by 2.4 percent in May. Looking at these changes, we expect investment to decrease in the second quarter.
Trade deficit is still high
Figure 2 shows monthly changes of seasonally adjusted import and export volume indices. Exports decreased more than imports in May. Export volume index fell by 6 percent and import volume index decreased by 1.5 percent, but on a quarterly basis we expect exports to increase more than imports and this will help to shrink the trade deficit. Preliminary export data for June announced by the Turkish Exports Assembly (TIM) support our view, demonstrating a strong increase in exports in June. The contribution of net exports to GDP will be positive in the second quarter.
Current account deficit will be 9 percent
Current account deficit in May was announced as $7.8 billion which is slightly higher than last month’s $7.6 billion figure. The fall of exports in May caused current account deficit to rise, even though tourism income began to increase. On the other hand if imports continue to decline in June and by the help of high tourism income in summer months, current account deficit might decrease in the coming months.
Forecasts
Betam releases its GDP and current account forecasts on a monthly basis. Table 1, summarizes Betam’s first and second quarter forecasts and the realized first quarter growth rates. We expect the real GDP to grow by 0.3
Aaaaaaaaaaaaaaaaaaaaaaaaaaaaaaaaaaaaaaaa aaaaaaaaaaaaaaaaaaaaaaaaaaaaaaaaaaaaaaaa aaaaaaaaaaaaaaaaaaaaaaaaaaaaaaaaaaaaaaaa aaaaaaaaaaaaaaaaaaaaaaaaaaaaaaaaaaaaaaaa aaaaaaaaaaaaaaaaaaaaaaaaaaaaaaaaaa
percent in the second quarter of 2011 from the previous quarter and by 6.6 percent in the second quarter from the same quarter of the previous year. Betam also expects current account deficit to reach 9.0 percent of GDP in the second quarter.
Table 2. Monthly and quarterly changes of Betam’s selected indicators (real and sa)
Indicators April May June 2010 4.
Quarter
2011 1. Quarter1
Exports 5,9 -6.0 ** -3.1 2.7
Imports -2.6 -1.5 ** 1.0 0.3
Intermediate goods import -2.5 -1.9 ** 2.7 -1.6
Consumer goods import -5.8 -4.9 ** 3.0 -0.7
Investment goods import -6.6 7.4 ** -4.0 9.8
Industrial Production Index (IPI) -0.2 -0.3 ** 2.2 -1.3
Nondurable consumer goods -0.8 1.5 ** 1.1 -0.2
Durable consumer goods -1.6 3.8 ** 4.4 1.9
Intermediate goods -1.2 1.4 ** 1.5 -1.2
Investment goods -3.8 -2.4 ** 4.3 -4.4
Capacity Utilization Rate (CUR) -0.4 -1.0 0.0 1.4 -1.2
Nondurable consumer goods -0.9 0.4 0.3 -0.2 -0.3
Durable consumer goods -1.1 -2.5 2.2 3.6 -1.4
Intermediate goods -0.7 0.4 0.2 0.3 -1.6
Investment goods 0.4 -1.3 0.6 2.9 0.2
Soft Data
Consumer confidence index (Turkstat)
-0.2
-0.7 ** 1.5 0.2
Reel sector confidence index -3.7 0.4 -1.0 -1.2 -4.2
Financial Data
IMKB 100 (Stock Exchange) 3.3 -4.0 -0.3 -4.4 -0.0
Other
Special consumer tax* (SCT) 4.9 -4.5 ** -5.6 3.1
Automobile production -11.9 -4.1 ** 2.1 -12.6
Source: TurkStat, CBRT, Treasury, ISE, Betam. All series are real (or inflation adjusted) wherever necessary and seasonally adjusted. *This tax is collected on sales of goods such as gas, fuel oils, alcohol, tobacco products and automobiles.
**Data not yet released.
1
Figure 1: Capacity utilization rate and industrial production index (sa. left axis for CUR and right axis for IPI)
60 65 70 75 80 85 Ja n-07 Ap r-07 Ju l-0 7 Oct -0 7 Ja n-08 Ap r-08 Ju l-0 8 Oct -0 8 Ja n-09 Ap r-09 Ju l-0 9 Oct -0 9 Ja n-10 Ap r-10 Ju l-1 0 Oct -1 0 Ja n-11 Ap r-11 95 100 105 110 115 120 125 130 CUR IPI
Source : TurkStat. Betam
Figure 2: Volume indices of exports and imports (sa) 120.00 130.00 140.00 150.00 160.00 170.00 180.00 190.00 200.00 210.00 Ja n-07 Ma y-07 S ep-07 Ja n-08 Ma y-08 S ep-08 Ja n-09 Ma y-09 S ep-09 Ja n-10 Ma y-10 S ep-10 Ja n-11 Ma y-11 Export Import
Source : TurkStat. Betam
Figure 3: Ratio of current account deficit to GDP (yearly)
Current Account Deficit (% of GDP)
0.0 1.0 2.0 3.0 4.0 5.0 6.0 7.0 8.0 9.0 10.0 2007 (Q 2) 2007 (Q 3) 2007 (Q 4) 2008 (Q 1) 2008 (Q 2) 2008 (Q 3) 2008 (Q 4) 2009 (Q 1) 2009 (Q 2) 2009 (Q 3) 2009 (Q 4) 2010 (Q 1) 2010 (Q 2) 2010 (Q 3) 2010 (Q 4) 2011 (Q 1) 2011 (Q 2)
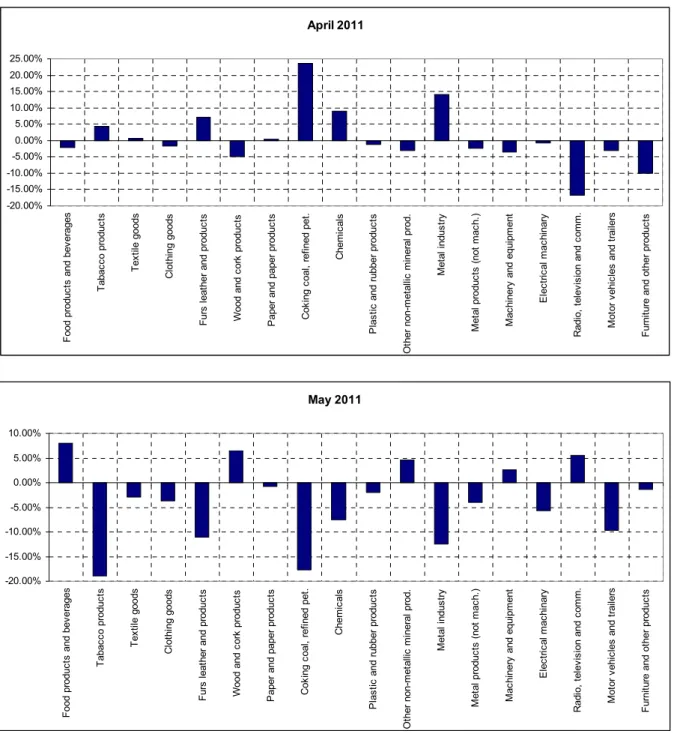
Figure 4: Monthly changes of manufacturing industry exports (sa)
Source: TurkStat. Betam
May 2011 -20.00% -15.00% -10.00% -5.00% 0.00% 5.00% 10.00% F ood pr oduc ts and bev erages T abac co produc ts T ex til e goods C lot hi ng goods F urs leat her and pr oduc ts Wood and co rk produc ts P aper and paper pr oduc ts C ok ing c oal , ref ine d pet . C hem ic al s P las tic and r ubber pro duc ts O ther non-m et allic m in er al p ro d. M et al indus tr y M et al produc ts (not m ac h. ) M ac hi nery and e qui pm ent E lec tr ic al m ac hi nary R adi o, t el ev is ion and c om m . M ot or v ehi cl es and t rai le rs F urni tur e and ot her pr oduc ts April 2011 -20.00% -15.00% -10.00% -5.00% 0.00% 5.00% 10.00% 15.00% 20.00% 25.00% F ood produc ts and bev erages T abac co produc ts T ex til e goods C lot hi ng goods F urs leat her and produc ts Wood and c or k produc ts P aper and paper produc ts C ok ing c oal , r ef ined pet . C hem ic al s P las tic
and rubber produc
ts O ther non-m et al lic m iner al prod. M et al indus tr y M et al pr oduc ts ( not m ac h. ) M ac hi nery an d equi pm ent E lec tr ic al m ac hi nary R adi o, t el ev is ion and c om m . M ot or v ehi cl es and t rai le rs F ur ni ture and ot her produc ts